
Abstract
Objective:
This case-control study explored correlations between LP-PLA2 gene polymorphisms (A379V, V279F, and R92H) and susceptibility and severity of acute pancreatitis (AP) in a Chinese population.
Materials and Methods:
From October 2013 to October 2015, 94 AP patients were chosen as the case group. According to the Acute Physiology and Chronic Health Evaluation (APACHE) II score standard, AP patients were divided into a mild AP (MAP) group (n = 46) and severe AP (SAP) group (n = 48). The 48 SAP patients were further divided into an SAP with multiple organ dysfunction syndrome (MODS) group (n = 42) and SAP without MODS group (n = 6). Meanwhile, 96 healthy subjects who received physical examinations at the study hospitals were selected as the control group. Serum lipoprotein-associated phospholipase A2 (LP-PLA2) levels were detected by an enzyme-linked immunosorbent assay (ELISA). The A379V (s1051931), V279F (rs16874954), and R92H (rs13989) polymorphisms of the LP-PLA2 gene were detected by polymerase chain reaction-restriction fragment length polymorphism (PCR-RFLP).
Results:
There were significant differences in the frequencies of the LP-PLA2 gene polymorphisms between the AP group and the control group. The distribution of V279F-AA+AC genotype and R92H-AA+AG genotype in the AP group was higher than that in the control group, whereas the SAP group and SAP with MODS group distributions were higher than those in the MAP group and SAP without MODS group (both p < 0.05). G-C-A, G-A-G, and G-C-G haploids formed by A379V, V279F, and R92H may be associated with AP susceptibility. LP-PLA2 gene polymorphisms could affect serum LP-PLA2 level, whereas the V279F-A allele gene, the R92H-A allele gene, serum LP-PLA2 level, and serum amylase may be independent risk factors for AP (all p < 0.05).
Conclusion:
These results demonstrated that the LP-PLA2 gene polymorphisms, V279F and R92H, may be associated with susceptibility to and severity of AP.
Introduction
A
There are three stages of AP progression: (1) pancreatic activation of trypsin, (2) intrapancreatic inflammation mediated by activated leukocytes and macrophages, and (3) extrapancreatic inflammatory responses (Lee et al., 2013). Diagnosis and interventions for AP patients that are made in the first 24 h, the so-called golden hours, are crucial for successful AP treatment that decreases disease incidence and mortality while improving prognosis (Fisher and Gardner, 2012). Although the present treatment for mild AP cases involves pain control, modification of electrolyte and metabolic imbalances, and intravenous infusion (Seta et al., 2014), there is still no targeted pharmacological therapy available to treat AP (Zhu et al., 2014; Janisch and Gardner, 2015).
Moreover, genetic polymorphisms that are related to AP pathogenesis might be a new research avenue for developing therapeutic approaches for AP.
Lipoprotein-associated phospholipase A2 (LP-PLA2), also named platelet-activating factor acetylhydrolase (PAF-AH) or type VIIA PLA2, is a member of the phospholipase A2 (PLA2) family. LP-PLA2 is a calcium-independent PLA2 enzyme that produces proinflammatory cytokines, including oxidized nonesterified fatty acids (oxNEFAs) and lysophosphatidylcholine (lyso-LPC) (Chauffe et al., 2010). The production of oxidized phospholipids by LP-PLA2 is associated with endothelial dysfunction, plaque necrosis, and inflammatory response (Lp-PLA(2) Studies Collaboration et al., 2010). PLA2 is also involved in the pathophysiological mechanism of inflammatory diseases such as adult respiratory distress syndrome (ARDS) (Zhang et al., 2013).
Furthermore, LP-PLA2 is implicated in atherosclerosis, in that LP-PLA2 gene polymorphisms might be associated with occurrence of coronary heart disease and diabetes mellitus (Zheng et al., 2011; Nelson et al., 2012). Inhibition of PLA2 activity can decrease lipase and amylase activity, as well as hemorrhage, edema, and pancreatic necrosis, suggesting that LP-PLA2 could be an effective target for treating AP. However, there is limited information regarding the role of LP-PLA2 gene polymorphisms in development and progression of AP. Therefore, this study explored the correlations between LP-PLA2 gene polymorphisms (A379V, V279F, and R92H) and susceptibility and severity of AP in a Chinese population.
Materials and Methods
Ethics statement
This study was approved by the Ethics Committees of Laiwu City People's Hospital, Shaanxi Second Provincial People's Hospital, and China-Japan Union Hospital of Jilin University. Written informed consent was obtained from all subjects.
Research subjects
From October 2013 to October 2015, 94 patients with AP were selected from Laiwu City People's Hospital, Shaanxi Second Provincial People's Hospital, China-Japan Union Hospital of Jilin University, and the Maternal and Child Healthcare Hospital of Linyi. These patients constituted the AP group. Among these patients, 45 were males and 49 were females; the mean age was 46.2 ± 13.6 years and the mean weight was 57.4 ± 11.4 kg. The inclusion criteria were patients who were admitted to the hospital and diagnosed with AP within 72 h of admission. Diagnostic criteria of AP included typical clinical manifestations of nausea and vomiting, abdominal pain, and abdominal distension. Abdominal symptoms included abdominal distension, muscle tension, rebound tenderness, pressing pain, and abdominal mass.
Laboratory examinations were made for relevant indicators of AP and to exclude other diseases. Laboratory confirmation of AP required serum C-reactive protein (CRP) ≥10 mg/L and serum lipase >60 IU/L (reference interval 15-60 IU/L) or serum amylase >200 IU/L (reference interval 25-125 IU/L). Included patients had imaging examinations that showed low echo image, no echo image, or high density, which also suggested pancreatic enlargement, edema, or cell infiltration (Ihse et al., 1994).
Patients were excluded if they had familial hereditary pancreatitis due to other causes, recurrent pancreatitis with acute abdomen, or metabolic dysfunction or organ dysfunction due to a series of underlying diseases before AP onset. Patients were observed in real time to monitor changes in disease course after admission and to note the presence of necrosis, infection, ARDS, SIRS, multiple organ dysfunction syndrome (MODS), or other complications. The diagnostic results for initiating factors, including alcohol consumption, gallstones, pancreatic trauma, hyperlipidemia, and hypercalcemia, were collected for all patients. The Acute Physiology and Chronic Health Evaluation System (APACHE II) score and other related indicators of laboratory tests such as serum lipase, serum amylase, and CRP were all improved after treatment.
According to the APACHE II score standard (Pienkowska et al., 2016), the AP patients were divided into mild AP (MAP) and SAP. Patients with APACHE II scores <8 and ≥8 were defined as MAP and SAP patients, respectively. SAP patients were further divided into SAP with MODS and SAP without MODS groups. A total of 96 healthy people who had a physical examination at the study hospitals during the study period were selected as the control group. Of these individuals, 51 and 45 were males and females, respectively. Their mean age was 48.4 ± 13.8 years and the mean weight was 57.7 ± 9.1 kg.
Enzyme-linked immunosorbent assay for determination of serum LP-PLA2 concentration
Peripheral venous blood samples (2 mL) were taken from all study subjects after a 12-h fast. Samples were collected in acid-citrate-dextrose (ACD) anticoagulant tubes (Shanghai Haling Biotechnology Co., Ltd.) and kept at room temperature for 2 h. Serum and white blood cells from the samples were obtained by centrifugation at 3000 rpm for 10 min and were maintained at −80°C before analysis. An enzyme-linked immunosorbent assay (ELISA) kit (American R&D System) was used to determine serum lipoprotein-associated phospholipase concentrations.
Genotyping
Polymerase chain reaction-restriction fragment length polymorphism (PCR-RFLP) was used to detect A379V, V279F, and R92H polymorphisms of the lipoprotein-associated phospholipase gene. A noncentrifuged blood genomic DNA extraction kit (TianGen Biech Co., Ltd., Beijing, China) was used to extract DNA from white blood cells. Primer 5.0 software (Sinogenomax Co., Ltd., Beijing, China) was used to design primers specific for the A379V, V279F, and R92H exons of LP-PLA2. The annealing temperature and cycle times were repeatedly adjusted to optimize the reaction conditions, and polyacrylamide gel electrophoresis (PAGE) was used to determine the concentrations of the primers in PCRs (Table 1).
F, forward primer; PCR, polymerase chain reaction; R, reverse primer.
PCRs had a total volume of 15 μL and contained 0.3 μL/L dNTP, 1.2 μL/L Mg2+, 0.5 μL template, 0.1 μL Taq buffer polymerase, 11 μL dH2O, 0.1 μL Taq DNA polymerase, and 0.2 μM each of upstream and downstream primers. PCRs were carried out with predenaturation for 5 min at 94°C, followed by 25 cycles of denaturation for 40 s at 94°C, annealing for 45 s at 5°C, and extension for 35 s at 72°C. In the final cycle, the 72°C incubation was extended to 8 min. The single-chain product was maintained at 4°C and the reaction process was stopped.
For restriction enzyme digestion and electrophoresis, 10 μL of the above PCR product was mixed with 1.5 μL 10 × buffer R, 0.1 μL enzyme (10 U/μL), and 3.5 μL dH2O. The 15 μL reaction mixture was incubated overnight so that the digestion proceeded for 16 h at 37°C. At the completion of the restriction enzyme digestion, 10 μL of the mixture was subjected to electrophoresis on a 3% agarose gel (Beijing RuiDa HengHui Science & Technology Development Co., Ltd.) for 30 min at 150 V constant voltage in Tris-borate EDTA (TBE) buffer (Shanghai Bioleaf Biotech Co., Ltd). Each enzyme reaction was paired with a negative control that lacked the restriction enzyme to ensure the accuracy of enzyme digestion. Genotyping ultimately was conducted by enzyme electrophoresis.
Statistical analysis
All data were analyzed with SPSS 21.0 statistical software. The enumeration data were expressed as a percentage and as a rate. A chi-square test was used for comparison between groups. The measurement data are expressed as mean ± standard deviation. Comparisons between the two groups were analyzed by t-test, and the means among the three groups were compared by variance analysis. A chi-square test was used to determine genotype and allele frequency, whereas Hardy-Weinberg's law of equilibrium was applied to test group representation. A value of p < 0.05 indicated statistical significance.
Results
Comparisons of baseline characteristics between the AP and control group and between the MAP and SAP groups
There were 94 AP patients enrolled in the AP group, including 46 MAP patients and 48 SAP patients, whereas 96 healthy subjects comprised the control group. Compared with the control group, some indices for serum lipase, serum amylase, serum CRP, and other relevant laboratory indicators were higher in the AP group (all p < 0.05; Table 2). The APACHE II scores, complications, and other factors for SAP group patients were significantly higher compared with patients in the MAP group (p < 0.05), but there was no statistical significance in etiological diagnosis between the two groups (p > 0.05; Table 3).
AP, acute pancreatitis; APACHE II, acute physiology and chronic health evaluation; ARDS, adult respiratory distress syndrome; serum CRP, serum C-reactive protein; MODS, multiple organ dysfunction syndrome; SIRS, systemic inflammatory response syndrome.
MAP, mild AP; SAP, severe AP.
Genotype and allele distributions of LP-PLA2 gene polymorphisms
By comparison, there were statistically significant differences in the V279F and R92H locus genotype and allele distributions between the AP group and control group, MAP group and SAP group, SAP with MODS group, and SAP without MODS group (all p < 0.05; Table 4). Since few patients carried the AA genotype, the AA and AC genotypes were processed together, and those with polymorphisms at the V279F site had a higher distribution in the AP group relative to the control group. Furthermore, there was a higher distribution of this polymorphism in the SAP group compared with the MAP group, and the distribution of the SAP with MODS group was higher than the SAP without MODS group (Tables 5 and 6).
95% CI, 95% confidence interval; LP-PLA2, lipoprotein-associated phospholipase A2; OR, odds ratio.
Meanwhile, the AG and AA genotype distribution of the R92H site also conformed to this trend, so the A allele of the V279F and R92H sites was considered to be an important factor for AP morbidity and severity. There was no statistically significant difference for the A379V genotype and allele distributions in all groups (all p > 0.05).
Correlation between serum LP-PLA2 level and AP risk
The serum LP-PLA2 level was significantly higher in the AP group than the control group (29.5 ± 3.2 vs. 18.4 ± 5.1; p < 0.05; Fig. 1). Meanwhile, the serum LP-PLA2 level was significantly higher in the SAP group (31.3 ± 2.3) than the MAP group (27.6 ± 0.9; p < 0.05), indicating that serum LP-PLA2 levels increased with illness severity. A comparison of serum LP-PLA2 levels for each genotype in the AP group and control group indicated that the serum LP-PLA2 level in patients with the A allele of V279F or R92H was significantly higher than that for patients with other genotypes (both p < 0.05; Table 7). A comparison of the MAP and SAP groups also followed this trend (Table 8). Finally, there was no relationship between A379V and serum LP-PLA2 levels.
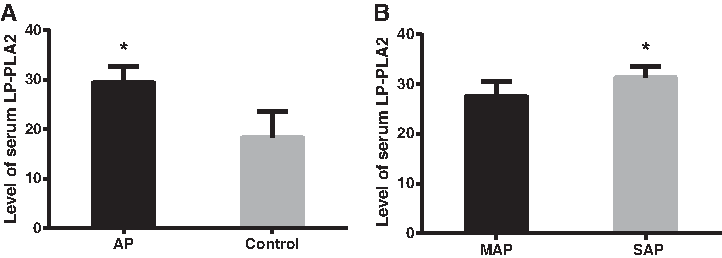
Comparison of serum LP-PLA2 levels between the AP group and control group.
Correlation between LP-PLA2 gene polymorphism and clinical features of AP patients
A comparison of the V279F and R92H genotypes showed differences between the AP group and control group in terms of APACHE II scores. Furthermore, the APACHE II scores of the V279F-AA+AC group and R92H-AG+AA groups were each higher than that of the V279F-CC group and R92H-GG group. There were significant differences in body temperature, respiration rate, heart rate, mean arterial pressure, and other indices between the groups (all p < 0.05; Table 9).
Represents p < 0.05.
Haplotype analysis of LP-PLA2 gene polymorphisms
Analysis of the haplotype distributions in the AP group and control group using SHEsis haplotype analysis software showed that LP-PLA2 can form five haplotypes with high frequencies in a population, including A-C-G, A-A-G, G-C-A, G-A-G, and G-C-G. In particular, frequencies of both G-C-A and G-A-G haplotypes in the AP group were much higher than those in the control group, whereas the frequency of the G-C-G haplotype in the AP group was much lower than that of the control group (all p < 0.05). As such, the haplotypes of G-C-A, G-A-G, and G-C-G were associated with AP (Table 10).
Represents p < 0.05.
Logistic regression analysis of AP risk factors
All of these variable factors, including the V279F and R92H polymorphisms that might cause AP, as well as serum LP-PLA2 level, serum lipase, serum amylase, and CRP, were found by multifactor logistic regression analysis to have statistically significant differences in comparisons of the AP group with the control group. Together, these results indicate that the A allele of V279F and R92H, serum LP-PLA2 level, and serum amylase were independent risk factors for AP (Table 11).
Represents independent risk factors for the occurrence of AP.
Discussion
AP is an inflammation-related disease that most often manifests as abdominal pain (Frossard et al., 2008). Although the exact mechanisms of AP remain unclear (Singh and Garg, 2016), the disease is thought to involve LP-PLA2, which is also known as platelet-activating factor acetylhydrolase, and is a member of the phospholipase A2 family (Rosenson and Stafforini, 2012; Theocharidou et al., 2014). LP-PLA2 is also associated with coronary heart disease, and seven alleles in particular are implicated in increased disease risk (Casas et al., 2010). However, there is little information concerning the role of LP-PLA2 and LP-PLA2 polymorphisms in the context of AP.
This study found that the LP-PLA2 A allele of V279F and R92H was an important factor in the pathogenesis of AP and associated with increased disease severity. Serum LP-PLA2 levels were also associated with AP, in that increased levels of serum LP-PLA2 were positively related to AP disease severity. Moreover, serum LP-PLA2 levels of patients with the A allele of V279F and R92H were significantly higher than those of other genotypes. Indeed, V279F in LP-PLA2 is known to influence enzyme activity (Paik et al., 2010). The mutation results in a loss of LP-PLA2 catalytic activity in heterozygous subjects, whereas homozygous subjects have no appreciable enzyme activity (Jang et al., 2006).
LP-PLA2 hydrolyzes the sn-2 ester bond of oxidized phospholipids to generate lysophosphatidylcholine and bioactive oxidized free fatty acids, which are potent proinflammatory molecules (Zalewski and Macphee, 2005). Meanwhile, serum LP-PLA2 has been suggested to promote release of F2-isoprostanes, the end product of lipid peroxidation, into the bloodstream (Stafforini et al., 2006). We also found that the G-C-A, G-A-G, and G-C-G LP-PLA2 haplotypes were associated with the risk of AP.
The association between LP-PLA2 gene polymorphisms and AP incidence and severity is likely because this enzyme can regulate the activation of several proinflammatory cytokines, which in turn can stimulate other target cells and result in the release of more cytokines that participate in pathological and physiological processes (De Luca et al., 2011). In accordance with the results of our study, the LP-PLA2 gene has been reported to be associated with an increased risk of coronary artery disease (CAD) and atherosclerosis (Baur et al., 1989; Paik et al., 2010; Zheng et al., 2011). The role of LP-PLA2 in these diseases can be attributed to the ability of this enzyme to generate lyso-LPC and oxNEFAs, which are both important in determining plaque instability.
Moreover, LP-PLA2 expression is highly upregulated in macrophages undergoing apoptosis in the fibrous cap and necrotic core of both vulnerable and ruptured plaques, but not in stable lesions (Kolodgie et al., 2006). A study by Baur et al. (1989) that involved 150 patients suggested that PLA2 gene variations are closely associated with inflammation pathways in airway cells that can increase the risk of ARDS. Additionally, a previous meta-analysis of seven case-control studies involving 3614 CAD patients and 4334 controls suggests that the V279F polymorphism of the LP-PLA2 gene may be associated with development of CAD and that LP-PLA2 might play a vital role in CAD pathophysiology (Lp-PLA(2) Studies Collaboration et al., 2010).
Furthermore, the remarkable increase in lactate dehydrogenase (LDH) activity in acute experimental pancreatitis suggests the onset of pancreatic necrosis as both LDH and triglycerides (TG) are important indicators for determining the onset of pancreatic necrosis in the course of AP (Mirosław, 1998).
On the other hand, our comparisons of LP-PLA2 gene polymorphisms with APACHE II score index and AP severity demonstrated that these gene polymorphisms are connected with body temperature, respiratory rate, heart rate, mean arterial blood pressure, and specific scoring index of AP patients. Furthermore, logistic regression analysis found that the V279F-A allele, R92H-A allele, serum LP-PLA2 level, and serum amylase activity were independent risk factors of AP. Together, these results further confirmed that there might be a close association between LP-PLA2 gene polymorphism and the incidence and severity of AP.
In conclusion, we detected a correlation between LP-PLA2 gene polymorphisms and the incidence and severity of AP. Patients carrying the A alleles of V279F and R92H in their genetic background have a high risk and severity of AP. In addition, LP-PLA2 gene polymorphisms can affect a patient's serum LP-PLA2 concentration and thus these genetic factors can be used as important indicators in AP diagnosis. Results from this study could be helpful for developing clinically relevant and individualized treatments that include genetic polymorphism tests for AP patients whose condition may deteriorate. However, due to the small sample size of this study, our results require further validation in larger sample sizes across various regions to determine whether these trends are consistent.
Footnotes
Acknowledgment
The authors acknowledge the helpful comments on this article provided by the reviewers.
Author Disclosure Statement
No competing financial interests exist.