




Abstract
Purpose:
Numerous studies have estimated the association between matrix metalloproteinases (MMPs) polymorphisms and the risk of oral cancer; the results, however, are inconsistent and conflicting. Therefore, we conducted a meta-analysis to evaluate the association of MMP-1, 2, and 3 polymorphisms with oral cancer risk.
Methods:
A computerized literature search was conducted of electronic databases and search engines. Odds ratios (OR) and 95% confidence intervals (CI) were calculated for each gene, and the heterogeneity among studies was estimated using the Q-test and I2 values. Overall and subgroup analyses were undertaken. Statistical analyses were conducted using Review Manager v5.3 and Stata v12.0 software.
Results:
Eighteen studies were included in this meta-analysis. For MMP-1(−1607) 1G/2G, a significant association was observed using the recessive genetic model (OR = 1.47; 95% CI = 1.14-1.91; I2 = 64%, pheterogeneity = 0.003). In the subgroup studies, a significant association was observed in the Asian subgroup (OR = 1.68; 95% CI = 1.42-1.99; I2 = 17%, pheterogeneity = 0.30 for the recessive model; and OR = 1.59; 95% CI = 1.19-2.13; I2 = 80%, pheterogeneity < 0.00001 for the allelic contrast model) and in the European subgroup (OR = 0.65; 95% CI = 0.44-0.98; I2 = 21%, pheterogeneity = 0.26 for the allelic contrast model). No significant associations were observed with either MMP-2(−1306) C/T or MMP-3(−1171) 5A/6A.
Conclusions:
The MMP-1(−1607) 1G/2G polymorphism is associated with oral cancer risk, and the 2G allele played different roles in Asian and European populations.
Introduction
O
Matrix metalloproteinases (MMPs) are a large family of zinc-dependent endopeptidases that are involved in the degradation of various extracellular components (Gonzalez-Arriaga et al., 2012). The overexpression of MMPs often contributes to tumor progression, invasion, and metastasis through angiogenesis and activation of cell spreading. MMP-1, 2, and 3 are three important members of the MMP family, and the genetic polymorphisms of MMPs impacting the tumor progression and development (Shuman Moss et al., 2012). MMP-1 is the most abundant membrane-type matrix metalloproteinase that can degrade fibrillar collagen and gelatin, and influence the extracellular microenvironment, which is closely related to the invasion and metastasis of tumors (Pardo and Selman, 2005). When a guanosine nucleotide (G) was deleted or inserted at position −1607 bp in the MMP-1 promoter, there were three genotypes: 1G/1G, 1G/2G, and 2G/2G (Li and Tai, 2014). MMP-2, also called gelatinase A, influences collagen remodeling by digesting gelatin and type IV collagen. As a result, gelatinases are proved to possess tumorigenic activity because of their profound participation in numerous phases of tumor development (Alaseem et al., 2017). What is interesting is a C to T transition at position −1306 bp in the MMP-2 promoter region, which leads to a reduction of transcriptional activity (Price et al., 2001). MMP-3, otherwise known as stromelysin-1, has a wide substrate specificity for various extracellular matrix components and degrades and remodels the extracellular matrix. Normally, MMP-3 expression is low in tissues; however, it is increased during tumor formation (Sage et al., 2003). The polymorphisms arising from an adenine insertion or deletion at position −1171 bp in the MMP-3 promoter region, results in three genotypes: 5A/5A, 5A/6A, and 6A/6A (Ye et al., 1996).
Large-scale studies have evaluated the roles of MMPs in oral cancer, head and neck cancer, and digestive cancer, which showed that the elevation of MMPs level could increase invasion and metastasis of tumor cells (Chen et al., 2009; Chien et al., 2013; Zhang et al., 2013a). In addition, DNA polymorphisms were widely spread in the gene promoter region. Research has indicated that MMPs polymorphisms contributed to the susceptibility of different cancers, which identified the significance of gene polymorphisms research (Park et al., 2011).
Accumulating evidence with respect to polymorphisms of MMPs driving oral cancers has been published. However, due to the inadequate sample sizes, heterogeneity of research methods, and the ethnicity differences, results remain conflicting. Although some meta-analyses have been published on head and neck cancer (Zhang et al., 2013a; Zhang et al., 2013b; Chen et al., 2014), no comprehensive analysis with a sufficiently large sample size has been performed for oral cancer. Thus, we performed a large-scale analysis that included 16 qualified case-control publications with 18 comparisons in dominant, recessive, and allelic contrast models, to clarify the associations of MMP-1, 2, 3 polymorphisms with oral cancer risk.
Materials and Methods
Search strategy
Using a key word search in the PubMed, Web of science, MEDLINE, and Embase, Cochrane, CNKI (China national knowledge Internet), and China info electronic databases and search engines, we collected all case-control studies of the associations of MMP1, MMP2, and MMP3 polymorphisms with oral cancer risk that were conducted between January 2000 and January 2018. The subject title and abstract included the following words: “MMP,” “matrix metalloproteinase,” “collagenase” or “gelatinase,” “head and neck cancer,” “oral cancer,” “oral squamous cell carcinomas” or “OSCC,” “polymorphism,” “variant,” “genotype,” or “SNP.” After performing the systematic computerized searches, we manually reviewed the references of the search results for additional studies. Reviews, unpublished reports, and articles not written in English or Chinese were not included.
Data extraction
The following data were extracted from the articles included in the meta-analysis: first author, publication year, ethnicity of the study population, the number of cases and controls, genotype distribution, and allelic frequency. Articles that reported different gene polymorphisms within the same articles were considered different study samples. To minimize bias and improve reliability, two investigators extracted data independently.
Inclusion and exclusion criteria
The inclusion criteria were as follows: (1) a case-control study evaluating the association of MMPs polymorphisms and oral cancer; (2) cases of studies were confirmed by histopathological diagnosis; (3) if sufficient data were available to calculate an odds ratio (OR) with a 95% confidence interval (CI) and p-value; (4) only genes with three or more studies on one gene polymorphism were included; and (5) studies published only in English or Chinese.
The exclusion criteria were as follows: (1) studies that investigated the expressions of genes, the response to treatment or survival of oral cancer patients; (2) if sufficient genetic information were not available, such as allelic frequency or genotype; and (3) if the same population was evaluated in different studies, only the most recent or the one with the largest population was included in this meta-analysis.
Statistical analysis
To evaluate the association between MMPs polymorphisms and the risk of oral cancer, pooled OR and a CI were calculated for each gene in the overall comparison and stratified analysis. The significance of pooled ORs was estimated by Z-test with a significance of p < 0.05. Heterogeneity between studies was assessed using the p-value of the Q-test and quantified using an I2 value. A random-effects model was used when the p-value for heterogeneity was less than 0.05, which indicated obvious heterogeneity of the data; otherwise, a fixed-effects model was used. I2 is also a value that could describe the extent of heterogeneity between studies. As a guide, a value less than 50% indicates no observed heterogeneity, while a value greater than 50% is regarded as having heterogeneity. Furthermore, sensitive analyses were performed to reflect the influence of the individual dataset on the pooled ORs by sequentially removing each eligible study. Finally, we assessed the publication bias using Begg's funnel plots and Egger's tests. In addition, the Hardy-Weinberg equilibrium (HWE) was calculated via a chi-square test at a significance level of p > 0.05. To avoid assuming only one “wrong” genetic model, we used a dominant genetic model (BB + AB vs. AA), a recessive genetic model (BB vs. AB + AA), and an allelic contrast model (B-allele vs. A-allele), respectively (A represented major allele and B represented minor allele). All p-values were two-sided, and all statistical analyses were performed using Review Manager v5.3 and Stata v10.0 software.
Results
Study characteristics
We identified 94 relevant articles using the aforementioned search strategy. Seventy-Eight of the articles were excluded. Fifty-seven did not assess the association between MMP-1, MMP-2, and MMP-3 polymorphisms and oral cancer risk; 17 were review articles; 3 had evaluated the same population; and 1 had insufficient data. In addition, three articles covered two gene polymorphisms (Zinzindohoue et al., 2004; Li et al., 2015); each type of gene comparison was regarded as a separate study. Consequently, 18 studies of the association of MMP-1, MMP-2, and MMP-3 polymorphisms and oral cancer risk were ultimately included in this meta-analysis (Fig. 1). Table 1 illustrates the characteristics of all the included studies, such as their publication year, the ethnicity of the study populations, tumor site, genotyping data, and sample sizes (cases vs. controls). The results from the chi-square tests showed that genotypic distribution of the controls was in agreement with the HWE at a statistical significance level of 0.05. The study by O-Charoenrat et al. (2006) on MMP-1, which did not provide data for all genotypes, but presented genotypes as AA+AB and BB, was also brought into this analysis. There were 10 studies, including 1725 patients and 2322 controls for MMP-1(−1607) 1G/2G; 3 studies with 732 cases and 897 controls for MMP-2(−1306) C/T; and 5 studies with 542 cases and 721 controls for MMP-3(−1171) 5A/6A.
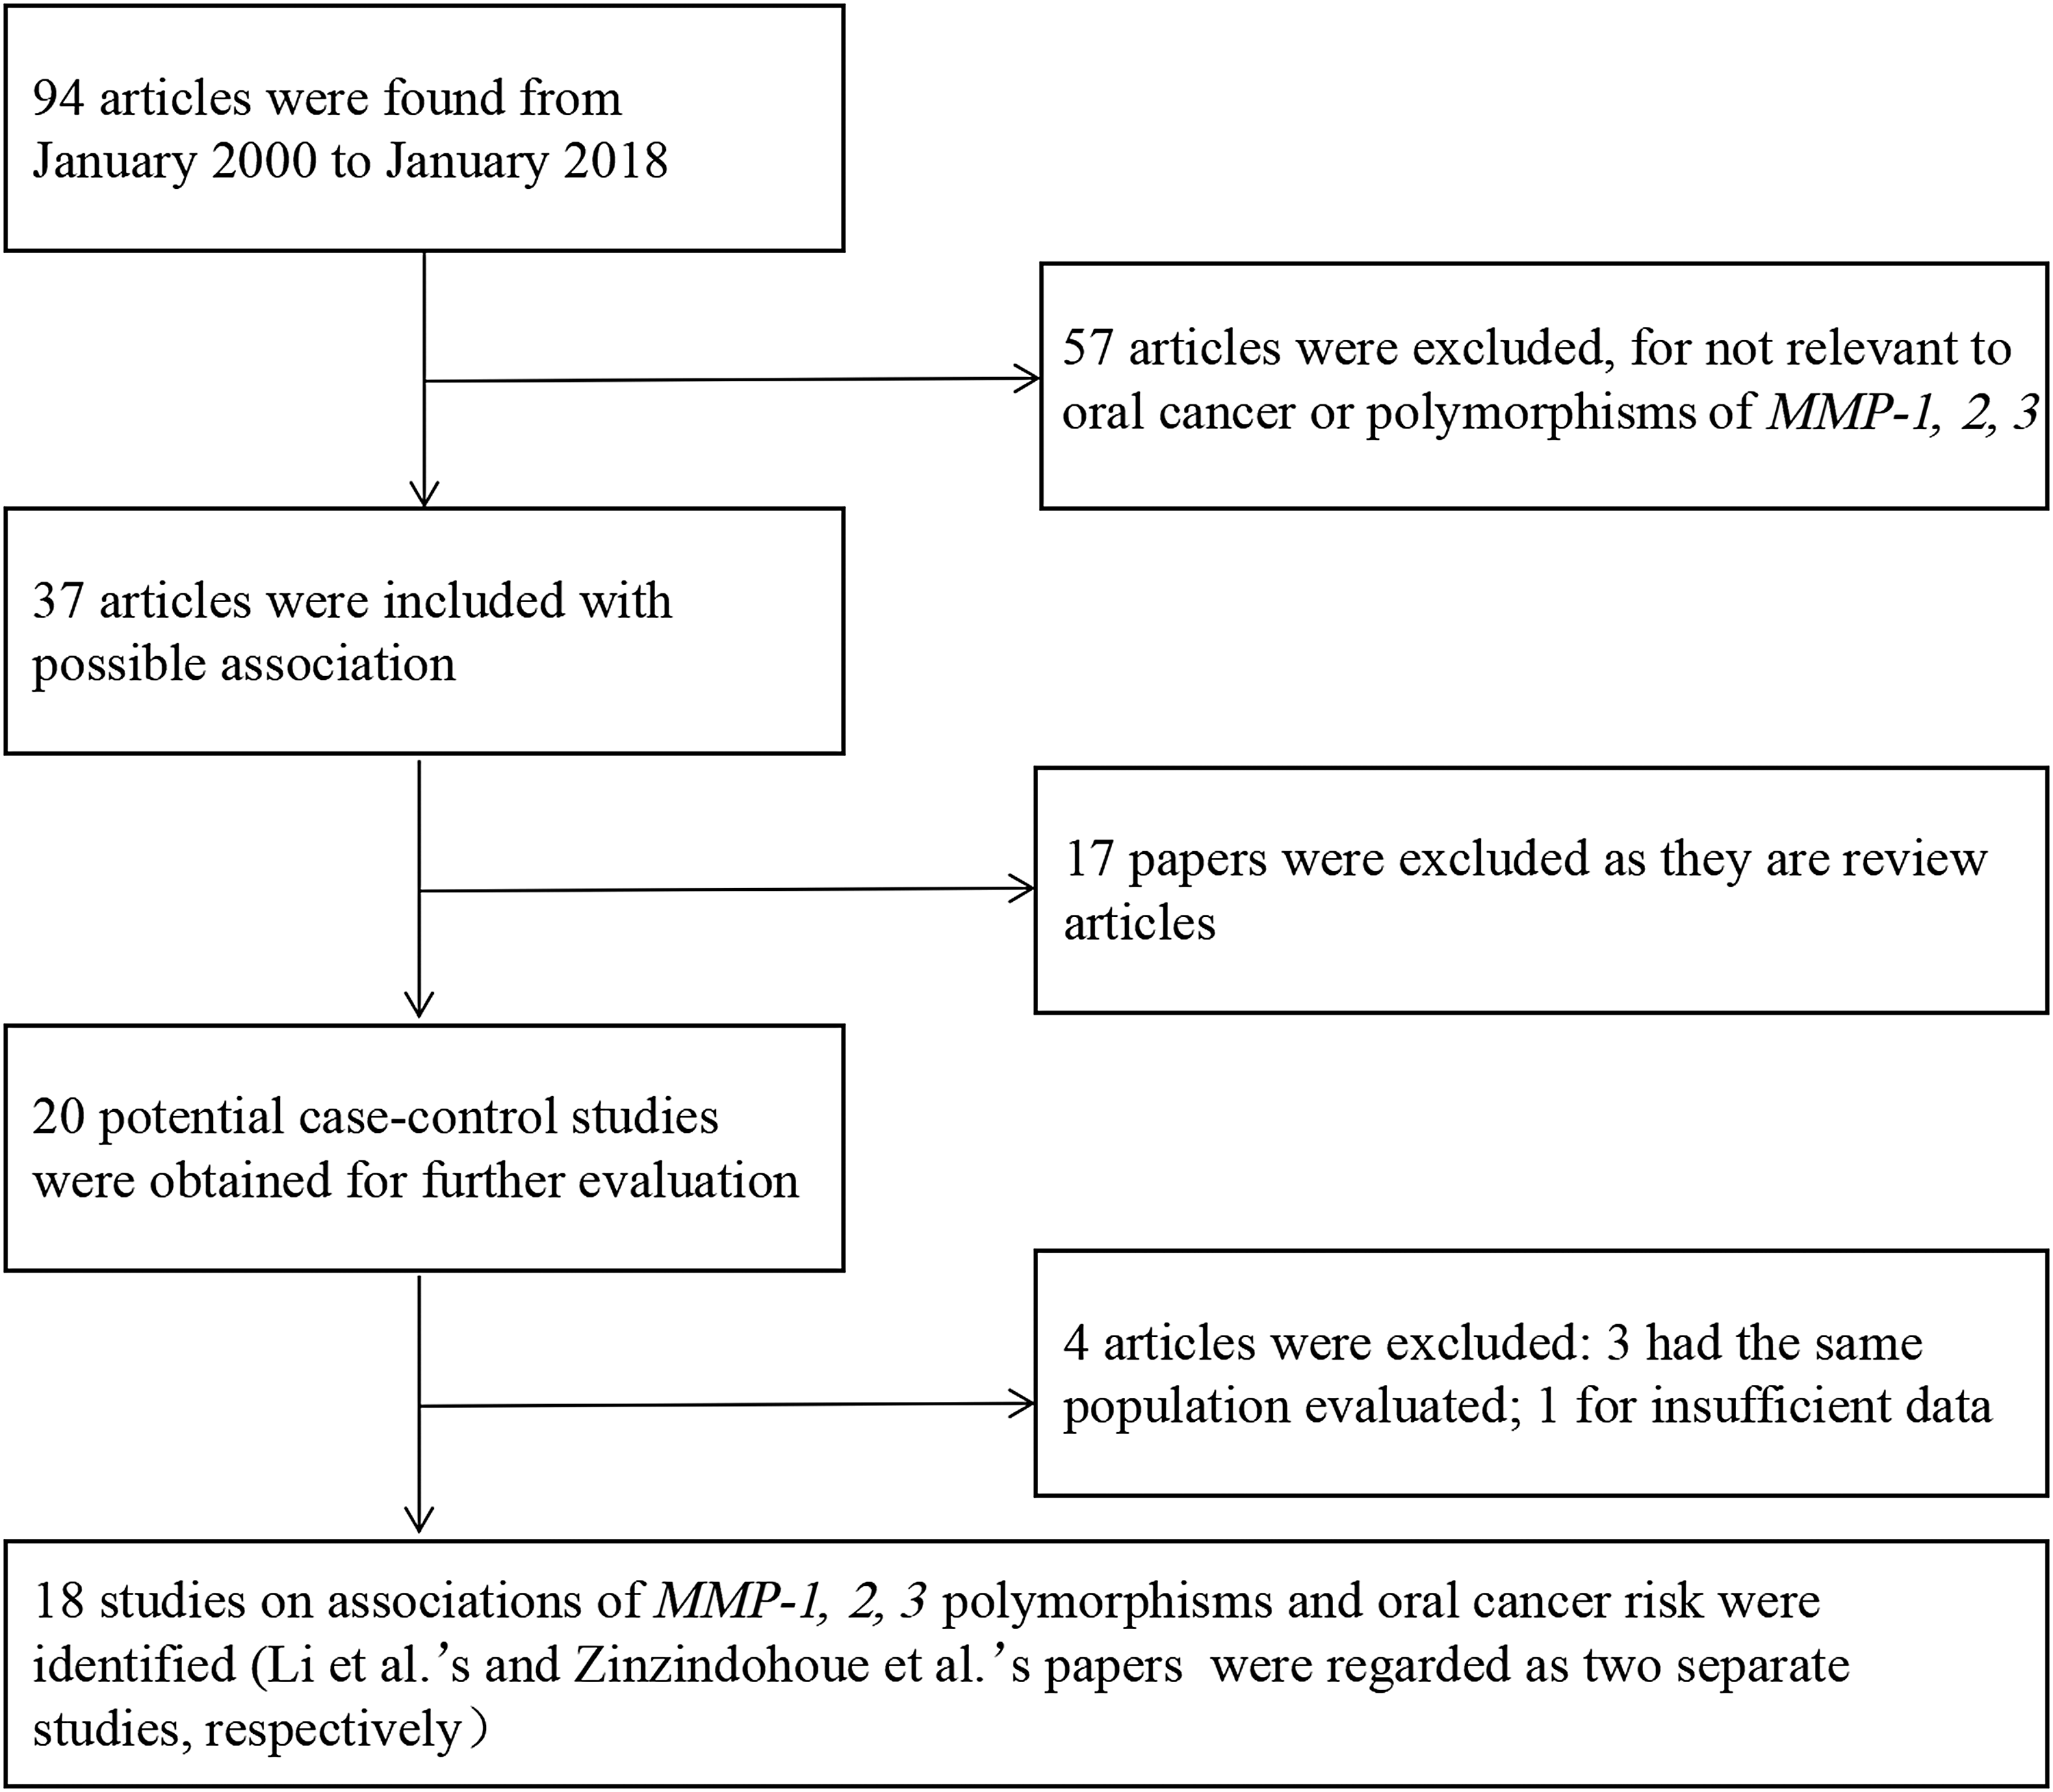
Flow diagram of study identification.
A represented major allele and B represented minor allele.
Represented AA+AB.
HWE, Hardy-Weinberg equilibrium; MMP, matrix metalloproteinase.
Quantitative data synthesis
MMP-1(−1607) 1G/2G
Ten studies evaluated the association of the MMP-1 polymorphism with oral cancer risk (Lin et al., 2004; Zinzindohoue et al., 2004; Cao and Li, 2006; O-Charoenrat et al., 2006; Nishizawa et al., 2007; Vairaktaris et al., 2007a; Shimizu et al., 2008; Liu et al., 2014; Li et al., 2015; Sun et al., 2016) (Table 2). In the overall comparison, a significant association between the MMP-1(−1607) 1G/2G polymorphism and oral cancer risk was observed using the recessive model (OR = 1.47; 95% CI = 1.14-1.91; I2 = 64%, pheterogeneity = 0.003) (Fig. 2), but not in the two other models (OR = 1.58; 95% CI = 0.61-4.11; I2 = 93%, pheterogeneity < 0.00001 for the dominant model; and OR = 1.30; 95% CI = 0.91-1.86; I2 = 89%, pheterogeneity = 0.15 for the allelic contrast model).

Forest plot for association between MMP-1, 2, 3 polymorphisms and risk of oral cancer under the recessive model (BB vs. AA+AB) in overall analysis. MMP, matrix metalloproteinase.
p-Value for Z-test.
p-Value for Q-test.
Statistically significant, with p < 0.05 for Z-test.
N/A indicates that the result is meaningless.
CI, confidence interval; OR, odds ratios; HB, hospital-based; PB, population-based.
Similarly, in the subgroup studies based on the source of control subjects and ethnicity, the MMP-1(−1607) 1G/2G polymorphism was significantly associated with oral cancer in the hospital-based subgroup (OR = 1.49; 95% CI = 1.11-2.00; I2 = 67%, pheterogeneity = 0.002 for the recessive model); in the population-based subgroup (OR = 2.39; 95% CI = 1.21-4.72; I2 = N/A, pheterogeneity = N/A for the dominant model; and OR = 1.41; 95% CI = 1.03-1.94; I2 = N/A, pheterogeneity = N/A for the allelic contrast model); in the Asian subgroup (OR = 1.68; 95% CI = 1.42-1.99; I2 = 17%, pheterogeneity = 0.30 for the recessive model; and OR = 1.59; 95% CI = 1.19-2.13; I2 = 80%, pheterogeneity < 0.00001 for the allelic contrast model); and in the European subgroup (OR = 0.65; 95% CI = 0.44-0.98; I2 = 21%, pheterogeneity = 0.26 for the allelic contrast model) (Fig. 3).
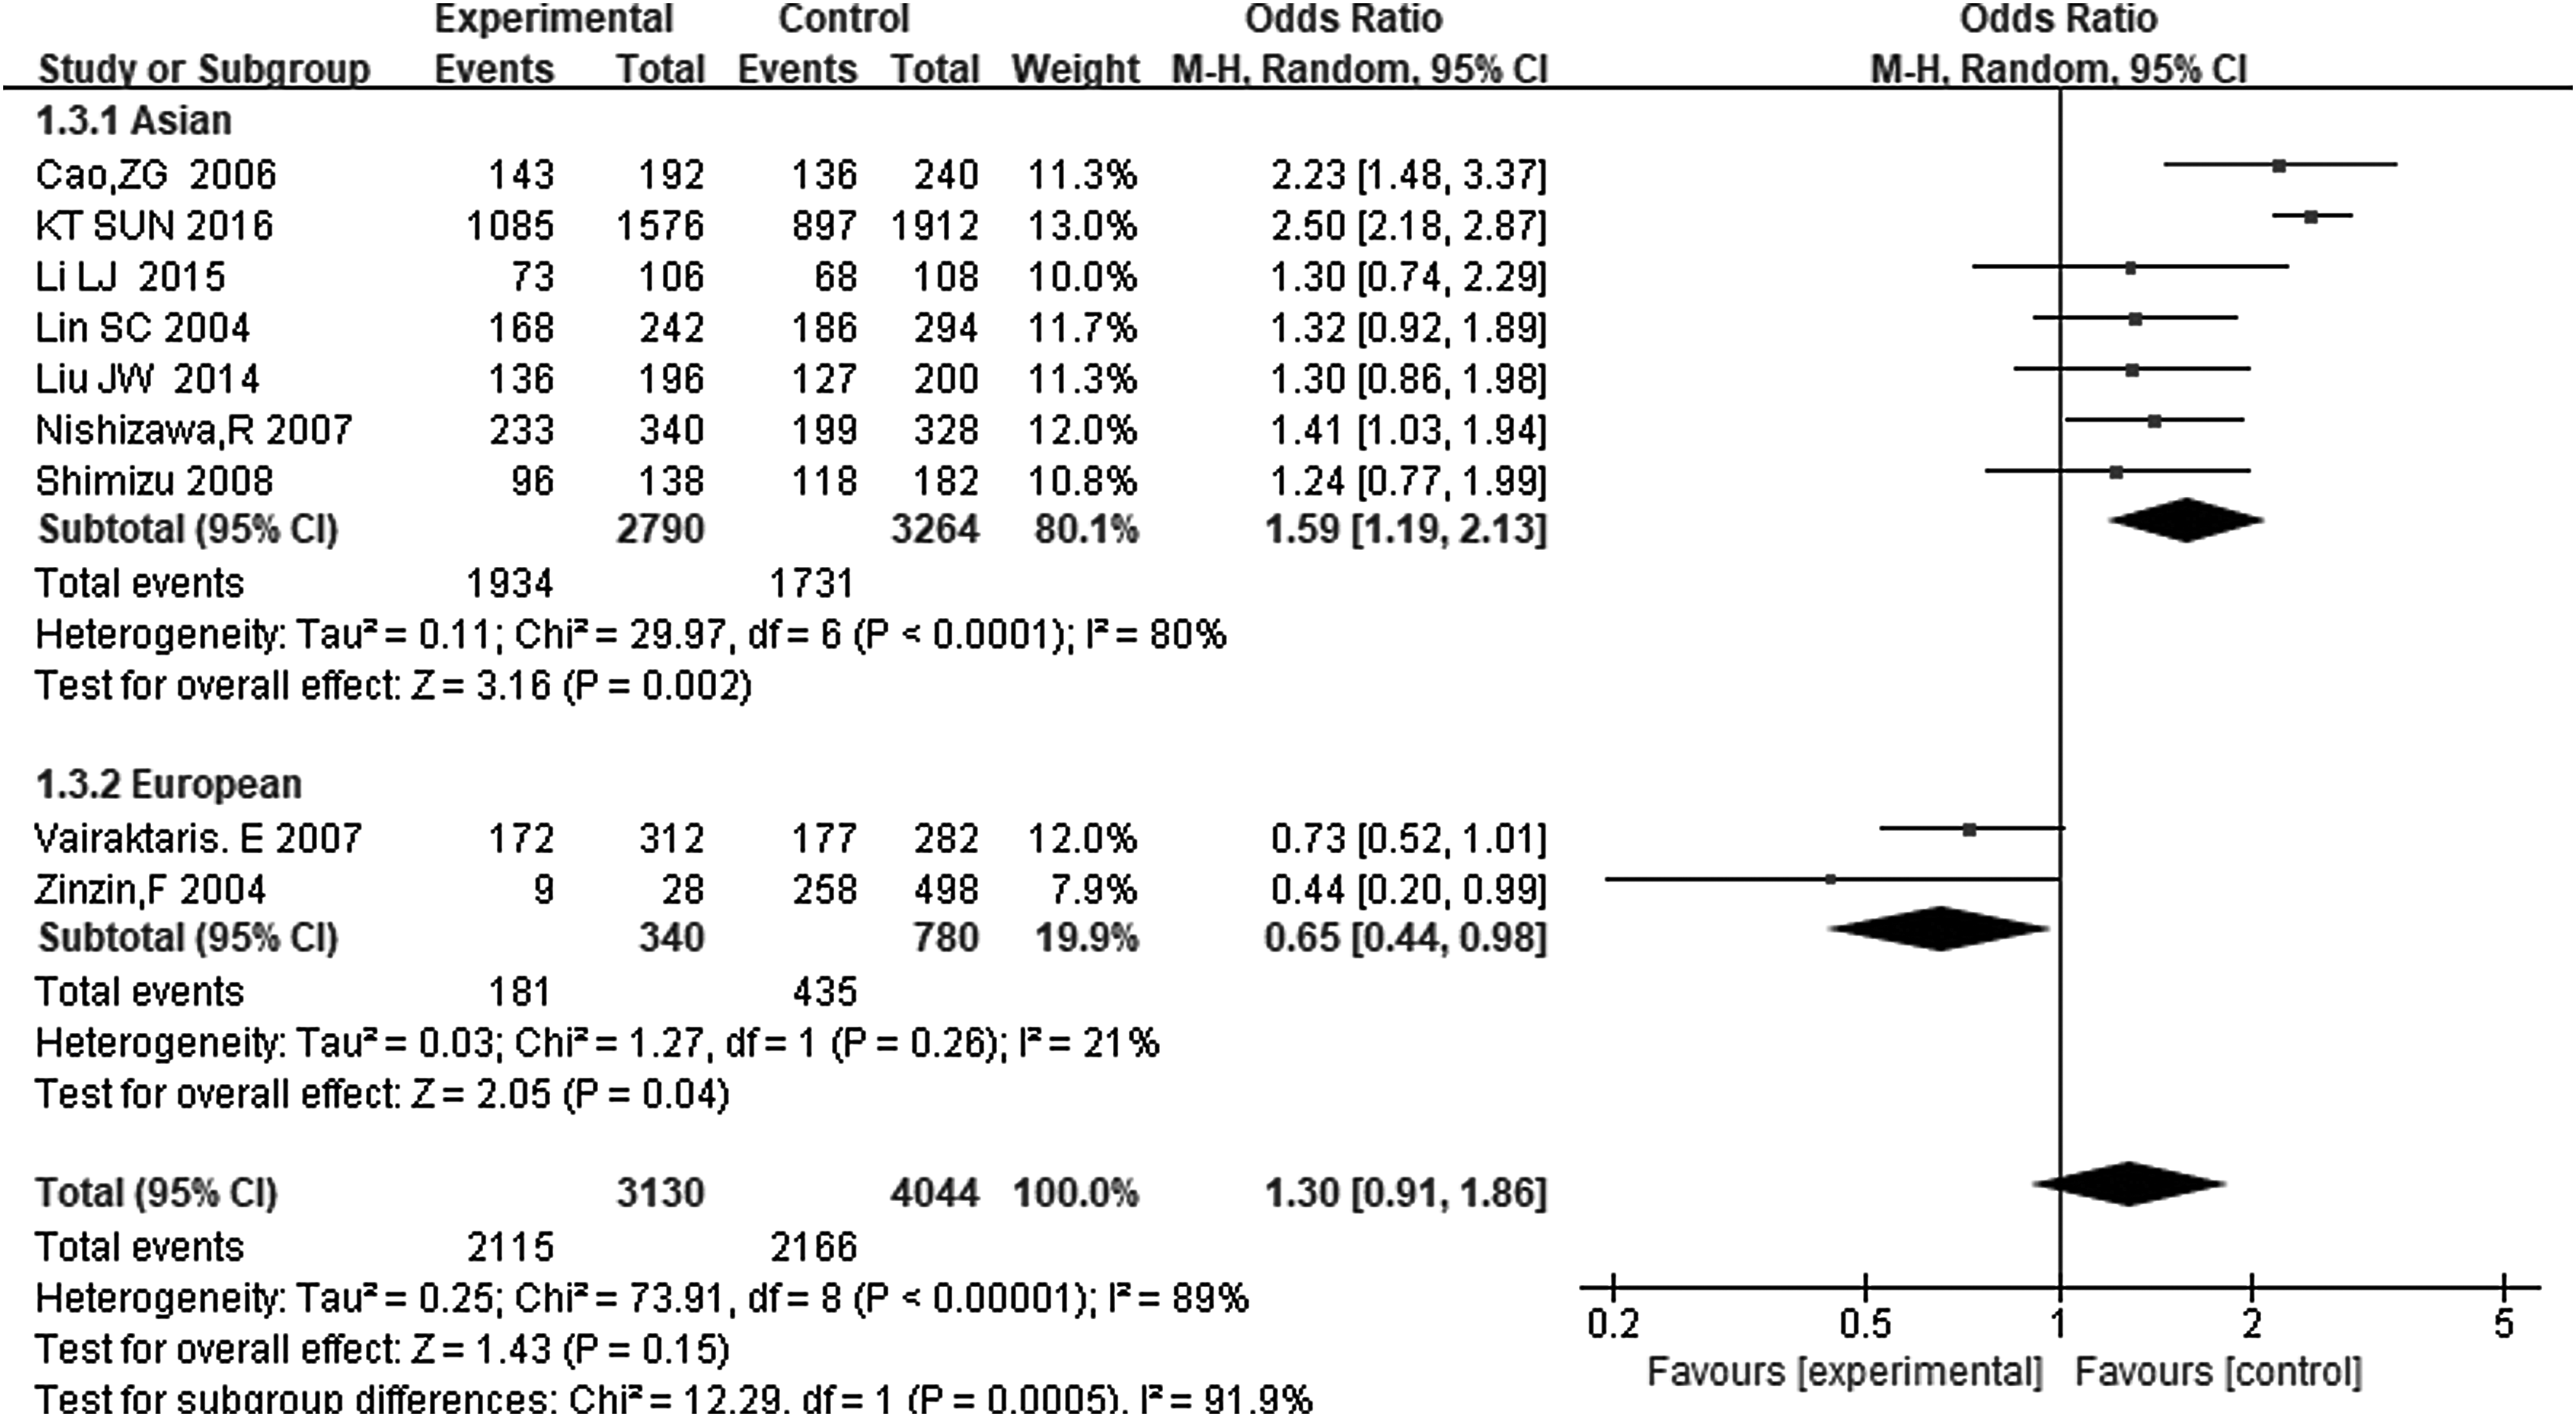
Forest plot for association between MMP-1(−1607) 1G/2G and risk of oral cancer under the allelic contrast model (B vs. A) in the stratified analysis based on the ethnicity.
In the subgroup analyses based on tumor site or lifestyle, the gene polymorphism was significantly associated with oral cancer risk in nonbuccal cancer (OR = 1.73; 95% CI = 1.35-2.22; I2 = 0, pheterogeneity = 0.73 for the recessive model; and OR = 1.55; 95% CI = 1.28-1.87; I2 = 0, pheterogeneity = 0.42), while no association was found in the buccal cancer subset or the cigar and alcohol consumption subgroups (Fig. 4).
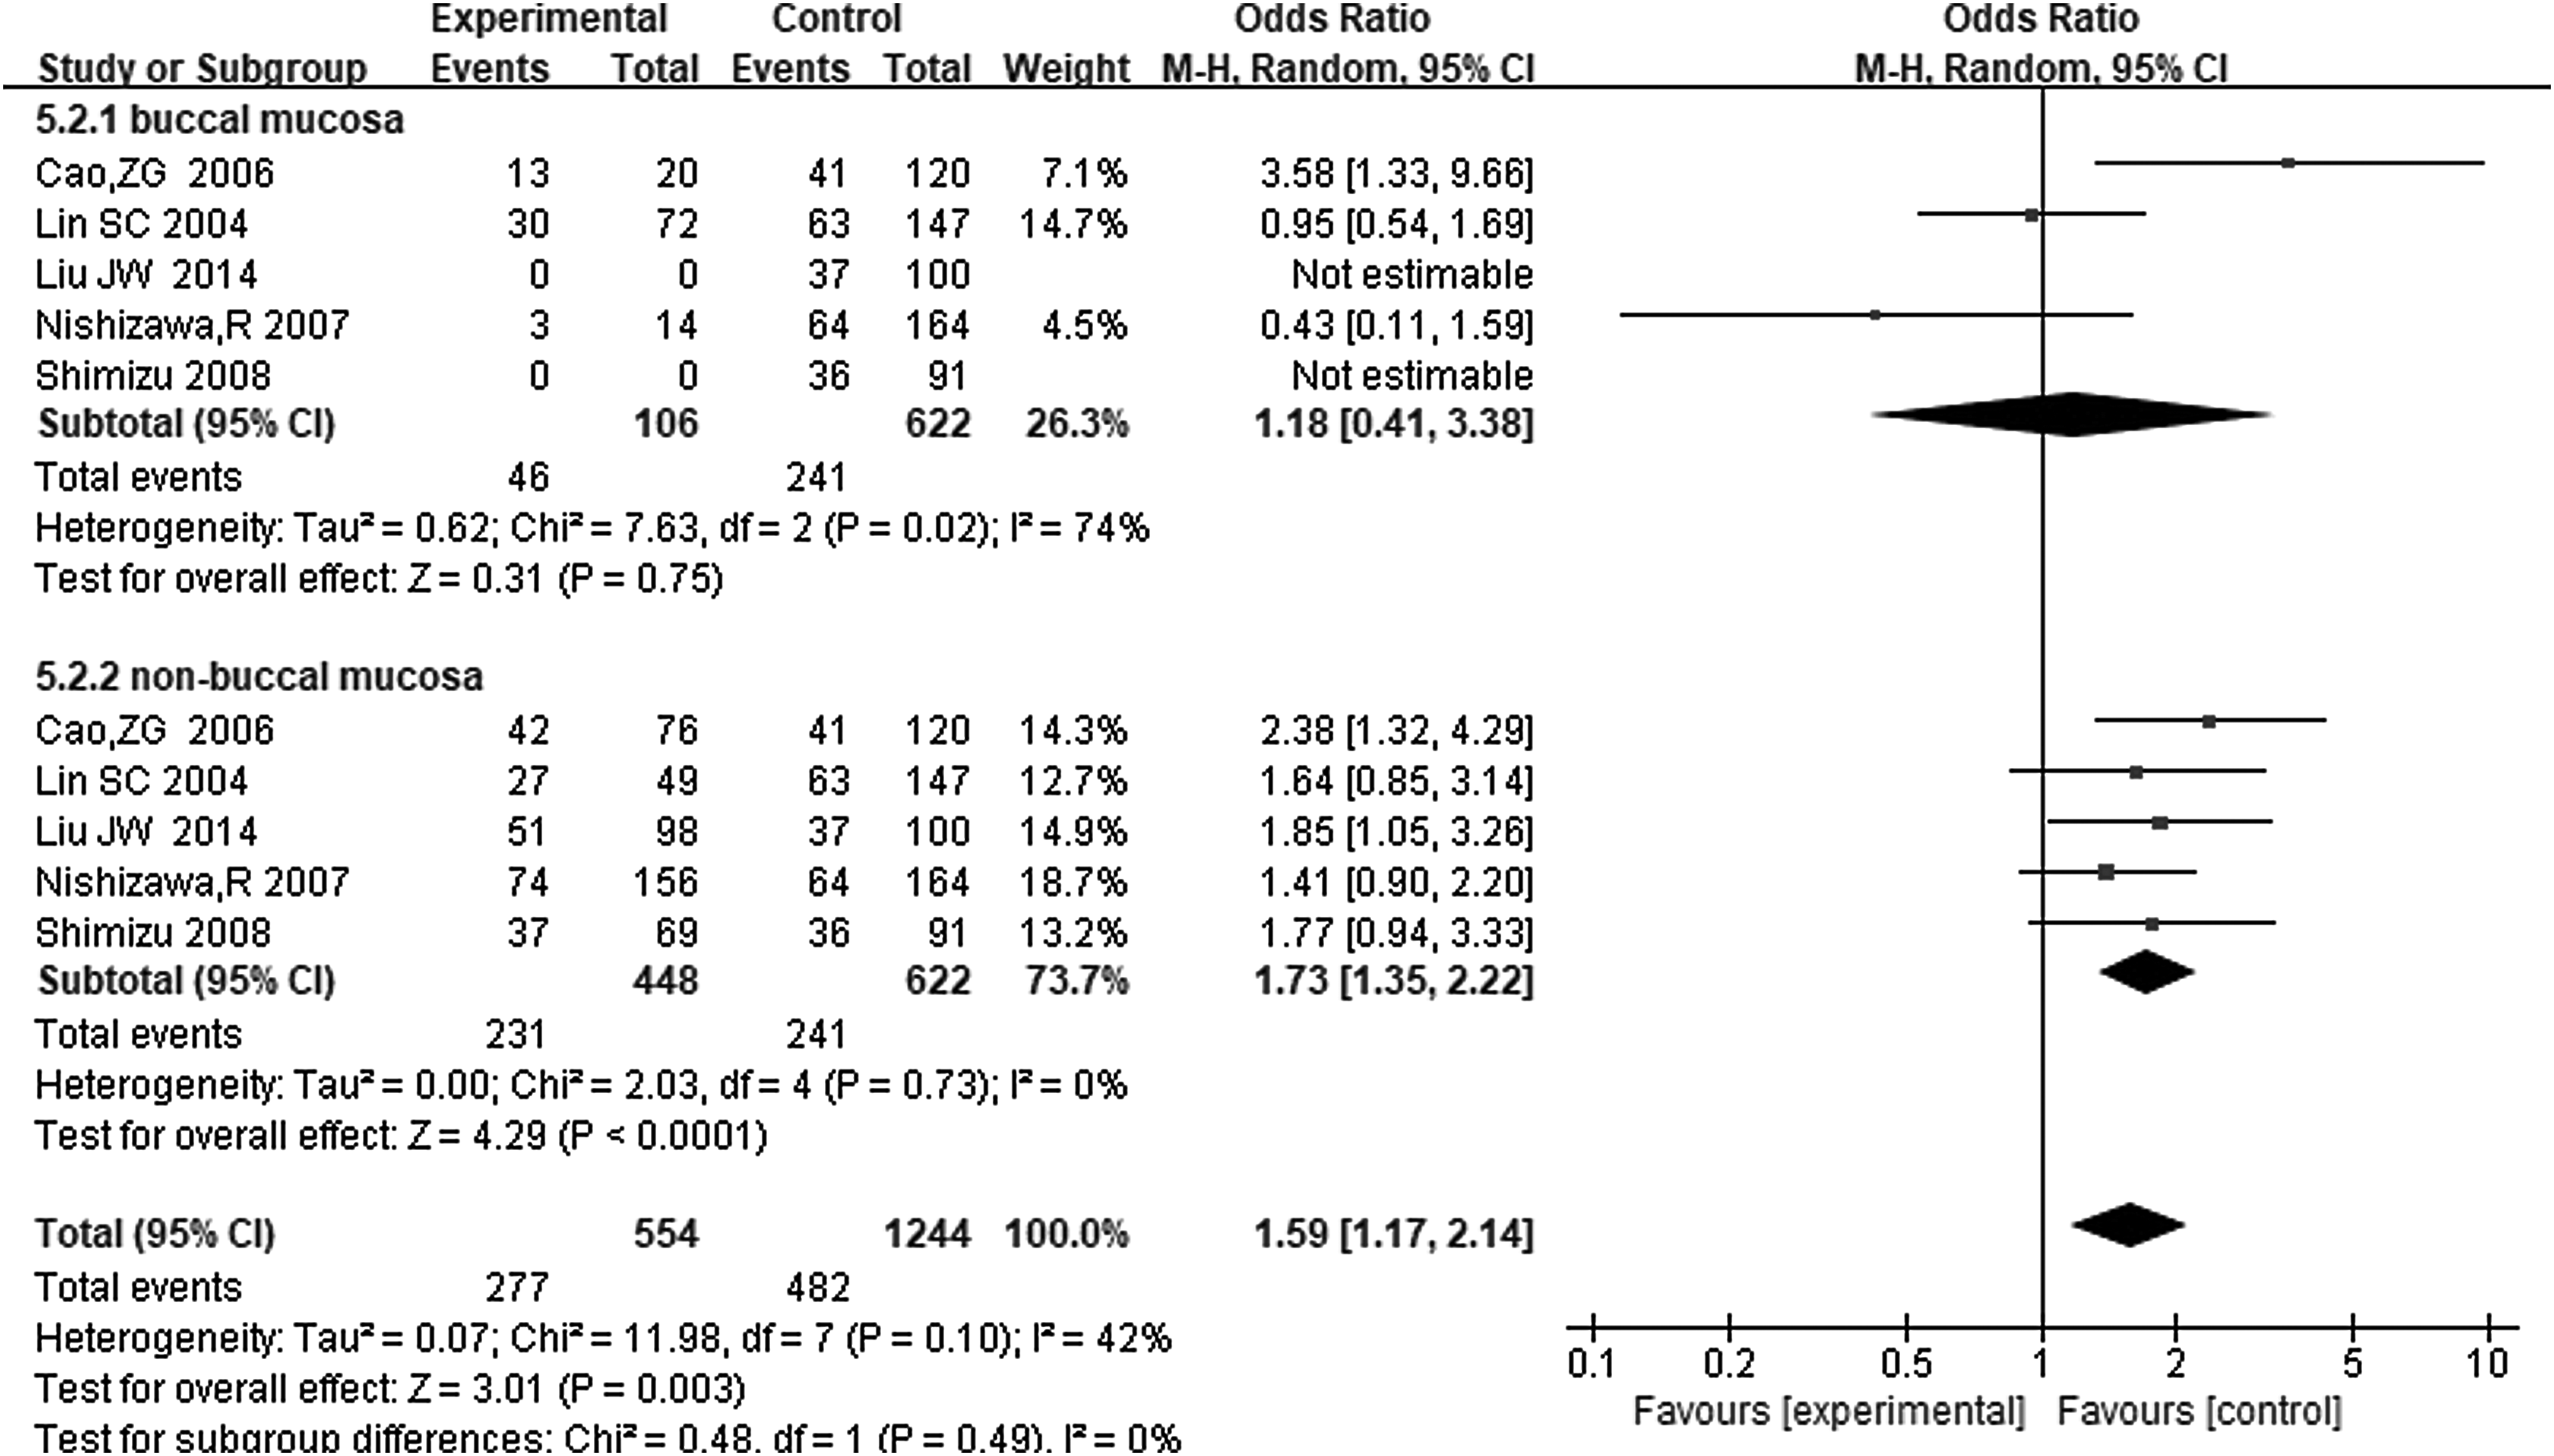
Forest plot for association between MMP-1(−1607) 1G/2G and risk of oral cancer under the recessive model (BB vs. AA+AB) in the stratified analysis based on the tumor site.
MMP-2(−1306) C/T
Three studies investigated the association between MMP-2(−1306) C/T polymorphism and oral cancer risk (Lin et al., 2004; P and Khantapura, 2006; Yete, Pradhan, and Saranath, 2017). In the overall comparison, the MMP-2 polymorphism was not significantly associated with oral cancer using any of the three genetic models (OR = 0.72; 95% CI = 0.29-1.75; I2 = 90%, pheterogeneity < 0.00001 for the dominant model; OR = 0.47; 95% CI = 0.08-2.93; I2 = 54%, pheterogeneity = 0.11 for the recessive model; and OR = 0.68; 95% CI = 0.29-1.60; I2 = 91%, pheterogeneity < 0.00001 for the allelic contrast model).
MMP-3(−1171) 5A/6A
Five studies were included in this analysis (Zinzindohoue et al., 2004; Tu et al., 2006; Nishizawa et al., 2007; Vairaktaris et al., 2007b). In the overall comparison, this polymorphism was not significantly associated with oral cancer using any of the three genetic models (OR = 1.14; 95% CI = 0.87-1.51; I2 = 33%, pheterogeneity = 0.20 for the dominant model; OR = 1.09; 95% CI = 0.70-1.68; I2 = 36%, pheterogeneity = 0.18 for the recessive model; and OR = 1.10; 95% CI = 0.89-1.36; I2 = 40%, pheterogeneity = 0.15 for the recessive model). Similarly, in the stratified comparisons based on the source of control subjects and ethnicity, no significant involvement was found between the 5A/6A polymorphism and oral cancer risk in three genetic models.
Heterogeneity analysis
Significant heterogeneity among studies was observed in specific comparisons (Table 2). For the MMP-1(−1607) 1G/2G polymorphism, significant heterogeneity was found in overall comparisons (I2 = 93%, pheterogeneity < 0.00001 for the dominant model; I2 = 64%, pheterogeneity = 0.003 for the recessive model; and I2 = 89%, pheterogeneity < 0.00001 for the allelic contrast model). However, heterogeneity was eliminated in the European subset after stratification by ethnicity in the dominant model (I2 = 0, pheterogeneity = 0.39) and significantly decreased in the Asian subset (I2 = 17%, pheterogeneity = 0.30 in the recessive model) and the European subset (I2 = 15%, pheterogeneity = 0.28 in the recessive model; and I2 = 21%, pheterogeneity = 0.26 in the allelic contrast model). Similarly, in subgroup analyses based on the original location of the tumor and lifestyles, heterogeneity was eliminated in the buccal cancer subset (I2 = 0, pheterogeneity = 0.85 in the dominant model), nonbuccal cancer subset (I2 = 0, pheterogeneity = 0.73 in the recessive model and I2 = 0, pheterogeneity = 0.42 in the allelic contrast model), and alcohol-drinking subset (I2 = 0, pheterogeneity = 0.76 in the recessive model). Also, heterogeneity significantly decreased in the nonsmoking population subset (I2 = 41%, pheterogeneity = 0.18 in the dominant model and I2 = 35%, pheterogeneity = 0.20 in the recessive model) and the alcohol-drinking subset (I2 = 35%, pheterogeneity = 0.22 in the allelic contrast model). Since the heterogeneity was eliminated or decreased significantly in some subgroups in the stratified analyses, these results are more credible.
For the MMP-2(−1306) C/T polymorphism, significant heterogeneity was observed in overall comparisons (I2 = 90%, pheterogeneity < 0.00001 in the dominant model; I2 = 54%, pheterogeneity = 0.11 in the recessive model; and I2 = 91%, pheterogeneity < 0.00001 in the allelic contrast model). For the MMP-3(−1171) 5A/6A polymorphism, no significant heterogeneity was found in the overall comparison (I2 = 33%, pheterogeneity = 0.20 in the dominant model; I2 = 36%, pheterogeneity = 0.18 in the recessive model; and I2 = 40%, pheterogeneity = 0.15 in the allelic contrast model). However, heterogeneity was eliminated in the hospital-based subset (I2 = 0, pheterogeneity = 0.87 in the dominant model and I2 = 0, pheterogeneity = 0.86 in the allelic contrast model) and the population-based subset (I2 = 0, pheterogeneity = 0.79 in the recessive model) after stratifying by the source of the control subjects and ethnicity (I2 = 0, pheterogeneity = 0.81 in the dominant model; I2 = 0, pheterogeneity = 0.89 in the recessive model; and I2 = 0, pheterogeneity = 0.99 in the allelic contrast model). Also, in the subgroup analysis based on ethnicity, heterogeneity significantly decreased in the Asian population (I2 = 49%, pheterogeneity = 0.14 in the dominant model).
Sensitivity analyses
Sensitivity analyses were conducted to measure the influence of each individual dataset on the pooled ORs by sequentially removing each qualified study. For the MMP-1(−1607) 1G/2G polymorphism, the pooled ORs materially altered when the study from Vairaktaris et al. was omitted in the allelic contrast model in the overall comparison. For the MMP-2(−1306) C/T polymorphism, the pooled ORs were significantly altered when the study by Lin et al. (2004) in the dominant model and by Yete et al. (2017) in the allelic contrast model were excluded in the overall comparison, which was mainly due to the limited included studies. For the MMP-3(−1171) 5A/6A, when the study by Nishizawa et al. (2017) was excluded in the overall comparison, the pooled ORs were significantly changed in the dominant model and the allelic contrast model.
Publication bias
Begg's funnel plot and Egger's test were used to test the publication bias of the included studies examining the MMP-1(−1607) 1G/2G polymorphism. The shape of the Begg's funnel plots revealed no obvious asymmetry in any of the three genetic models (Fig. 5). No statistical significance was found in any of the three genetic models (dominant: p = 0.175, recessive: p = 0.210, and allelic contrast: p = 0.348) using the Begg's test and in the recessive model (p = 0.227) Egger's test, indicated no publication bias in this meta-analysis.
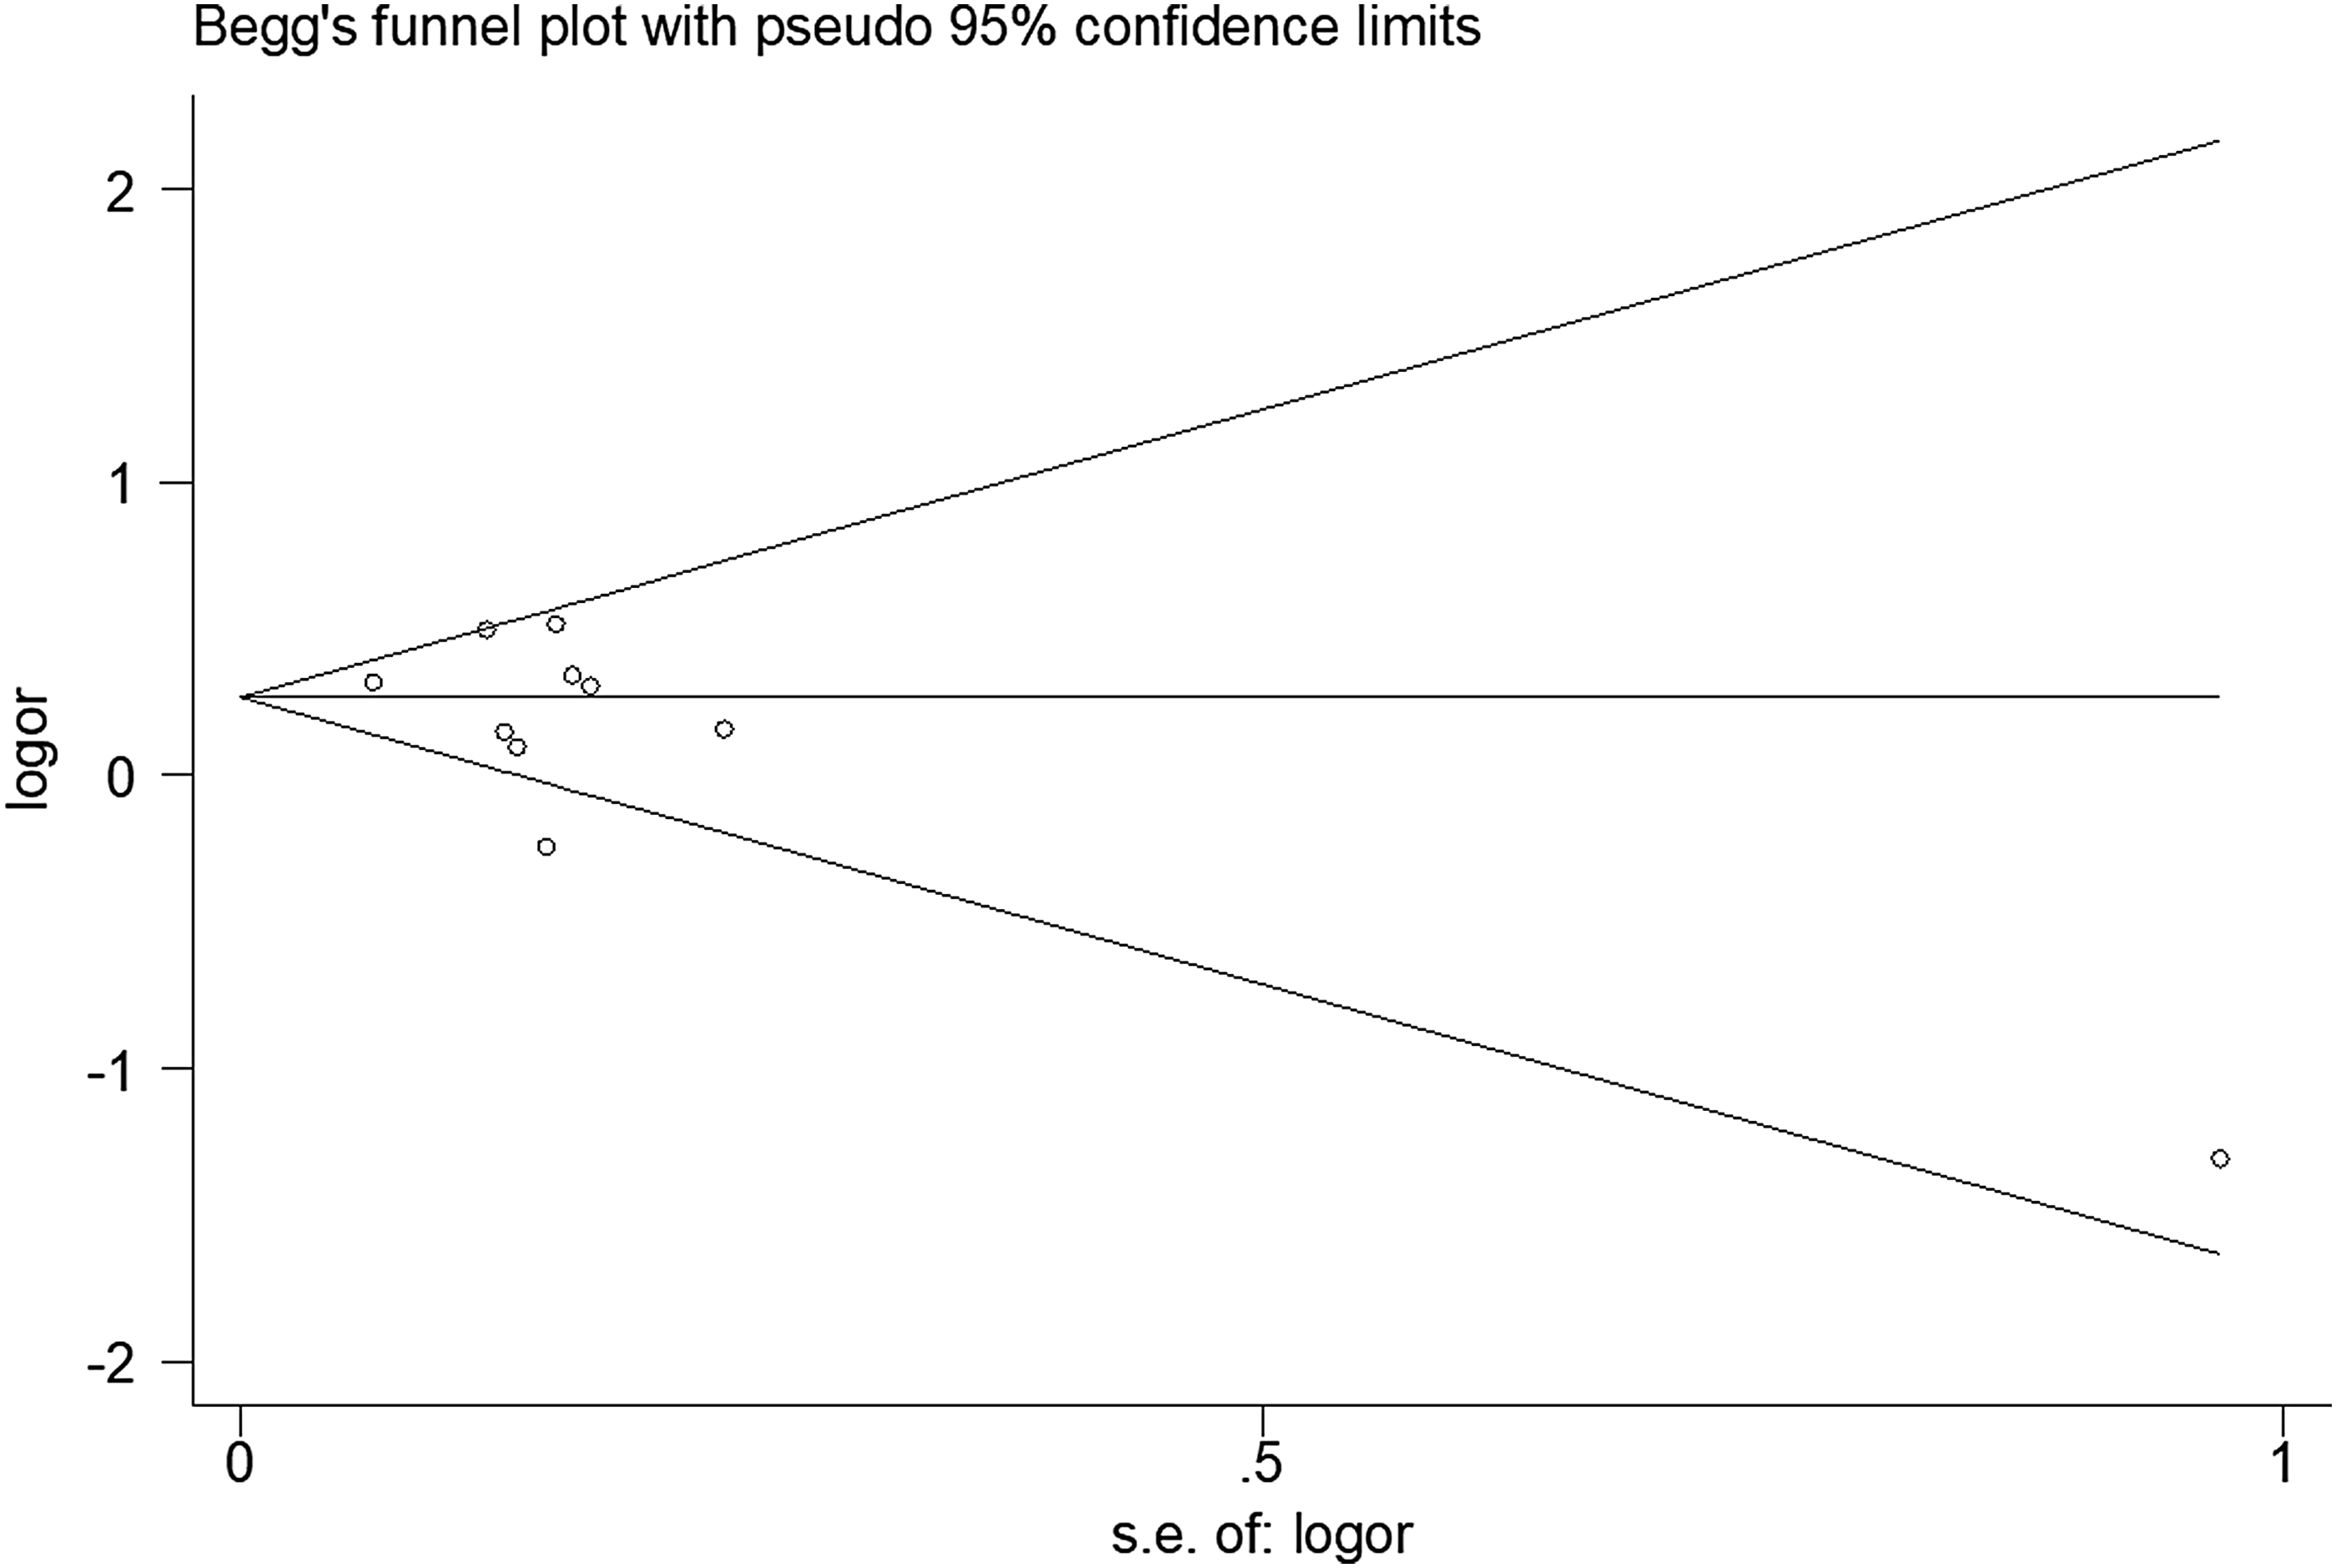
Begg's funnel plot for publication bias test for MMP1 polymorphism in the recessive model.
Discussion
In our meta-analysis of the associations between the MMP polymorphisms and the risk of oral cancer, a significant association was observed with the MMP-1(−1607) 1G/2G polymorphism both in the overall and stratified comparisons. In contrast, no associations were found between the MMP-2(−1306) C/T or the MMP-3(−1171) 5A/6A polymorphisms and oral cancer risk.
The MMP-1(−1607) 1G/2G polymorphism is characterized by a guanine insertion/deletion at position −1607. This polymorphism contributes to susceptibility of multiple cancers by affecting the balance of extracellular matrix proteins (Tower et al., 2002; Bartling et al., 2014). The MMP-1(−1607) 1G/2G polymorphism results in higher protein expression, which likely promotes tumor metastasis. In this meta-analysis a comparison of the overall results showed that the 2G/2G homozygous genotype had an increased frequency in oral cancer patients. This supports the conclusion of Cao et al. and O-Charoenrat et al. Sun et al. found that the heterozygous 1G/2G genotype decreased the susceptibility of oral cancer. In contrast, Liu et al. (2012) found that the MMP-1(−1607) 1G/2G polymorphism could contribute to elevated risk of breast and colorectal cancer, but not oral cancer. The heterogeneity of the results is mainly due to the different studied populations and diverse inclusion criteria. As for the stratified comparisons, significant results were discovered based on the source of controls, ethnicity and the tumor site. Interestingly, our subgroup analysis based on ethnicity demonstrated that the MMP-1(−1607) 1G/2G polymorphism played contrary roles in Asian and European populations. In the European population, the 2G allele frequency significantly reduced the risk of cancer in patients compared with the controls; whereas in the Asian population, the 2G allele and the homozygous 2G/2G genotype were significantly associated with increased risk. The heterogeneity of the results above is likely due to difference in the genetic background of the two studied populations. In the subgroup analysis based on tumor site, we demonstrated that the 2G allele and the 2G/2G genotype were significantly increased in nonbuccal cancers.
Previous reports indicated that MMP2 overexpression is related to the development and aggressiveness of cancers. The MMP-2(−1306) C/T polymorphism, a C to T transition within the promotor site, could downregulate transcriptional activity. Therefore, the individuals with the T allele had lower MMP2 expression. Yete et al. and O-Charoenrat et al. (2006) held the same opinion that the T allele indicated a lower risk of oral cancer. Lin et al. (2014) found that CC genotype frequency was higher in oral cancer patients than the controls. The conclusions of these three studies were inferred using different genetic models. Due to the limited number of included studies and significant heterogeneity in all three comparisons, our meta-analysis could not gain significant association between the MMP-2(−1306) C/T polymorphism and oral cancer risk.
Neither of the MMP-3(−1171) 5A/6A alleles was found to have a significant association with oral cancer risk. Previous studies have shown that the 5A allele has nearly twofold higher promotor activity than the 6A allele, which suggests that it could contribute to increased metastasis. Several studies have evaluated the relationship between the MMP-3 gene polymorphisms and oral cancer, and the results are inconsistent (Zinzindohoue et al., 2004; Nishizawa et al., 2007). The diverse results may be attribute to different genetic backgrounds. To eliminate the heterogeneity, we performed stratified analysis by ethnicity. Nevertheless, we failed to find a significant association between the 5A/6A alleles and oral cancer risk.
Our meta-analysis has some limitations. First, the studies included were limited and the sample sizes were relatively small; thus, our conclusions with regard to specific alleles and their risk would benefit from additional primary studies. Second, significant heterogeneity was detected in our study, and thus, the results must be interpreted with caution. However, this heterogeneity was eliminated in some subgroups by stratified analyses. Thus, the subgroup studies are likely more relevant to difference in genetic background and lifestyle. Third, our meta-analysis was based on unadjusted estimates due to the lack of original details.
In conclusion, our meta-analysis suggests that the MMP-1(−1607) 1G/2G polymorphism is associated with oral cancer risk. Moreover, subgroup analyses based on ethnicity and tumor site suggest that the 2G allele/genotype plays different roles in Asian and European populations and increases the susceptibility of nonbuccal cancer. No significant relationships between the MMP-2(−1306) C/T or MMP-3(−1171) 5A/6A polymorphisms and oral cancer susceptibility were observed. However, due to the limited study numbers and relatively small sample sizes, our results should be validated in future studies.
Footnotes
Acknowledgments
This study was supported by the Science and Technology Development Project of Jilin Province of China (Grant Nos. 20110708, 201401010 55JC, and 20180414014GH) and Project of Educational Department, Jilin Province of China (Grant No. 2016479).
Authors' Contributions
W.Z.S., X.L.C., and H.Y.S. confirmed the topic of this article. Y.C.L., Y.Q.W., H.Y.S., Y.Z, and H.L. performed the statistical analysis and analyzed the results. W.Z.Y. and W.Z.S. wrote the article. All authors approved the final version of the article.
Author Disclosure Statement
No competing financial interests exist.