




Abstract
Aims:
We analyzed and compared the gene expression profiles (GSE92763) from normal melanocytes with malignant melanoma cell lines to identify genes that were differentially expressed that could serve as potential biomarkers for melanoma diagnosis.
Materials and Methods:
Gene expression profiles from the GSE92763 dataset were downloaded from the Gene Expression Omnibus (GEO) database. By comparing normal human melanocytes with multiple melanoma cell lines we identified 127 differentially expressed genes whose expression was altered. These data were used to identify hub genes associated with protein-protein interaction networks using Cytoscape software. To explore the biological functions of the aforementioned hub genes, we utilized the clusterProfiler package in R studio to perform Gene Ontology (GO) and Kyoto Encyclopedia of Genes and Genomes (KEGG) enrichment analyses. We then used the Gene Expression Profiling Interactive Analysis (GEPIA) website to determine the association of these hub genes with overall survival (OS). In addition, we utilized the Oncomine and Cancer Cell Line Encyclopedia (CCLE) databases to further analyze and compare the expression of these key genes associated with melanoma with other tumor types.
Results:
The hub genes included three upregulated and seven downregulated genes, which were linked with extracellular junctions, migration, paracrine and proliferation functions based on GO. In addition, we performed a confirmatory analysis of the hub genes using The Cancer Genome Atlas (TCGA) database. This analysis revealed that the expression of the Fibulin 1 (FBLN1; gene ID: 2192) gene was significantly downregulated in melanomas, and that its expression level in melanoma patients was significantly associated with OS with high expressors having better OS (log-rank p = 0.0034, hazard ratio = 1.5, p = 0.0036). We further analyzed the expression of FBLN1 in melanoma using the TCGA and Oncomine databases, and confirmed that FBLN1 is expressed at lower levels than in other cells (p = 2.03E−15, t = −15.586). FBLN1 has extremely high DNA copy number and low messenger RNA expression in melanoma cell lines according to the CCLE analysis.
Conclusion:
These results suggest that FBLN1 expression may be utilized as a biomarker and essential prognostic factor for melanoma; as well as provide an important theoretical basis for the development of melanoma treatments.
Introduction
Melanoma is caused by the malignant proliferation of melanocytes (normal pigment-producing cells in the skin) (Damsky et al., 2014). Of the patients diagnosed with cutaneous malignant melanoma, ∼20% will die from metastatic disease; and for patients diagnosed with local and distant metastases, the 10-year survival rates are 64% and 16%, respectively (Buzaid and Atkins, 2001). Morbidity and mortality in melanoma are highly associated with metastatic disease, which can occur even from thin primary tumors (Tas, 2012; Damsky et al., 2014). Therefore, the search for new biomarkers is of great clinical importance for early diagnoses and treatment decisions.
Recently microRNAs (miRNAs) have been identified as a candidate class of nucleic acids for exploration of their potential in the diagnosis and treatment outcomes of multiple types of cancers (Huang et al., 2015; Yao et al., 2015). miRNAs are a type of small endogenous noncoding RNAs that directly bind to the 3′-untranslated regions of target messenger RNAs (mRNAs) and regulate gene expression (Ameres and Zamore, 2013). There is considerable evidence that miRNAs can act as oncogenes or tumor suppressor genes through their physiological roles related to mRNA stability and processing (Guo et al., 2015; Liang et al., 2018). In previous studies, biomarkers identified for melanoma were mostly upregulated genes, such as S100, paired box (PAX), and melanocyte inducing transcription factor (MITF), that have been associated with proliferation and metastasis (Hamada, 1992; Liu et al., 2019; Sharma et al., 2020). However, some downregulated genes also participate in important regulation processes during carcinogenesis.
In this study, a bioinformatics approach was applied to analyze gene expression data to identify DEGs between melanocytes and melanoma cells. GSE92763 gene chips, which contained the gene expression profiles of 7 normal melanocyte samples and 30 melanoma samples, were obtained from Gene Expression Omnibus (GEO) database of the National Center for Biotechnology Information (NCBI). In addition, large databases of melanoma genetic information were analyzed to investigate the expression pattern of Fibulin 1 (FBLN1) in melanoma cells compared with normal tissues or other types of cancer cells.
Materials and Methods
Data resource
Data from the Affymetrix microarray file GSE92763 were downloaded from the public NCBI-GEO database and executed on the GPL8234 platform. GSE92763 was comprised of 7 normal melanocyte samples and 30 melanoma samples. All data from the GSE were processed using the robust multiarray average (RMA) algorithm, and all the specimens were collected before any chemotherapy.
Data preprocessing
After the GSE92763 dataset was downloaded, we transformed the probe identification numbers into gene symbols. When multiple probes corresponded to one gene, the probe with the highest expression level was selected.
Identification of DEGs associated with the carcinogenic transformation of melanocytes
The row data (GSE92763_series_matrix.txt) and probe data (GSE92763_family. soft) were used to analyze the GEO database. The limma package in R studio was applied to identify mRNA expression differences (Smyth, 2004). We used the linear model and ebayes functions of the limma package to test for differential gene expression. Genes with a |log2-fold change (FC)| ≥2 and corrected p-values <0.01 were used as cutoff criterion.
Establishment of a protein-protein interaction network and identification of hub genes
The STRING website was used to identify protein-protein interactions (PPIs) after the difference in mRNA expression was calculated between normal melanocytes and transformed melanoma cell lines (Franceschini et al., 2013). The above obtained differential genes were entered into the multiprotein interaction database, then the proteins that did not form a network were hidden and those with the highest confidence were set to be >0.9. After exporting the data, Cytoscape (version 3.6) software was used for a visual analysis of the PPI (Shannon et al., 2003). To identify hub proteins expressed by the DEGs, the MCODE plug-in was utilized to screen important modules of the entire network to obtain protein interaction clusters (K = 15, other parameters are set to default values, score ≥4).
Gene ontology and pathway enrichment analyses
To explore the biological functions of the hub genes, we utilized the clusterProfiler package in R studio to perform Gene Ontology (GO) and Kyoto Encyclopedia of Genes and Genomes (KEGG) enrichment analyses (Yu et al., 2012).
Validation and survival analysis based on the Cancer Genome Atlas and Oncomine database
The Gene Expression Profiling Interactive Analysis (GEPIA) online database (https://gepia.cancer-pku.cn) was employed in the overall survival (OS) analysis (Tang et al., 2017). The hub genes found in the PPI network were matched to The Cancer Genome Atlas (TCGA) normal and GTEx databases (|log2 FC| cutoff: 2 and p-value cutoff: 0.01 as the threshold criteria). Next, we conducted an OS analysis of the hub genes to determine how they affected the OS rate of melanoma patients. The key genes obtained from the TCGA and the Oncomine online databases were compared with their expression levels in multiple normal and transformed cell lines.
Validation of hub gene expression by Oncomine analysis
The Oncomine (https://www.oncomine.org) database used under the following screening conditions: (1) cancer type: melanoma; (2) gene: FBLN1; (3) data type: mRNA; (4) analysis type: cancer versus normal analysis; and (5) threshold setting conditions (p < 10−6; FC >8; gene rank <1%).
Evaluation of hub gene mRNA levels by Cancer Cell lines Encyclopedia analysis
The mRNA expression levels of FBLN1 in various types of cancers were analyzed using Cancer Cell lines Encyclopedia (CCLE) (https://portals.broadinstitute.org/ccle/home), (Liu et al., 2019).
Results
Identification of DEGs between melanocytes and melanoma cells
A total of 37 expression profiles including 7 from normal melanocyte samples and 30 from a total of 7 different melanoma cell lines (WM1972_F, WM1976_F, WM115_F, WM3130_F, WM115_F, WM3523_A, WM3734_A) were identified (Fig. 1). We created a heat map (Fig. 2) of 127 genes that demonstrated significantly different expression levels. These included 40 genes with elevated levels in melanoma cells and 87 genes with elevated expression in normal melanocyte cells.
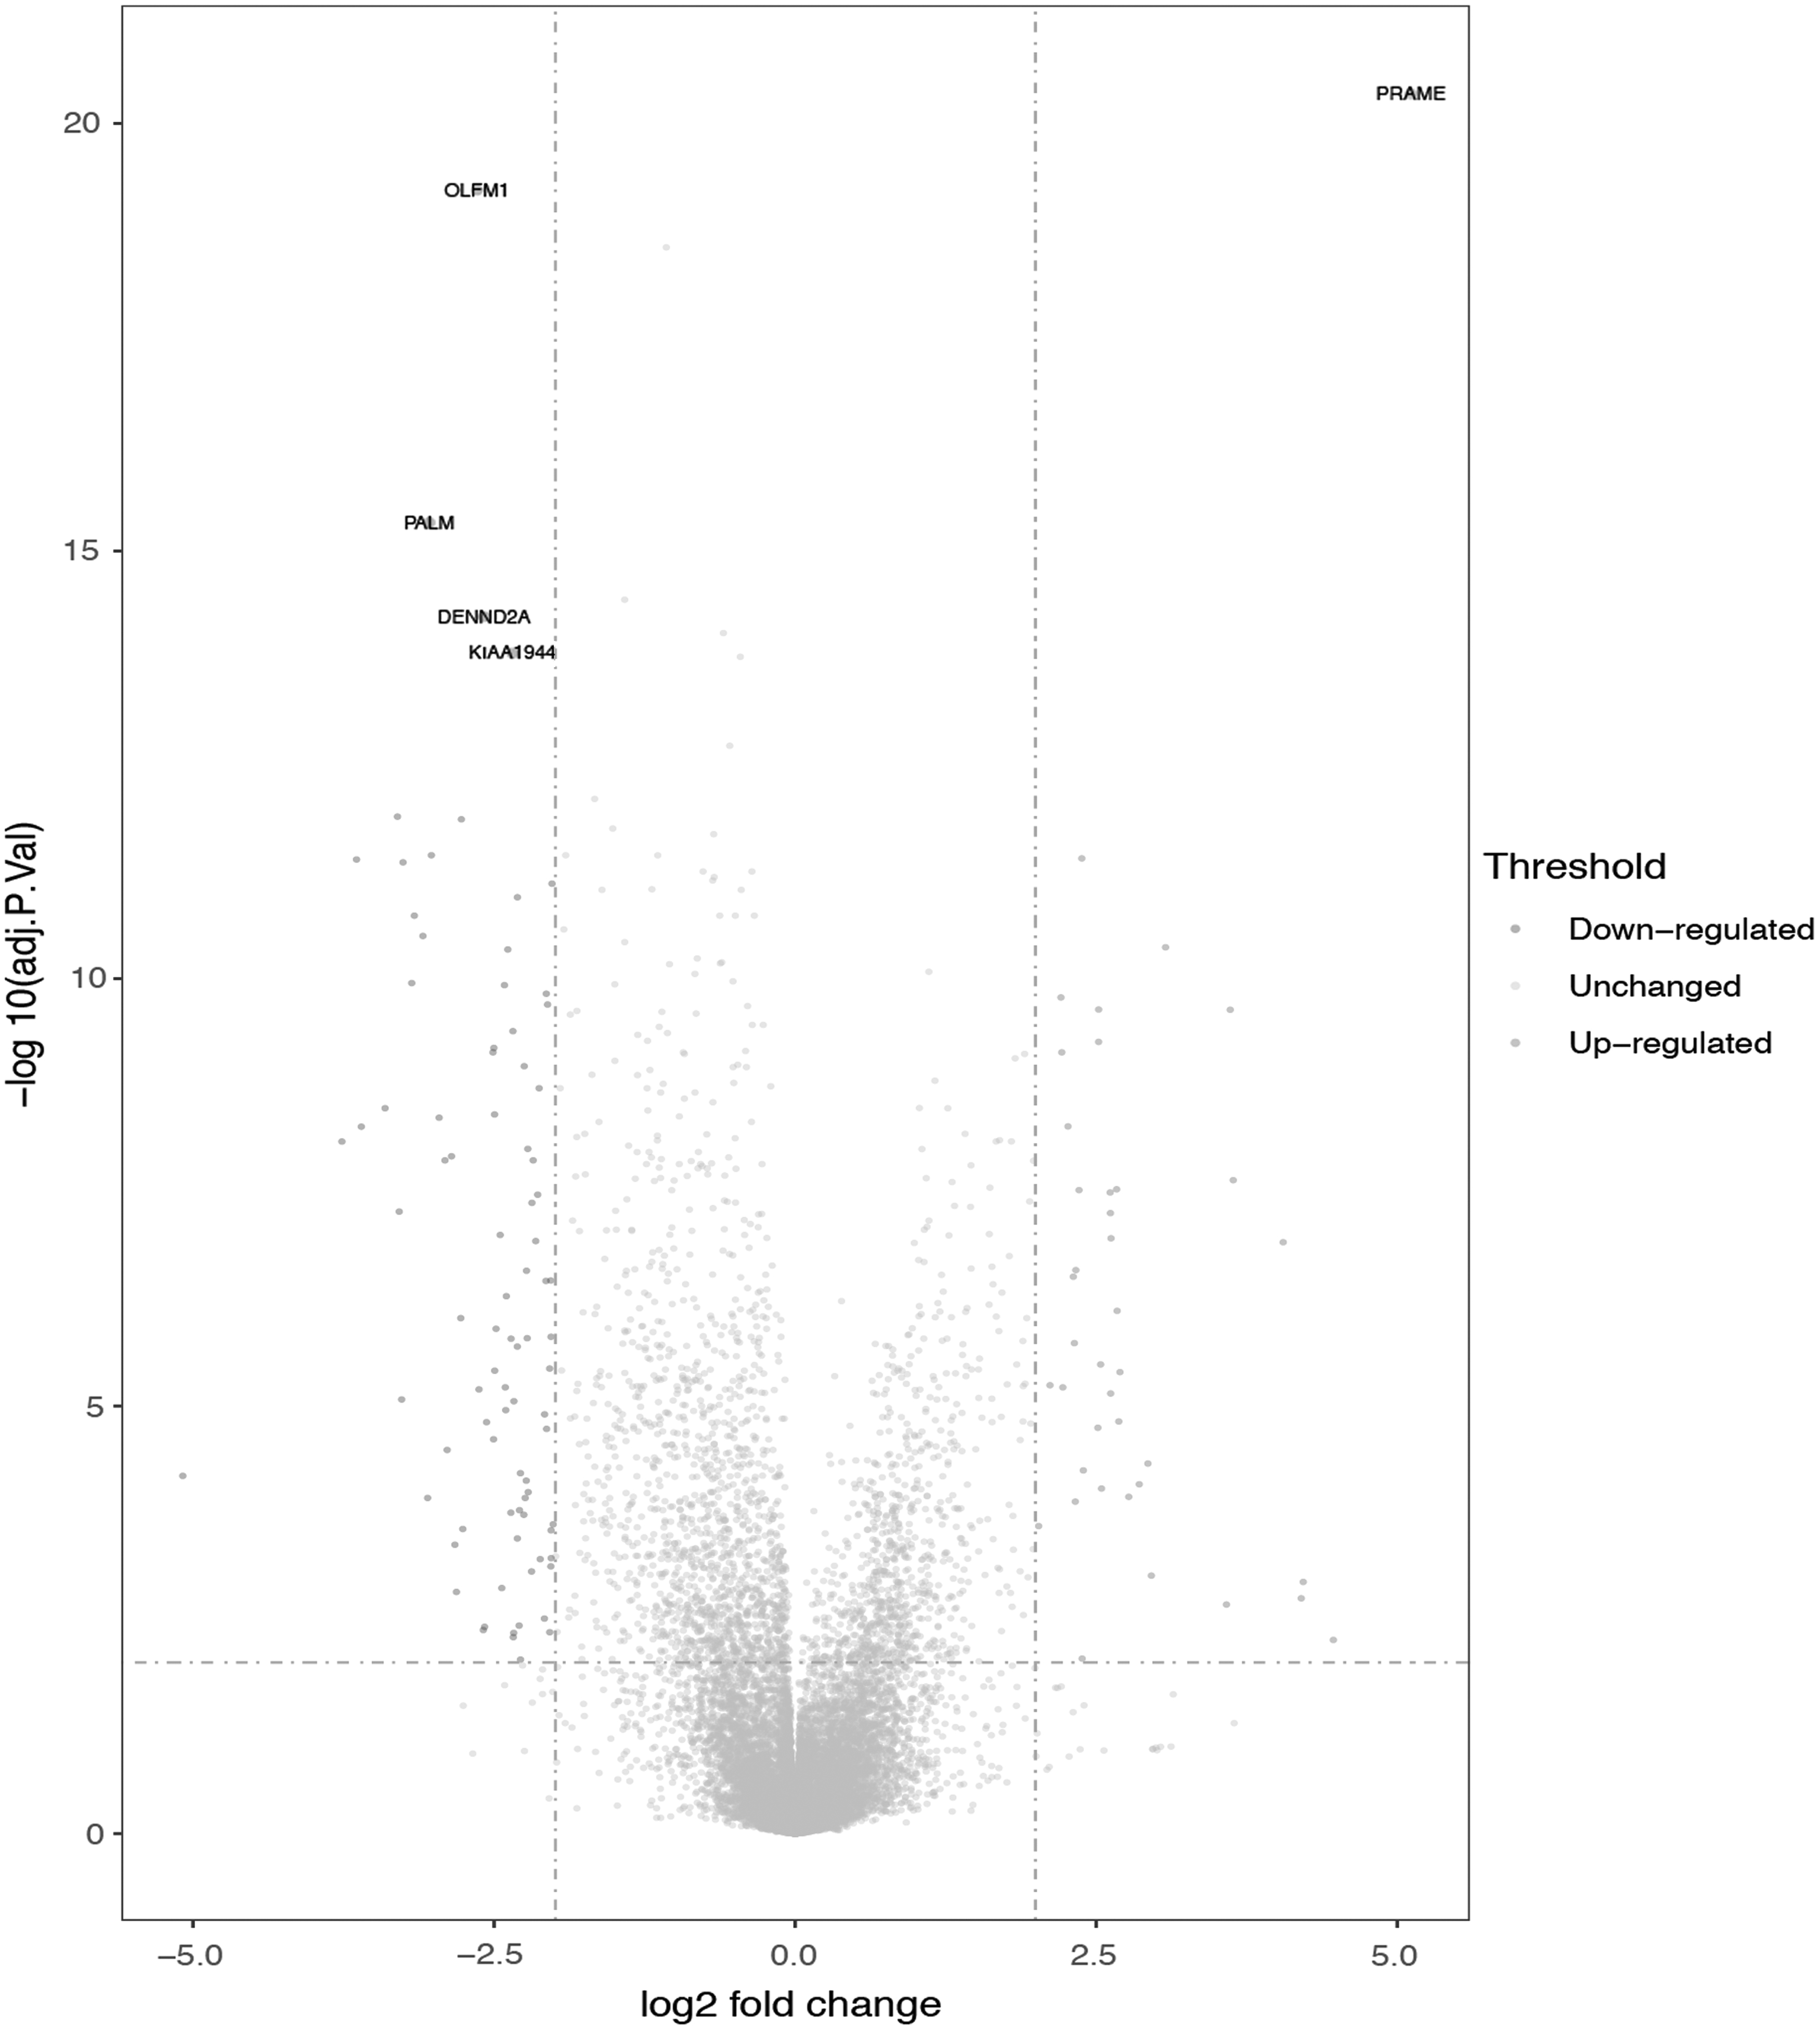
Volcano plot of DEGs between 7 normal melanocyte samples and 30 melanoma cell samples. Red dots denote upregulated genes in melanoma and blue dots denote high expression genes in melanocyte. The gray dots represent the genes for which the difference is not statistically significant. The top expression gene included four downregulated genes (OLFM1, PALM, DENND2A, and KIAA1944) and the top downregulated gene (PRAME). DEGs, differentially expressed genes.
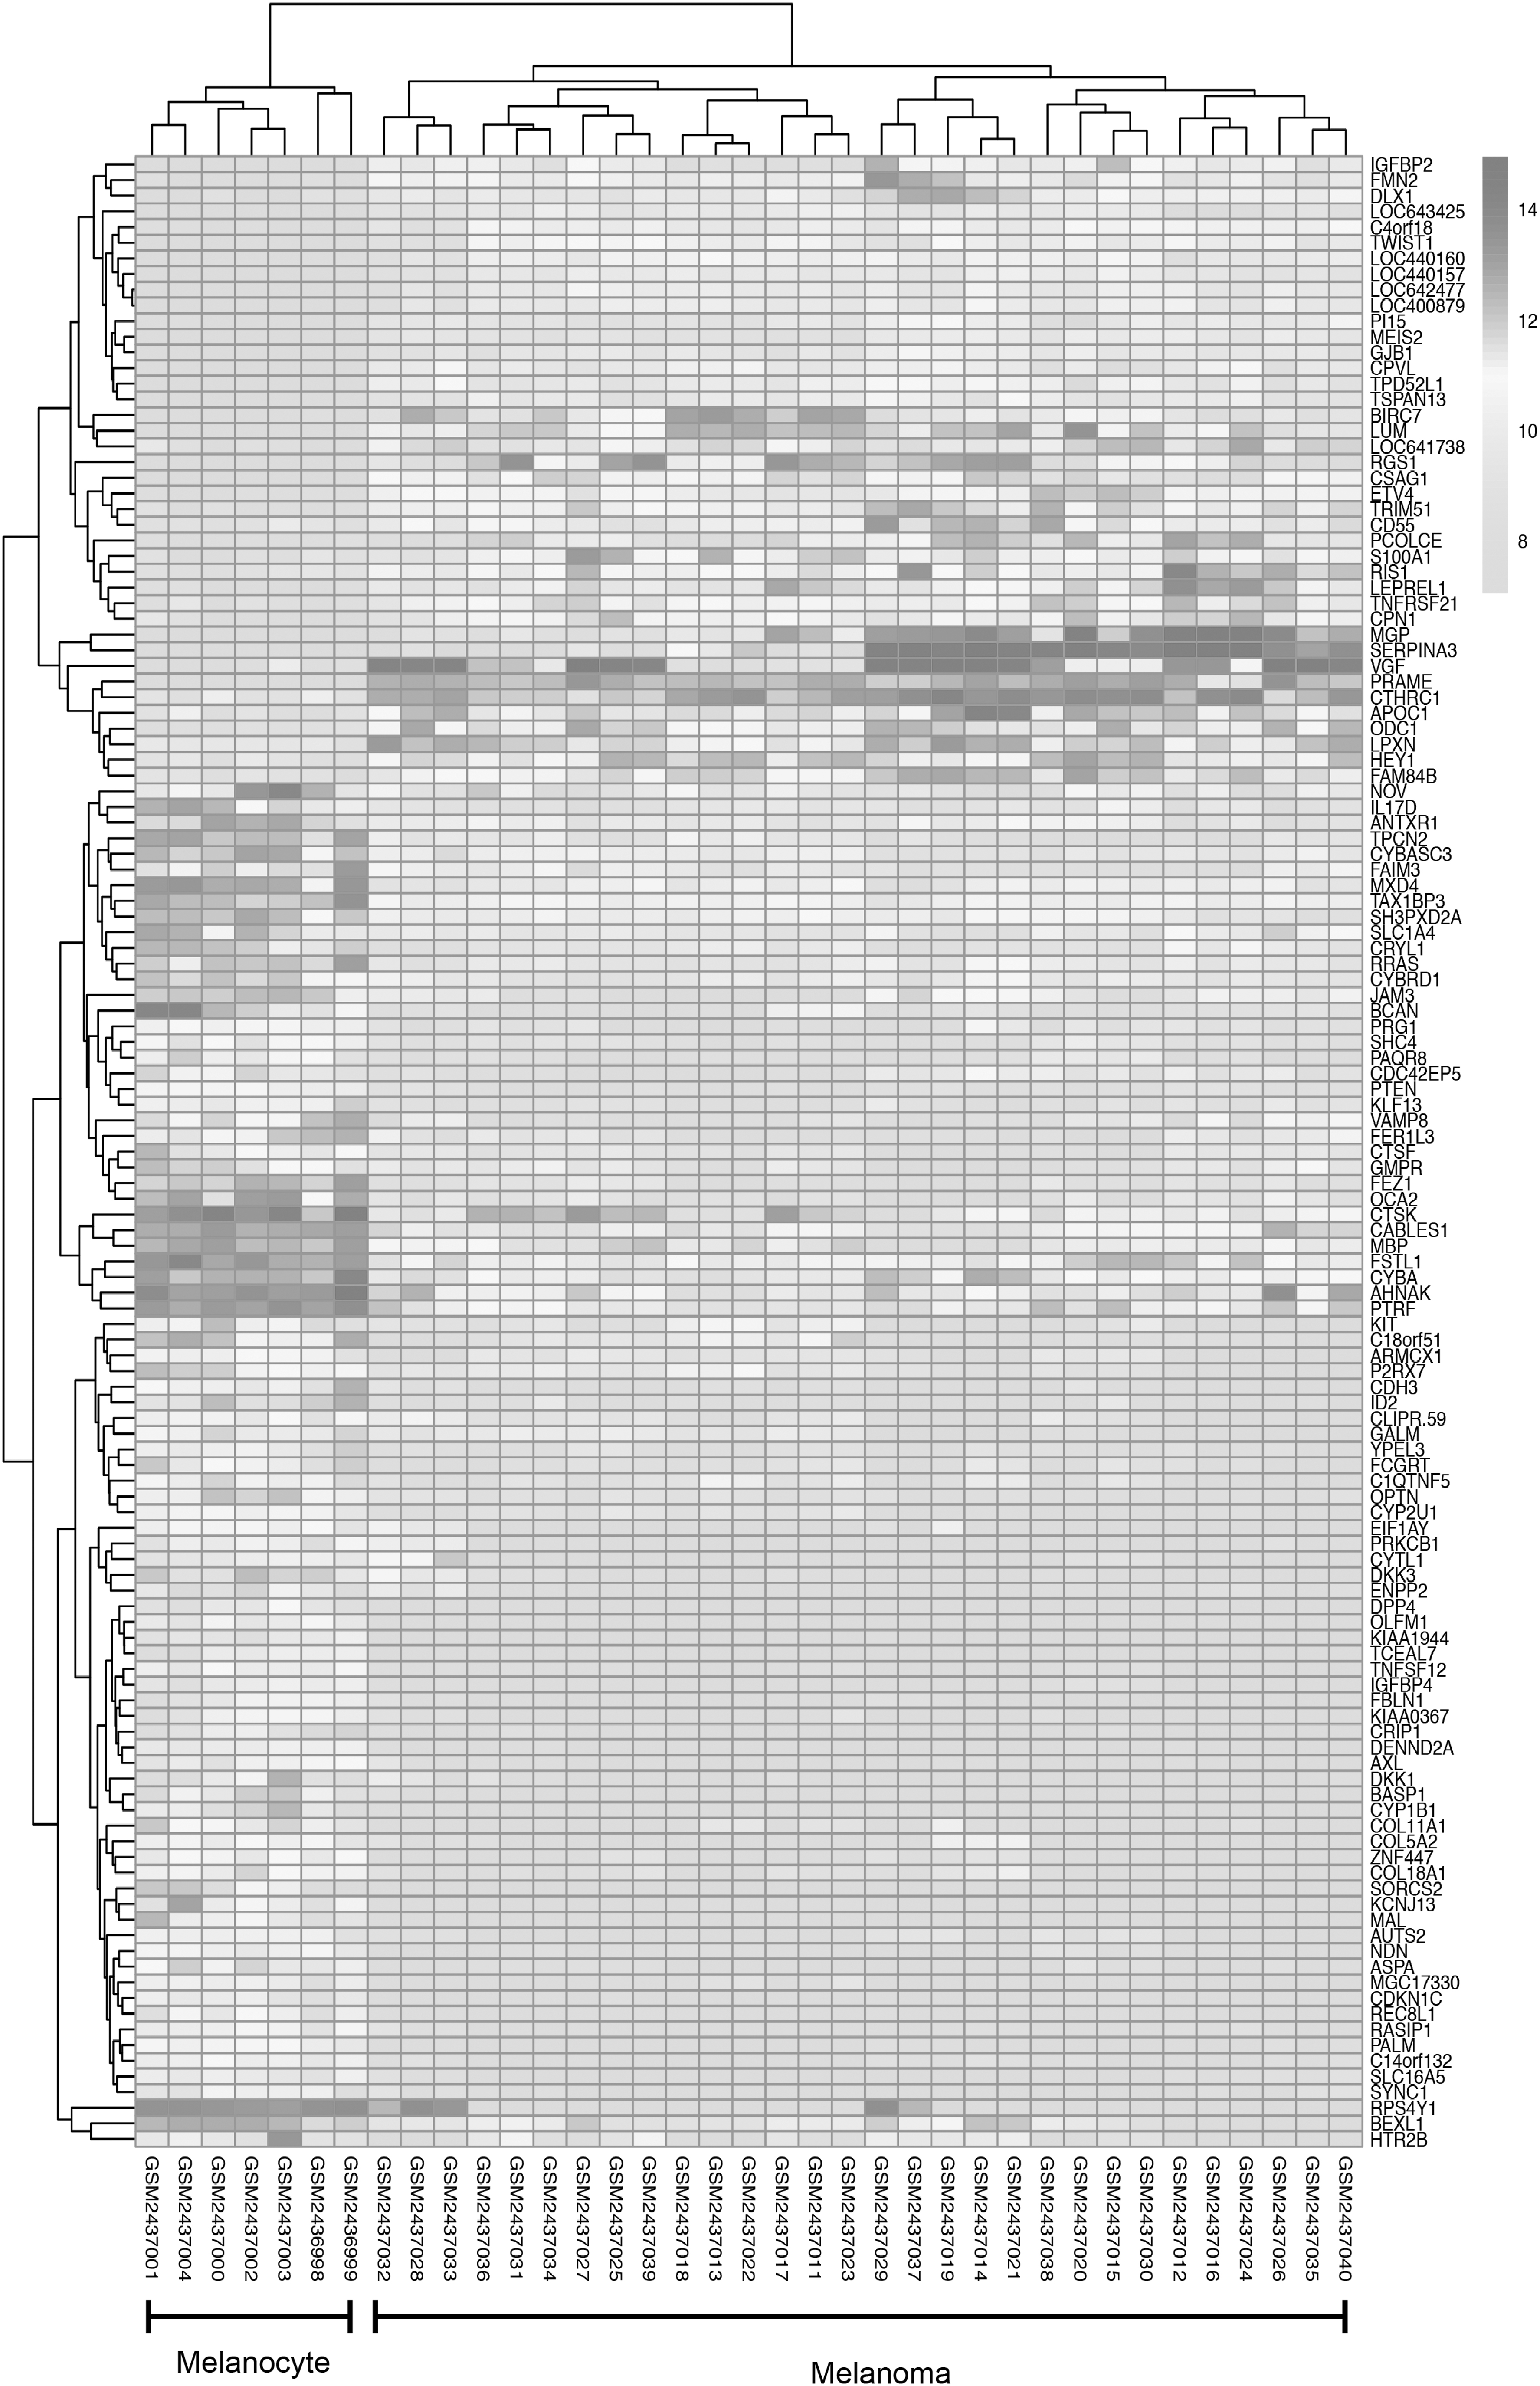
Heat map analysis of the 127 differential genes. Major enrichment areas of differential genes are highlighted.
Module analysis and selection of cluster protein from the MCODE network
All of the DEGs were uploaded to the STRING website to identify any PPI networks; using the Cytoscape software we identified a total of 69 nodes with 70 edges (Fig. 3). One significant cluster comprised of 10 nodes and 19 edges was selected from the PPI network using the MCODE plug-in. Three upregulated genes VGF nerve growth factor inducible (VGF), procollagen C-endopeptidase enhancer (PCOLCE), lumican (LUM), and seven downregulated genes follistatin-like 1 (FSTL1), insulin-like growth factor binding protein 4 (IGEBP4), collagen type V alpha 2 chain (COL5A2), leprecan-like 1 (LEPREL1), FBLN1, collagen type XI alpha 1 chain (COL11A1), collagen type XVIII alpha 1 chain (COL18A1) were located in this cluster. These were tested in silico as molecular markers for the transformation of normal melanocytes to melanoma cells.

PPI map. Point represents the gene; line, PPI; genes forming clusters are marked in yellow (score = 4.2). In the resulting protein clusters, green represents downregulated protein expression, and red represents upregulated protein expression in melanoma cells. PPI, protein-protein interaction.
Gene term enrichment analysis and KEGG pathways analysis of DEGs
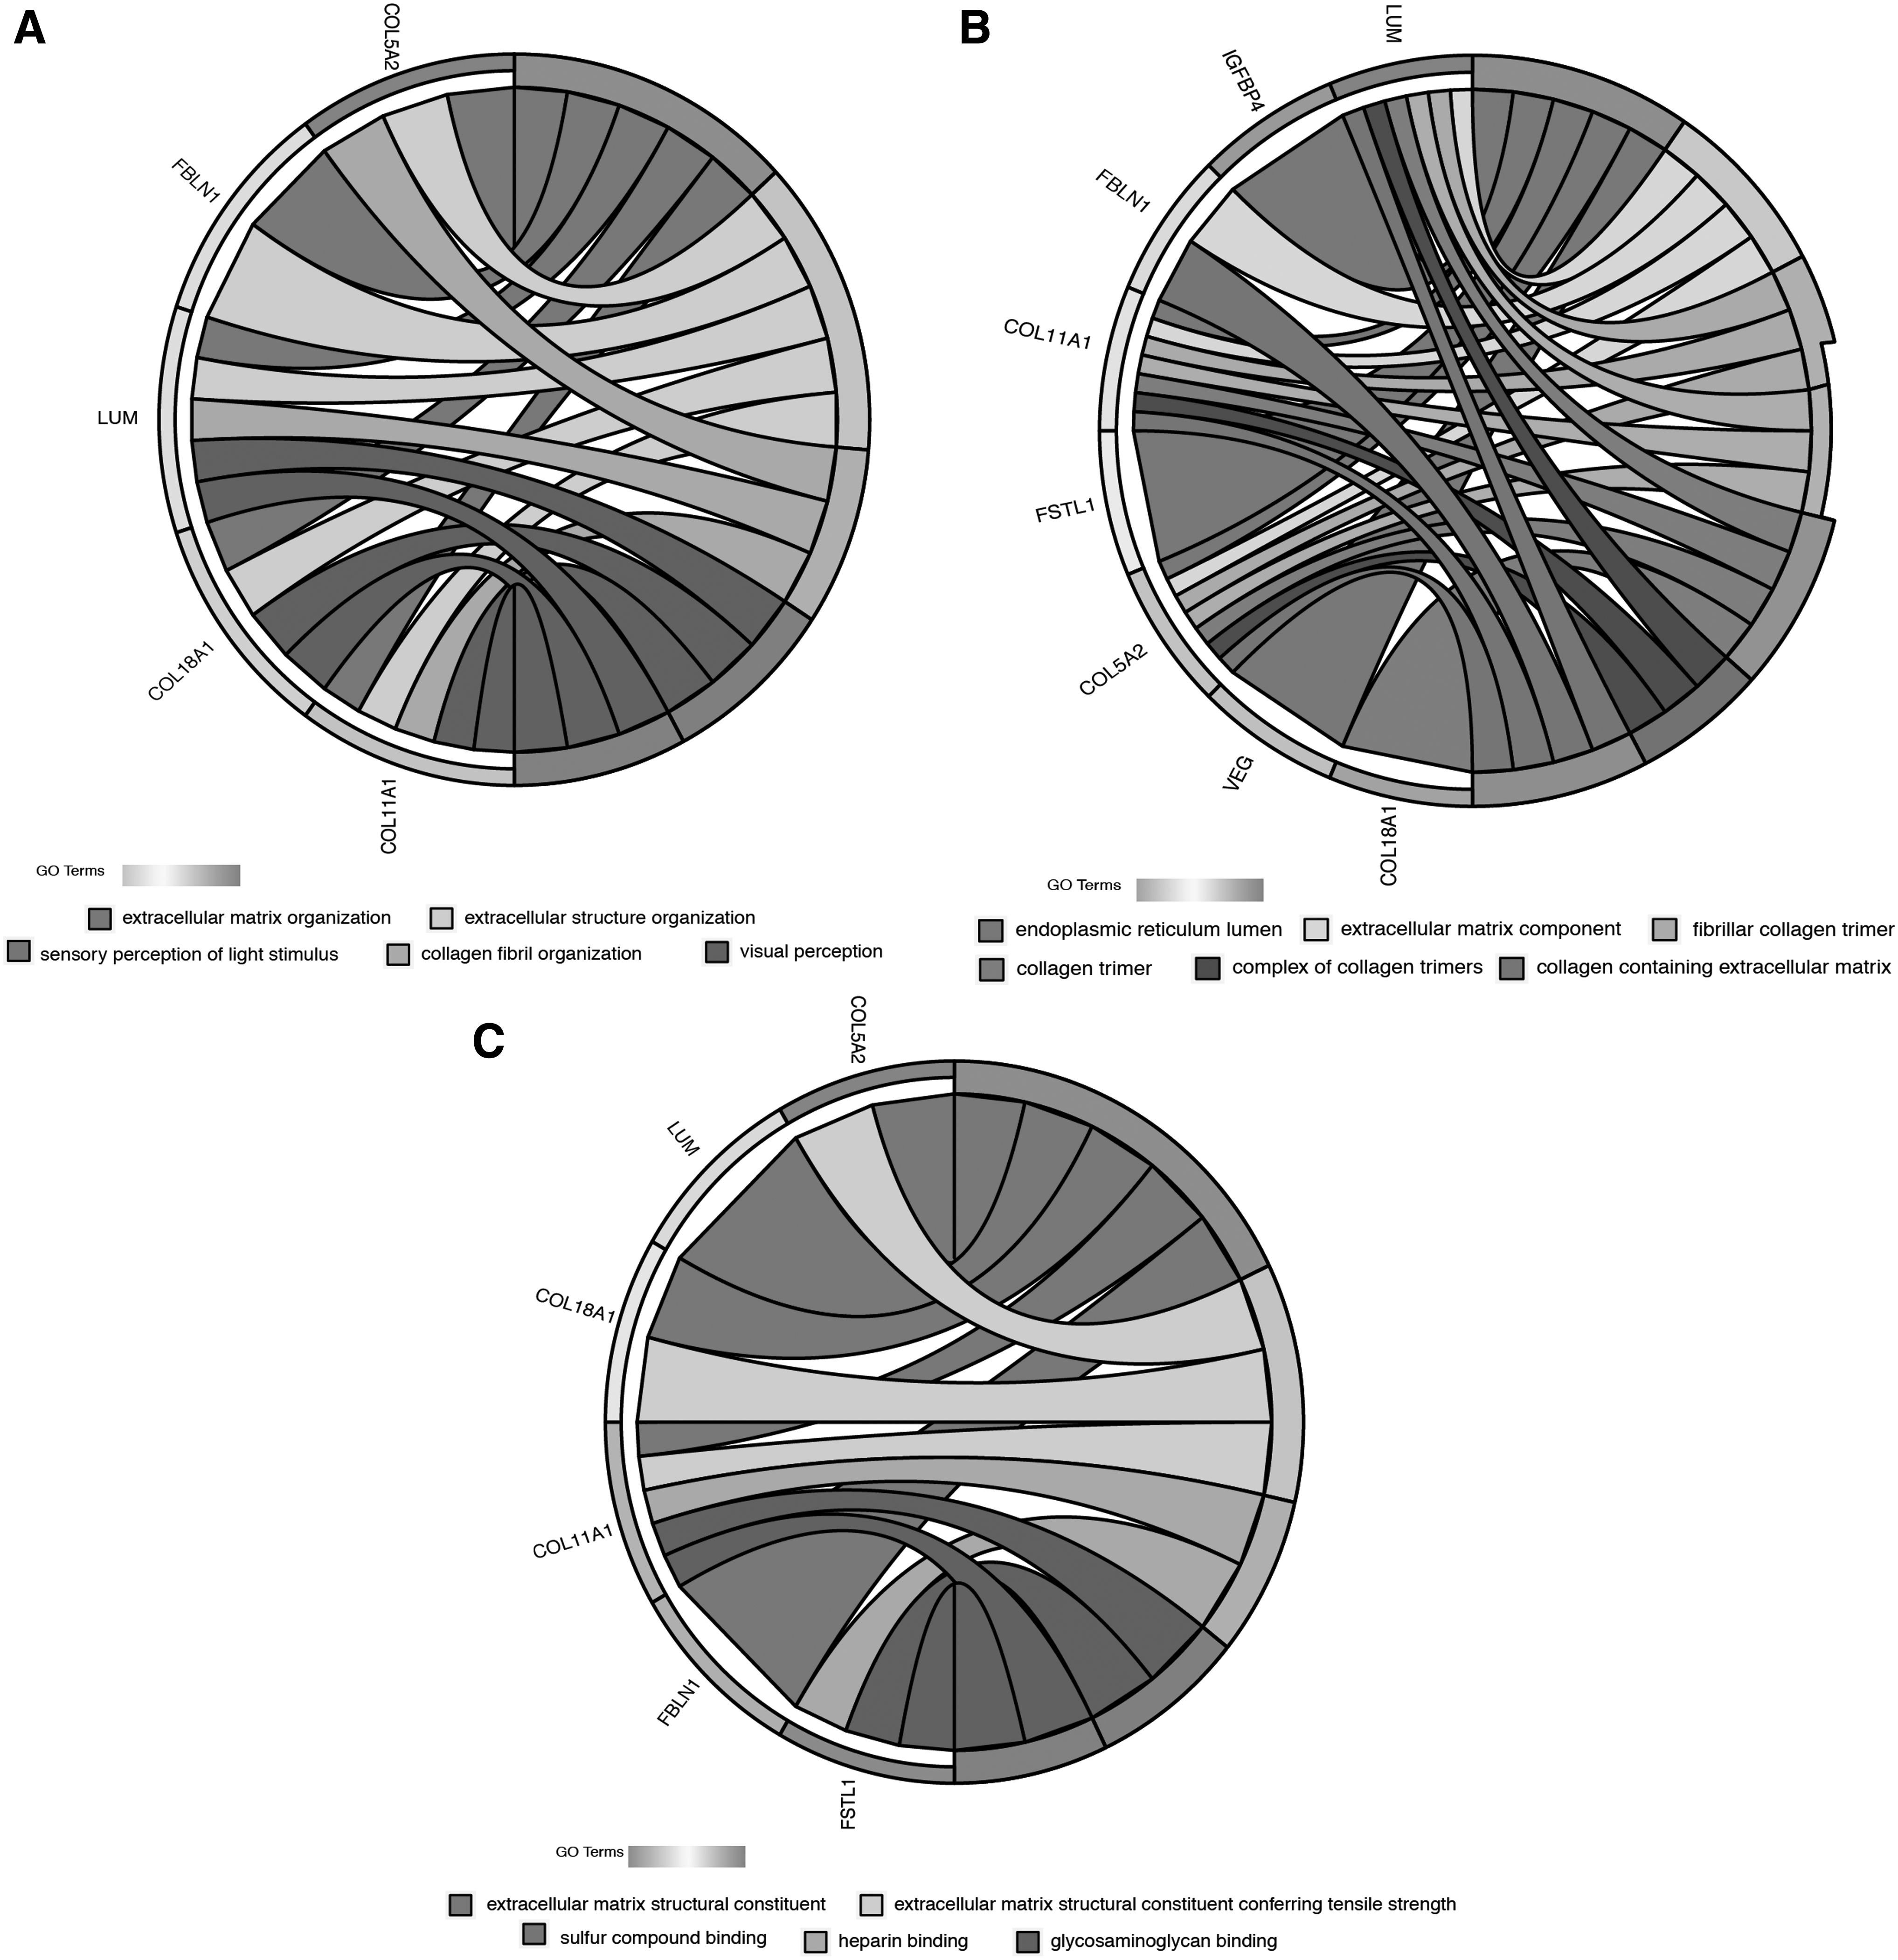
In Figure 4, the 10 genes in this cluster are divided into three functional categories: biological processes (BPs), cellular components (CCs), and molecular functional (MF). In the BP category, the enriched pathways in the DEGs were mainly related to cell proliferation and cancer cell metastasis, including, but not limited to, extracellular matrix (ECM) organization, epithelial cell proliferation, endodermal cell differentiation, and transforming growth factor beta1 production. The information enriched by CC was mainly related to collagen formation, cytoskeleton, and membrane structure construction, including but not limited to, ECM component, banded collagen fibril, and basement membrane. The components enriched in MF were related to cell connections, including, but not limited to, heparin binding, glycosaminoglycan binding, and sulfur compound binding. The KEGG cell signaling pathway was enriched in genes related to protein absorption and digestion. We found that five downregulated genes, COL11A1, COL18A1, COL5A2, FSTL1, FBLN1, and one upregulated gene, LUM, were the most highly enriched and were related to extracellular connections, cell invasion and migration (Fig. 5).
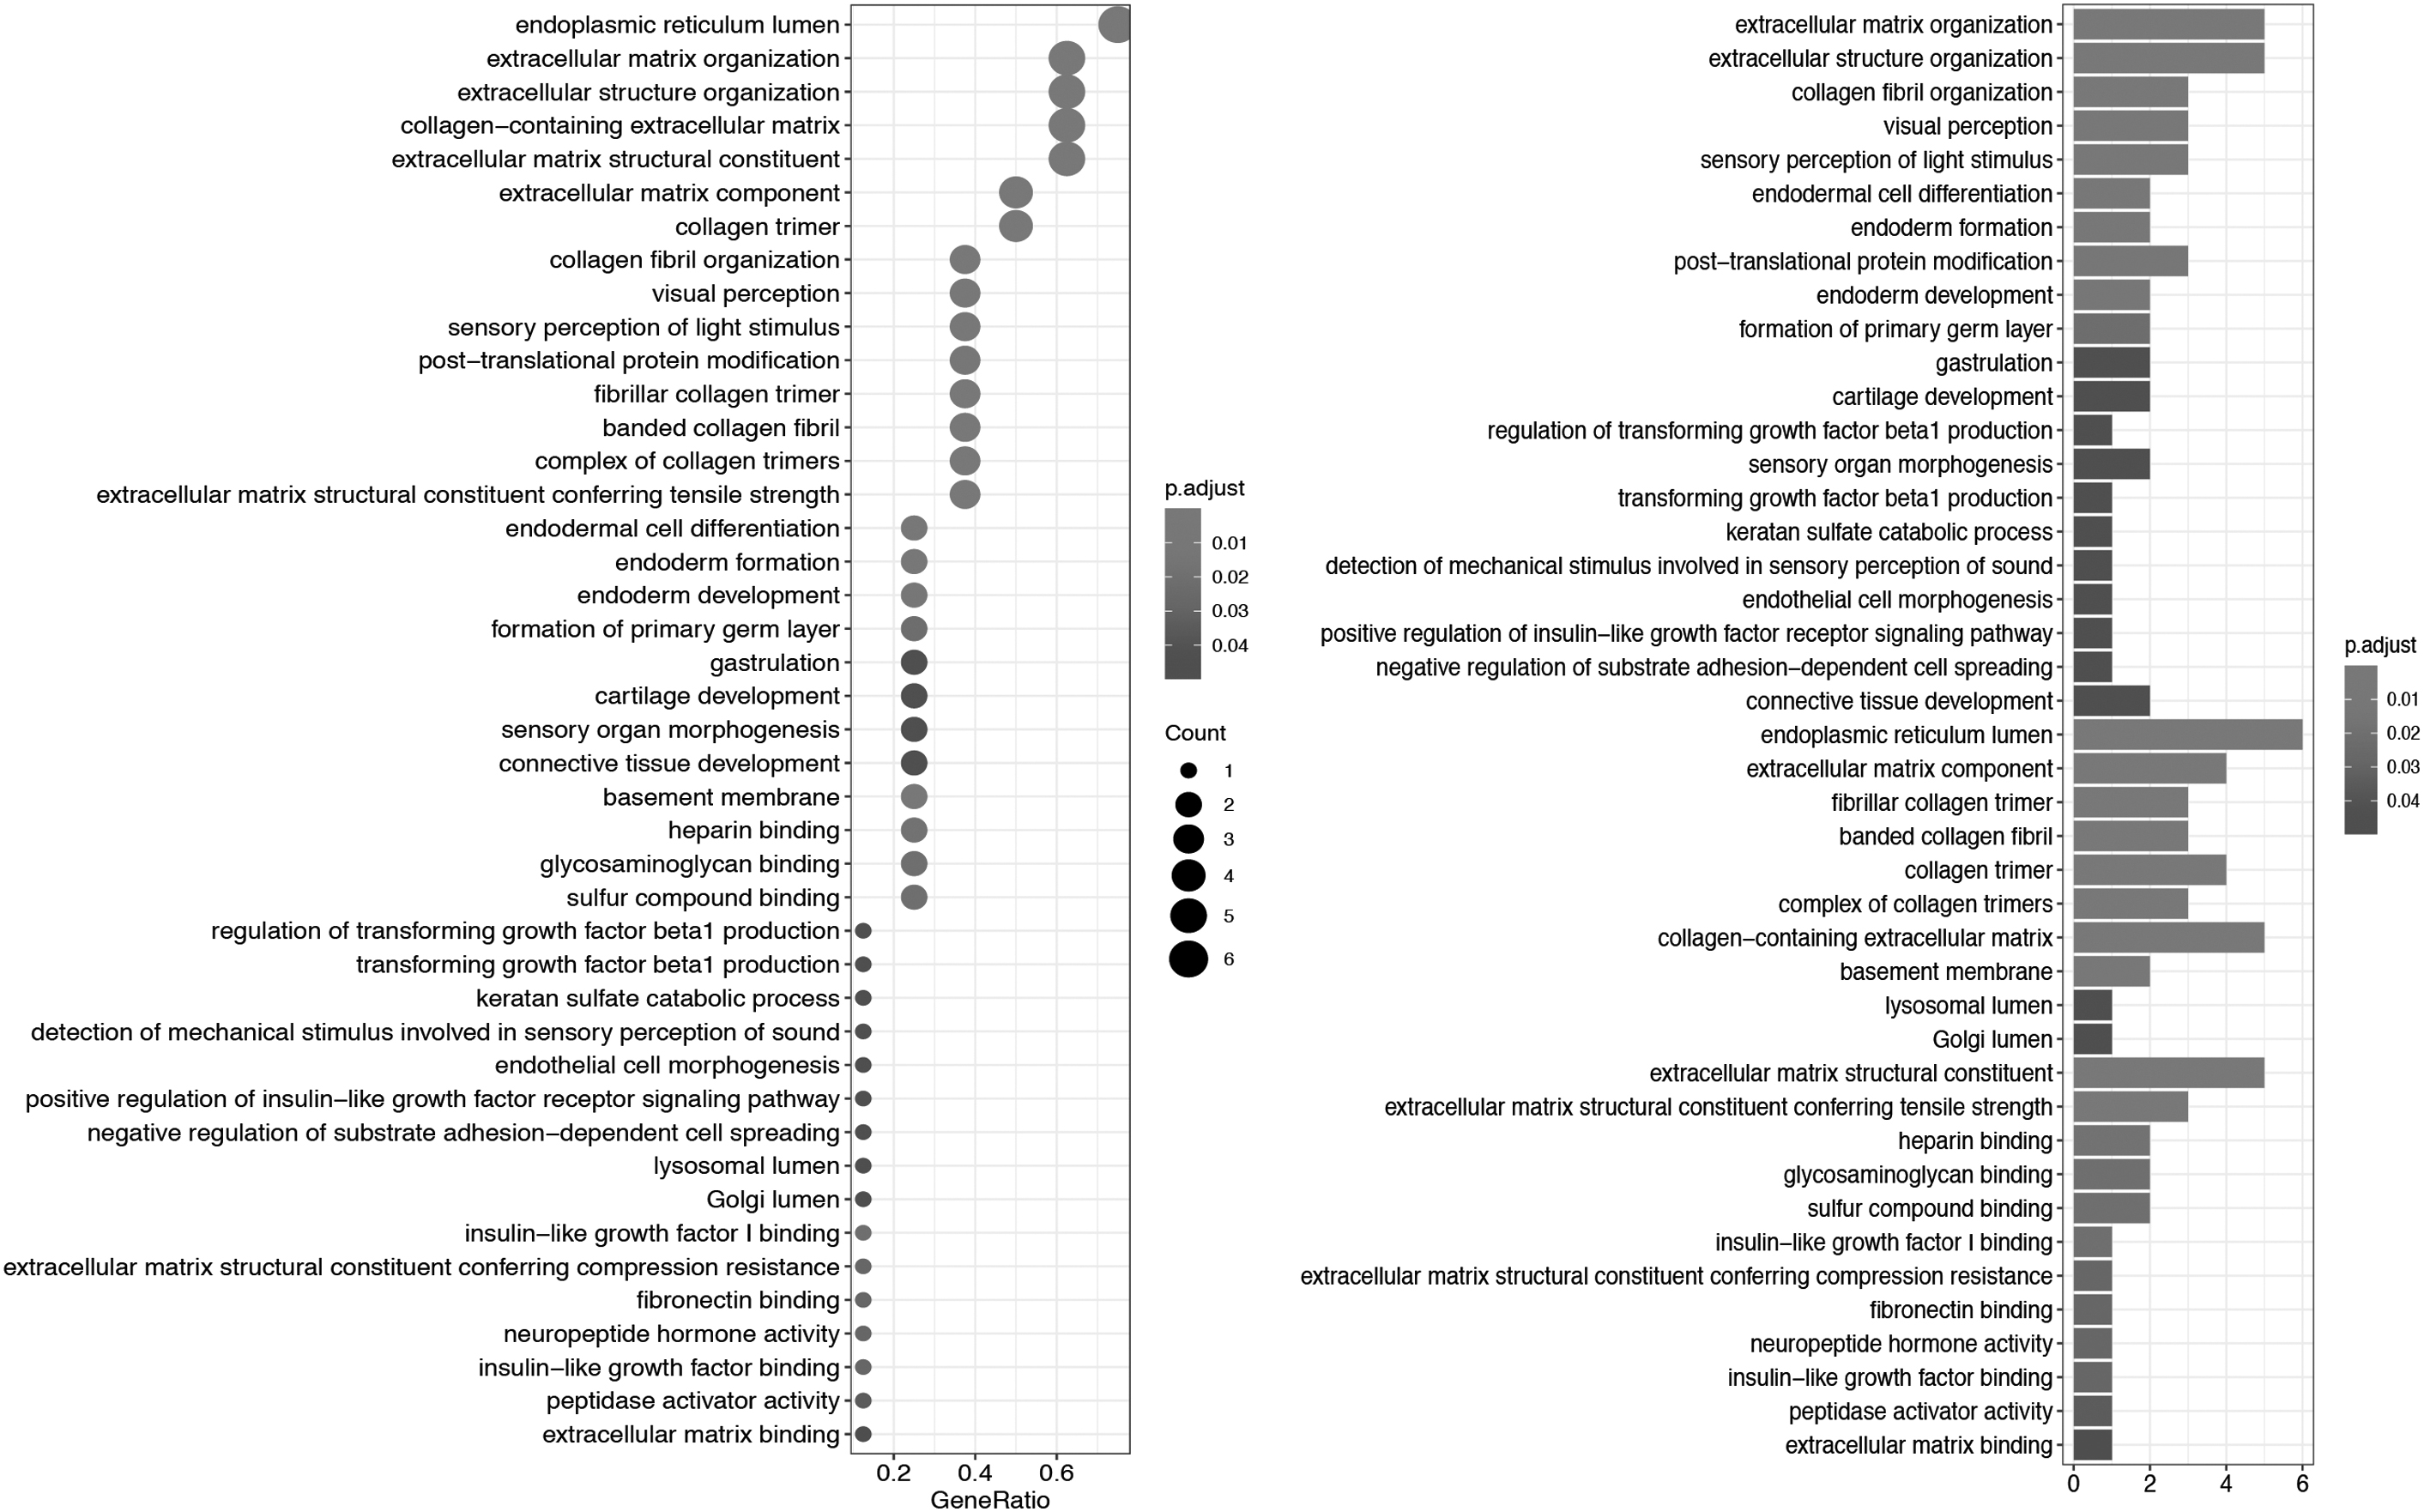
GO enrichment result of differential genes. The y-axis represents the enrichment of GO, and the x-axis represents the count and ratio of differential genes. GO, Gene Ontology.
Validation and survival analysis based on the TCGA database
To assess whether the identified gene expression changes were consistent among samples from GSE92763 and the LIHC (TCGA/GTEx) data we performed validation studies of the hub genes (10 genes in total) using the GEPIA website. It was noted that expression of melanoma FBLN1 gene in the LIHC database was downregulated when compared with normal healthy cells (p < 0.01). In addition, in the tumoral tissue of patients with melanoma, the OS was significantly different between high expression and low expression levels (Fig. 6A) using the log-rank test (log-rank p = 0.0034, hazard ratio (HR) = 1.5, p (HR) = 0.0036). This suggests that FBLN1 likely plays a key role in the formation and development of tumors, particularly as the other genes in this cluster did not show significant differences in mortality between high and low expression in melanoma patients.

The expression patterns of FBLN1 as determined by an analysis of the Oncomine database
A total of 348 different study results were analyzed using the Oncomine database (Fig. 6B). Among them, there were two studies with statistically significant differences in FBLN1 gene expression. For melanoma, one study identified decreased expression, and no studies identified increased expression of FLBN1 (Fig. 6B). In another study (Talantov et al., 2005) that included 45 cutaneous melanoma specimens and 7 normal skin samples analyzed through Affymetrix U133A microarrays, FBLN1 mRNA expression was highly significantly decreased in the melanoma samples (35.223-fold:p = 2.03−15, t = −15.586) when compared with normal skin tissues. These results suggest that FBLN1 may serve a unique role in the development of melanoma.
The expression levels of FBLN1 were downregulated and the DNA copy number increased in melanoma cell lines as determined by a CCLE analysis
The CCLE analysis was consistent with the Oncomine analysis, and again indicated that the expression of FBLN1 was decreased in melanoma cell lines relative to most other tumor types (Fig. 7). The expression levels of FBNL1 in melanoma cell lines ranked 28th of 39 distinct cancer types in the CCLE databases (Fig. 7A). FBLN1 mRNA expression levels were low in a variety of cancer cell lines (melanoma is shown in the purple frame). However, we found that the copy number of the FBLN1 gene in melanoma ranked highest among all tumor types (Fig. 7B), thus FBNL1 is a gene with a high DNA copy number and low mRNA expression in melanoma cells (Fig. 7C).
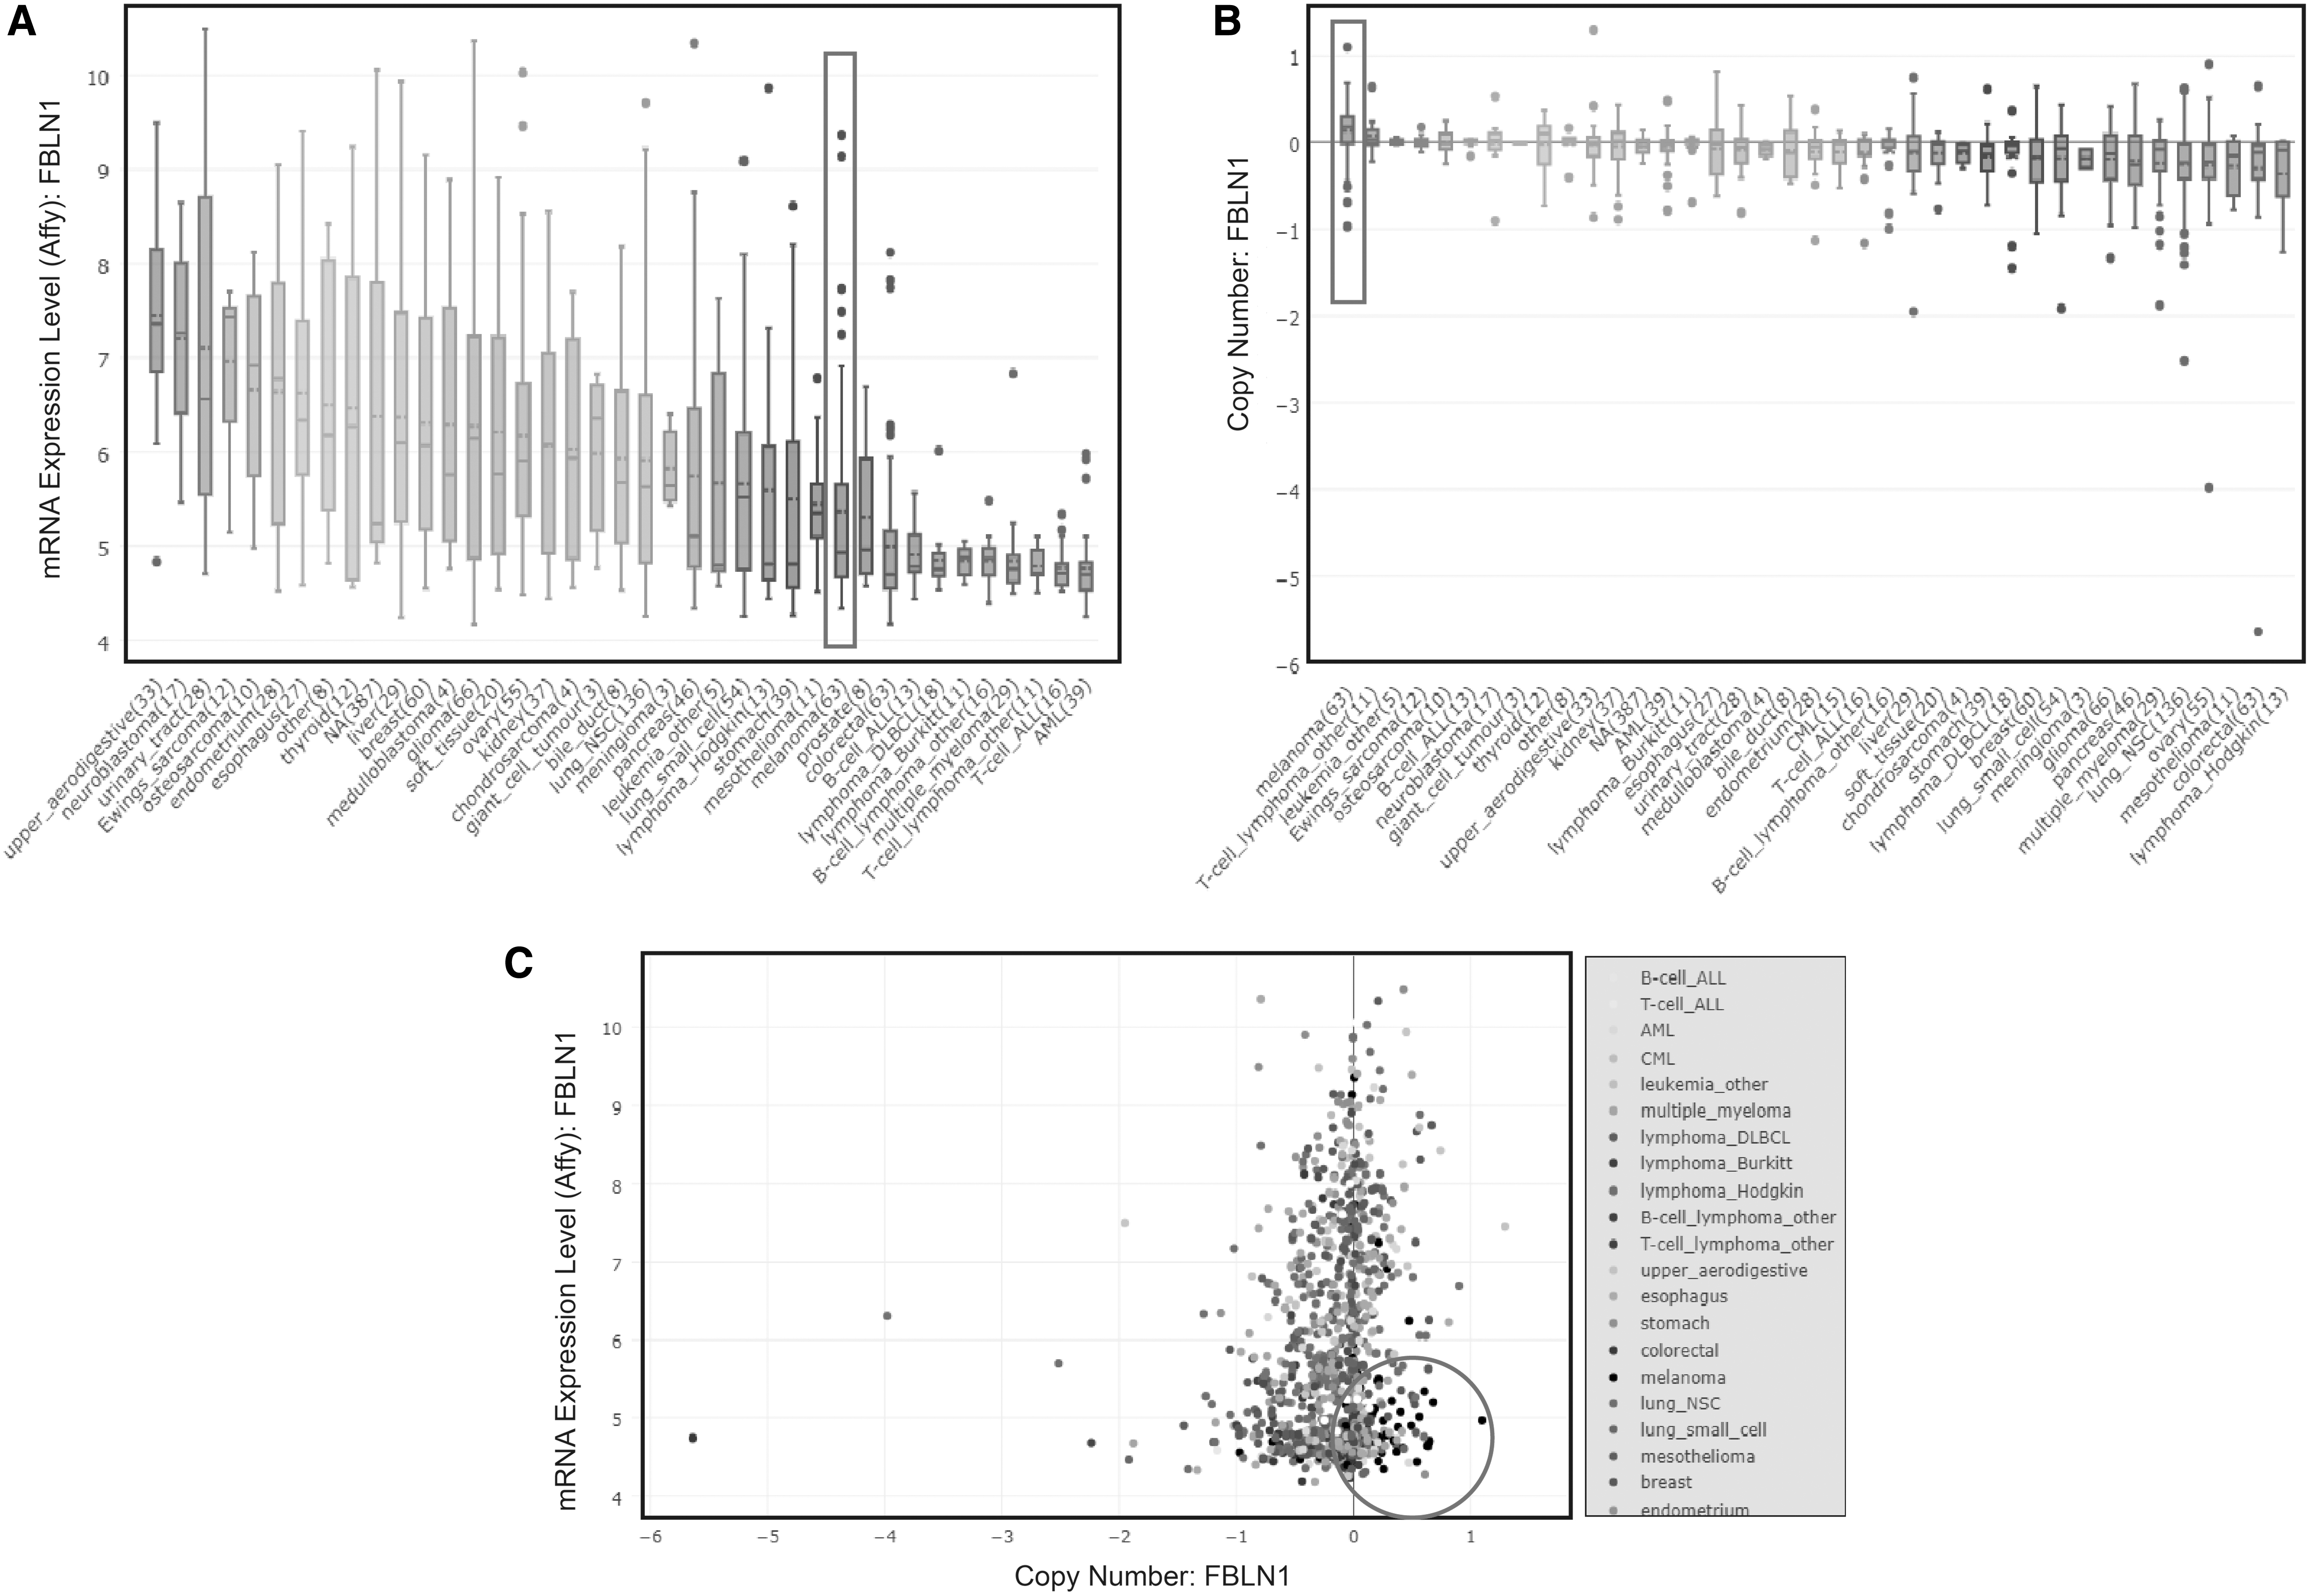
The expression levels of FBLN1 were downregulated in melanoma cell lines.
Discussion
In this study, through the use of in silico methods we identified candidate genes associated with melanoma cells. These genes and their associated pathways were identified using a combination of DEGs, GO, KEGG, and PPI-driven analyses. The results show that the downregulated expression of the FBLN1 gene was associated with the occurrence of melanoma in all cell lines examined. We obtained a cluster of 10 genes (from within a PPI containing 127 genes) (Fig. 5) that based on GO functional groupings within BP, CC, and MF were connected to the ECM, cell-to-cell interactions, and paracrine. In a study from Cédric Zeltz et al., a disturbed ECM dynamic was shown to open the door to novel paracrine, cell-cell, and cell-ECM interactions that have a significant impact on tumor growth, angiogenesis, metastasis, immunosuppression, and therapeutic resistance (Mohan et al., 2020; Tian et al., 2020; Zeltz et al., 2020). The TCGA database was used to further screen the genes in this cluster, and we found that OS in melanoma patients was significantly different between high and low expression levels of FBLN1 (log-rank p = 0.0034, HR = 1.5, p = 0.0036). Using Oncomine analysis, in a study by Talantov et al., FBLN1 expression in melanoma cells was decreased significantly compared with skin cells (p = 2.03E−15, t = −15.586). FBLN1 is a multifunctional secreted glycoprotein that acts as an ECM stabilizer through its interactions (Wlazlinski et al., 2007; Liu et al., 2016). FBLN1 inhibits the phosphorylation of extracellular signaling regulating kinases and myosin light chain streptokinase. In addition, it decreases intracellular calcium levels, which are important for activating multiple signaling cascades, such as the Ras/MAPK pathway (Twal et al., 2001). Due to the fact that among several major downregulated genes according to the GO enrichment were primarily related to extracellular junctions, the decreased expression of FBLN1 in melanoma suggests that it plays a role in inhibiting melanoma cell migration and metastasis. In previous studies, it has been suggested that the DNA-dependent protein kinase catalytic subunit (DNA-PKC) controls the secretion of multiple proteins, including FBLN1, related to the outer membrane structure of melanoma cells, and that this ultimately effects invasion and metastasis (Kotula et al., 2015). However, there are few reports concerning the markers of melanoma cell invasion and metastasis. FBLN1, as an important factor in cell junction and extracellular skeleton construction, was found to have reduced expression in seven melanoma cell lines (from different sources) compared with normal melanocytes. CCLE (Barretina et al., 2012) analyses showed that FBNL1 has decreased expression in melanoma cell lines compared with many other tumors and normal cell types. However, FBLN1 exhibits an extremely high DNA copy number. In conclusion, FBLN1 is poorly expressed in melanoma, and its decreased expression is prognostic for reduced OS among patients with melanoma. The aforementioned evidence indicates that FBLN1 may act as a potential modulator in melanoma.
Acknowledgments
Thanks to Bin Zhao (Official Wechat Account: SCIPhD) of Xiamen University for suggestions on the manuscript.
Footnotes
Authors' Contributions
All authors participated in the data analysis. X.-T.L. performed the comparative analysis using bioinformatics tools. T.-T.L., Q.-X.C., J.-X.Z., and Q.W. interpreted the data and wrote the article. All authors read and approved the final article.
Author Disclosure Statement
No competing financial interests exist.
Funding Information
This work was supported by the Natural Science Foundations of China (No. 31870780) and the National Science Foundation of Fujian Province of China (No. 2019J01021).