




Abstract
Background:
Diabetes mellitus is a known risk factor for stroke and may be linked to poorer post-stroke outcomes. However, the underlying molecular mechanisms remain to be fully identified. In this study we assessed the association of the lncRNA Nuclear enriched abundant transcript 1 (NEAT1)'s expression and its target miRNA-124 with acute ischemic stroke (AIS) in type II diabetic patients (T2DM).
Methods and Results:
Diabetic patients with stroke, non-diabetics with stroke, diabetics without stroke, and controls were recruited. NEAT1 and miR-124 expression levels in plasma samples from the participants were investigated using real-time reverse transcription-polymerase chain reaction (RT-qPCR). C reactive protein (CRP) and tumor necrosis factor alpha (TNF-α) were measured using an enzyme linked immunosorbent assay (ELISA) technique. In the DM+AIS group, NEAT1 expression was considerably higher, compared with AIS group and with control group. In comparison to the AIS-only patients, DM patients and controls, miR-124 expression was considerably lower in the DM+AIS group. NEAT1 was shown to have good predictive value for AIS risk in diabetics, based on Receiver Operating Characteristic (ROC) curve analysis. In both the DM+AIS and the AIS group, NEAT1 levels was strongly linked with the National Institutes of Health Stroke Scale (NIHSS) score. Also, a significant positive correlation was observed between NEAT1 expression and the inflammatory markers CRP and TNF-α and significant negative association with miRNA-124 in patient groups.
Conclusion:
In diabetic patients, the lncRNA NEAT1 may influence the incidence, severity, inflammation, and prognosis of AIS. NEAT1 expression levels could be used as a diagnostic marker of stroke in diabetic patients.
Introduction
Stroke is a cerebrovascular accident, it is the most frequent cause of disability and the 2nd leading cause of mortality in the world (Feigin et al, 2017). Stroke is a major health problem in the Egyptian population (Abd-Allah et al, 2018).
Heart diseases, hyperlipidemia, hypertension, cigarette smoking, type 2 diabetes, obesity, physical inactivity, depression, and psychological stress are all risk factors for ischemic stroke (IS) (Goldstein et al, 2011).
In type II diabetes mellitus (T2DM), endothelial dysfunction and microvascular complications occur as a result of hyperglycemia-induced oxidative stress. IS is caused primarily by microvascular complication, if cerebral vessels are directly affected (Ferreiro et al, 2010).
After an IS, patients with diabetes had a worse clinical result and a greater mortality rate (Chen et al, 2016). Stress hyperglycemia also increases mortality and risk of stroke recurrence in nondiabetics with IS (Zhu et al, 2019).
Early detection of the risk of acute ischemic stroke (AIS) and prognosis prediction may assist AIS patients have better treatment outcomes (Ren and Yang, 2018). Therefore, looking for compelling biomarkers that scan the risk of AIS and anticipate the outcome is necessary.
Previously, long noncoding RNAs (lncRNAs) were considered as nonfunctional transcriptional noise. It is now thought to play critical roles in the controlling of information transfer from DNA to proteins, including replication of DNA, splicing of RNA, and regulation of translation (Kopp, 2019).
The lncRNA nuclear-enriched abundant transcript 1 (NEAT1) is required for the development of paraspeckles (a nuclear substructure that are found in the interchromatin portion of the nucleus and help to regulate gene expression) and interacts with a variety of intracellular regulators (Lin et al, 2018).
LncRNA (NEAT1) has been linked to diabetes mellitus development. NEAT1 is aberrantly expressed in diabetic mice and NEAT1 is associated with the AKT/mTOR pathway (Huang et al, 2019). Moreover, NEAT1 promotes microglial cell injury and neuroinflammation by facilitating oxygen glucose deprivation/reoxygenation (OGD/R) (Han and Zhou, 2019). It also affects the microglia activation, AKT signaling, and neuronal apoptosis after cerebral ischemia reperfusion and may be a potential treatment target for cerebral ischemia reperfusion (Ni et al, 2020).
miR-124 has been reported as a direct target gene for NEAT1, also miR-124 has been linked to inflammation (Zhao et al, 2019). In the neurons of the nerve systems of developing adults, miR-124 is expressed, and during neuronal differentiation, it promotes neurite outgrowth (Yu et al, 2008), also it is expressed in microglia and known regulator of microglial quiescence in the central nervous system (CNS; Ponomarev et al, 2011).
NEAT1 expression in diabetic patients with IS has never been studied before. So, in this work, we evaluated the level of NEAT1 in T2DM patients with IS and examine if NEAT1 expression level and its target miR-124 are linked to IS in T2DM patients and investigate the predictive value that allows it to be used as a diagnostic marker for diabetic IS.
Materials and Methods
A cross-sectional study was conducted in Zagazig University hospital between January 2020 and January 2022. The following four groups of participants were assembled: diabetic patients with IS (diabetes mellitus [DM]+AIS) (30 patients), nondiabetic patients with stroke (AIS) (30 patients), diabetic patients without IS (DM) (50 patients), and healthy controls (50 participants).
IS patients who were admitted to the neurology department within 72 h of onset of symptoms were assigned to groups 1 and 2. Diabetic patients in group 3 were chosen at random from patients treated at medicine clinic.
The inclusion criteria were a focal or generalized neurological deficit lasted over 24 h during the initial neurological examination, as well as evidence of cerebral ischemia on a brain computed tomography (CT) scan.
Patients having intracerebral and subarachnoid hemorrhages were excluded from the study (nonischemic etiology). The study excluded patients having a history of alcoholism, cancer, chronic heart failure, respiratory disease, severe hepatic disorders, severe renal disorders, acute illness, hormone therapy, inflammatory diseases, and carotid artery surgery.
All participants had a detailed medical history taken and a full clinical evaluation, which included a general and neurological examination.
AIS was diagnosed based on clinical symptoms and verified with CT/magnetic resonance imaging scans. The National Institutes of Health Stroke Scale (NIHSS) objectively assesses the severity of stroke-related disability (Jauch et al, 2013).
The NIHSS is a 15-item neurologic assessment stroke scale used to assess consciousness, language, neglect, visual-field loss, extraocular movement, motor strength, ataxia, dysarthria, and sensory loss following an acute cerebral infarction. The patient's ability to answer questions and conduct tasks is rated/assessed by a professional observer. Items are rated with a score of 0-2, 0-3, or 0-4 with 0 as normal, and there is an allowance for untestable objects. It takes <10 min to complete a single patient assessment. The scale runs from 0 to 42, with higher ratings signifying greater severity. On the basis of NIHSS scores, stroke severity can be classified as follows: Very Severe: >21, Moderate/Severe: 15-20, Moderate/Severe: 5-15, Minor: 1-4, and No Symptoms of Stroke: 0 (Jauch et al, 2013).
Each patient had a CT scan of the brain to rule out intracranial bleeding and identify cerebral infarction, as well as its location and size.
If the CT scan came back negative, it was repeated 72 h later. The lesion size was measured using the formula (0.5 × A × B × C), where (A) and (B) are the biggest perpendicular diameters measured on CT, and (C) is the thickness of the slice (10 mm) (Castillo et al, 1997).
All the patients had their fasting blood glucose (FBG), hemoglobin A1c (HbA1C), and lipid profile (total cholesterol, triglycerides [TGs]) tested using Cobas 8000 system device (Roche Diagnostics GmbH, Mannheim, Germany).
Five milliliters peripheral blood samples was collected from each participant into ethylenediaminetetraacetic acid-containing tube. Patients with AIS had their samples taken within 24 h of their hospitalization. At 4°C, blood samples were centrifuged for 10 min at 1600 × g. The supernatants were then separated and centrifuged for 10 min at 4°C at 12,000 × g. The separated plasma was also collected and kept at a temperature of −80°C until analysis.
Enzyme-linked immunosorbent assay
Measurement of TNF-α:
Tumor necrosis factor alpha (TNF-α) was measured using the Human TNF-α enzyme-linked immunosorbent assay (ELISA) kit (Invitrogen; KHC3011).
TNF-α kit is designed to measure the amount of the target bound between a matched antibody pair. A target-specific antibody has been precoated in the wells of the supplied microplate.
Measurement of the C-reactive protein (CRP):
The CRP assay was done using CRP (Human) ELISA kit (Abnova, KA3148). This assay is designed to detect and quantify the level of human CRP in serum and plasma. The assay recognizes both natural and recombinant human CRP.
Both ELISA kits use the Sandwich-ELISA principle. The samples were serum. Serum samples and standards were added to the 96-well plates. Samples, standards, and controls were bound to the immobilized antibody. After incubation, the wells were washed to remove unbound material. The sandwich was formed by the addition of detector antibody, a substrate solution, and TMB substrate (tetramethylbenzidine, TMB) was added that reacted with the enzyme-antibody-target complex to produce measurable signal. The intensity of this signal was directly proportional to the concentration of target present in each sample. A curve-fitting software was used to generate the standard curve, which was finally used to determine the samples concentration.
lncRNAs NEAT1 and miR-124 detection
Real-time quantitative polymerase chain reaction was used to detect the lncRNA NEAT1 and miR124 relative expression in the plasma from all the study groups (real-time reverse transcription-quantitative polymerase chain reaction [RT-qPCR]).
Extraction of total RNA was done using Invitrogen's TRIzol Reagent. This reagent extracts high-quality intact RNA from any biological sample. A Nano Drop 1000 spectrophotometer was used to measure the concentration of total RNA (Thermo Scientific, Utah) and detect the purity at OD260/280. A ratio from 1.7 to 2.0 is generally accepted as “pure RNA.”
The PrimeScript RT reagent Kit was used to convert RNA to cDNA (Takara). The qPCR process was then carried out using the QuantiNova SYBR Green PCR Kit (Qiagen) (Li et al, 2020). For NEAT1, GAPDH is used as an internal control reference, while for microRNA (miRNA), U6 is used as an internal control reference.
The reaction was formed of 25 μL amplification mixtures containing Power SYBR Green PCR Master Mix (Qiagen, Clifton Hill, Victoria, Australia), 8 ng of cDNA, and 300 nM primers.
The primer sequences used in qPCR were as follows:
LncRNA NEAT1, forward primer: (TGTCCCTCGGCTATGTCAGA), and reverse primer: (GA GGGGACGTGTTTCCTGAG). miRNA-124, forward primer: (ACACTCC AGCTGGGCGTGTTCACAGCGGACCT) and reverse primer: (TGTCGTGGA GTCGGCAATTC). GAPDH, forward primer: (TGACCACAGTCCATGCCATCAC), and Reverse primer: (GC CTGCTTCACCACCTTCTTGA). U6, forward primer: (CTCGCTTCGGC AGCACATATACTA), and reverse primer: (ACGAATTTGCGTGTCATCCTTGC).
The thermal cycling conditions were carried out as follows: first: 95°C for 5 min, 40 cycles of PCR of 95°C for 15 s and next elongation of 60°C for 60 s. Results of RT-qPCR were calculated using 2−△△Ct method (Livak and Schmittgen, 2001). Ct value is defined as the threshold cycle of PCR, at which amplified products were detected. The ΔCT value was determined by the difference between the cycle threshold of target gene and that of reference gene. △△Ct is the difference between ΔCT of treated sample and control sample. This value was used to calculate fold change.
Ethical consideration
The study was authorized by the Medical Ethics Committee, Faculty of Medicine, Zagazig University (ZU-IRB # 5170). Participants' or their closest relative's informed consent was obtained if they were not conscious.
Statistical analysis
SPSS software version 24.0 (IBM) was used to analyze the data. Microsoft Excel spreadsheet software (Microsoft 365) was used to display the figures. Continuous variables are presented as mean ± standard deviation (SD), while categorical variables were presented as numbers (%). Difference among groups was determined by one-way analysis of variance (ANOVA), Student's t test, and/or chi-square test, whatever was suitable. The Spearman's rank correlation test was used to determine the degree of correlation between variables. To assess the diagnostic value of measured parameters for differentiating different subjects, the receiver operating characteristic (ROC) curve, area under the curve (AUC), and 95% confidence interval (CI) were used. p-Value ≤0.05 was considered statistically significant.
Result
Study groups characteristics (anthropometry and laboratory testing)
The general features of the patients and healthy controls are shown in Table 1. Patients in four groups had similar mean ages and sex distributions (p > 0.05).
Anthropometric and Laboratory Characteristics of the Studied Groups
F: calculated by one way ANOVA, X2: calculated by chi square test.
p: significant ≤0.05.
Significant with AIS group.
Significant with DM group.
Significant with control group.
AIS, acute ischemic stroke; ANOVA, analysis of variance; DM, diabetes mellitus; FBS, fetal bovine serum; HbA1C, hemoglobin A1c; NIHSS, National Institutes of Health Stroke Scale; TG, triglyceride.
DM+AIS patients, as well as DM patients, had significantly higher FBG and HbA1C levels than AIS patients and healthy controls (p = 0.00001 for both). However, HbA1C levels show no significant difference between DM+AIS patients and DM patients.
Patients with DM+AIS, as well as patients with DM, had significantly higher serum cholesterol and TG levels than patients with AIS and healthy controls (p = 0.0001 for both), However, there was no significant difference between DM+AIS patients and DM patients.
ELISA results
Patients with DM+AIS, as well as patients with AIS, had substantially higher CRP and TNF-α levels than patients with DM and healthy controls (p = 0.0001). Their levels in DM+AIS patients were not statistically different from patients with AIS (Fig. 1).
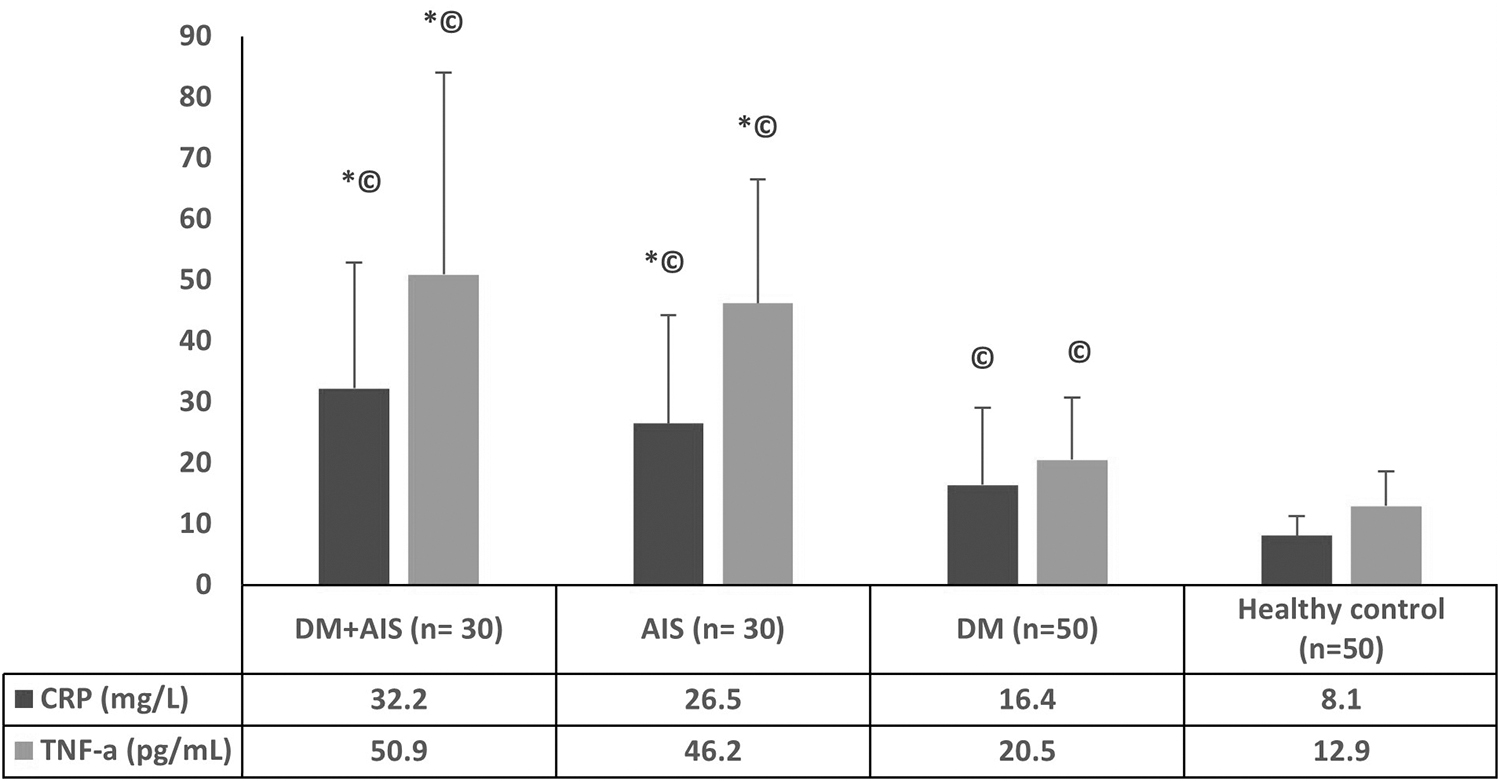
Analysis of CRP and TNF-α levels by ELISA, patients with DM and AIS, as well as patients with AIS, had substantially higher CRP and TNF-α levels than patients with DM and healthy controls (p = 0.0001). #Significant with AIS group, *significant with DM group, ©significant with control group. AIS, acute ischemic stroke; CRP, C reactive protein; DM, diabetes mellitus; ELISA, enzyme linked immunosorbent assay; TNF-α, tumor necrosis factor alpha.
NEAT1 and miRNAs-124 expression in all studied groups
All the groups investigated had substantially different levels of NEAT1 expression (F = 15.1, p = 0.00001). Figure 2 shows that the DM+AIS patients had a greater level of NEAT1 than the AIS patients (p = 0.006) and the control (p = 0.0001). Also, the level of NEAT1 was shown to be greater in AIS group than in control group (p = 0.0006) and greater in DM group when compared with control group (p = 0.0001). However, there is no significant difference between the level of NEAT1 in DM+AIS group and DM group (p = 0.12). Also, there is no significant difference between the level of NEAT1 in AIS group and DM group (p = 0.08).
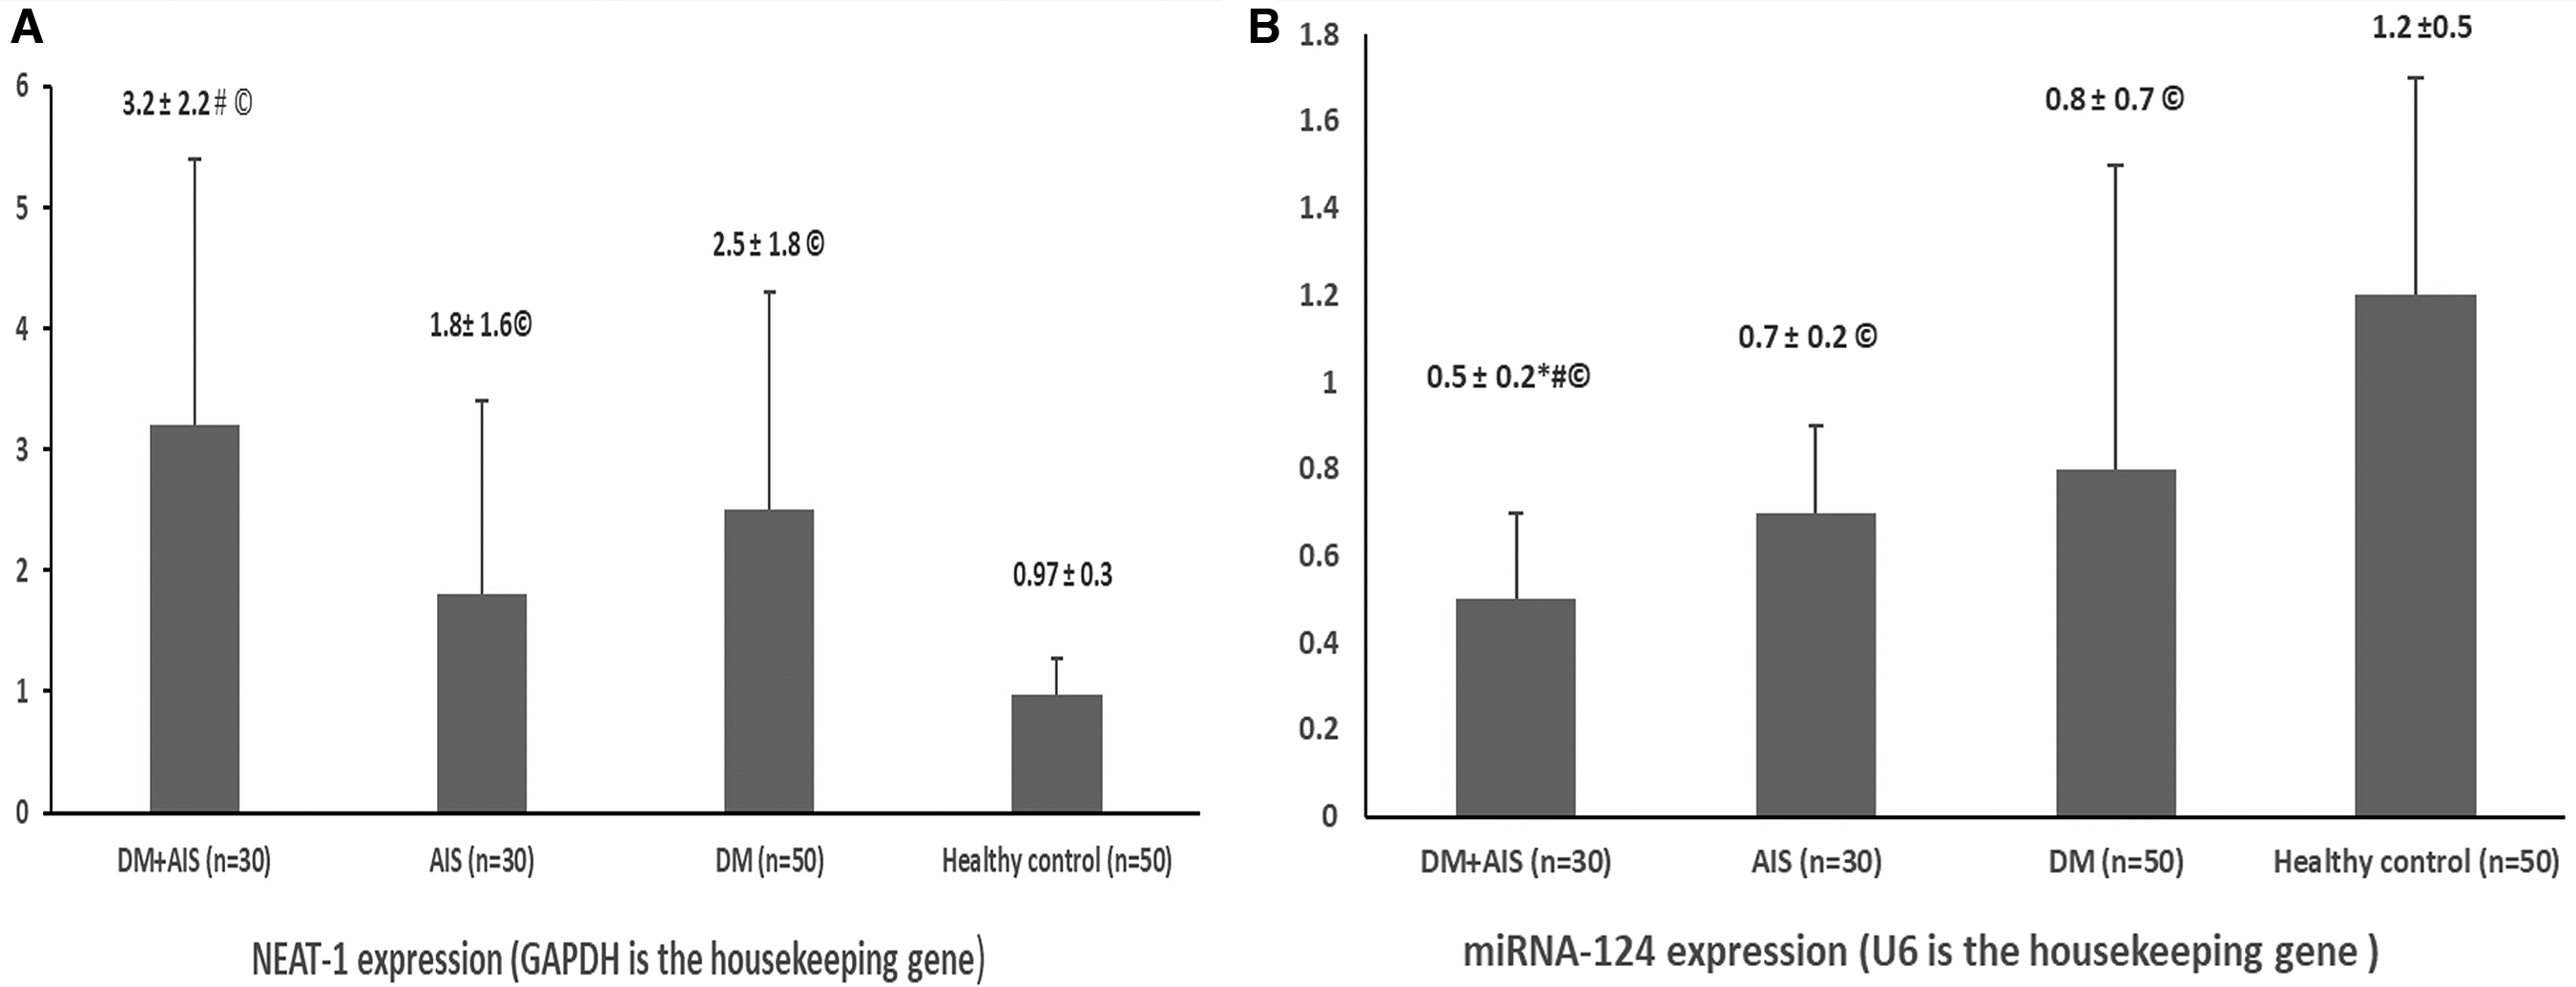
NEAT-1 and miRNA 124 expression level by RT-PCR in all studied groups.
miR-124 expression was found to be considerably reduced in individuals with DM+AIS compared to the AIS (p = 0.002), DM (p = 0.027) and control groups (p = 0.00001) (Fig. 2).
ROC curve investigation of the diagnostic accuracy of NEAT1 expression level in AIS and DM+AIS patients
The lncRNA NEAT1 exhibited a good predictive value for AIS risk (AUC = 0.949) (95% CI: 0.907-0.991) as shown in Figure 3, with the optimum cutoff point value of 1.44 that distinguish AIS patients from control, where the AUC attained the greatest value, and the sensitivity and specificity were 67% and 92%, respectively.

Diagnostic value of lncRNA NEAT1 expression for AIS evaluated by ROC curve.
The lncRNA NEAT1 exhibited a good predictive value for AIS risk in diabetic patients (AUC = 0.715) (95% CI: 0.581-0.849) as shown in Figure 4, with the optimum cutoff point value of 2.1 that distinguish DM+AIS from DM patients, where the AUC attained the greatest value, and the sensitivity and specificity were 76.7% and 62%, respectively.

Diagnostic value of lncRNA NEAT1 expression for diabetic IS evaluated by ROC curve. IS, ischemic stroke.
Correlation between NEAT1 expression level with NIHSS score in AIS groups
The NIHSS score in the DM+AIS group was 12.2 ± 5.2, and 11.7 ± 5.4 in the AIS patients, with nonsignificant difference.
Spearman correlation analysis revealed a link between NEAT1 expression and NIHSS score in DM+AIS patients (r = 0.81, p = 0.0001) (Fig. 5) and in AIS patients (r = 0.78, p = 0.0002) (Fig. 6).
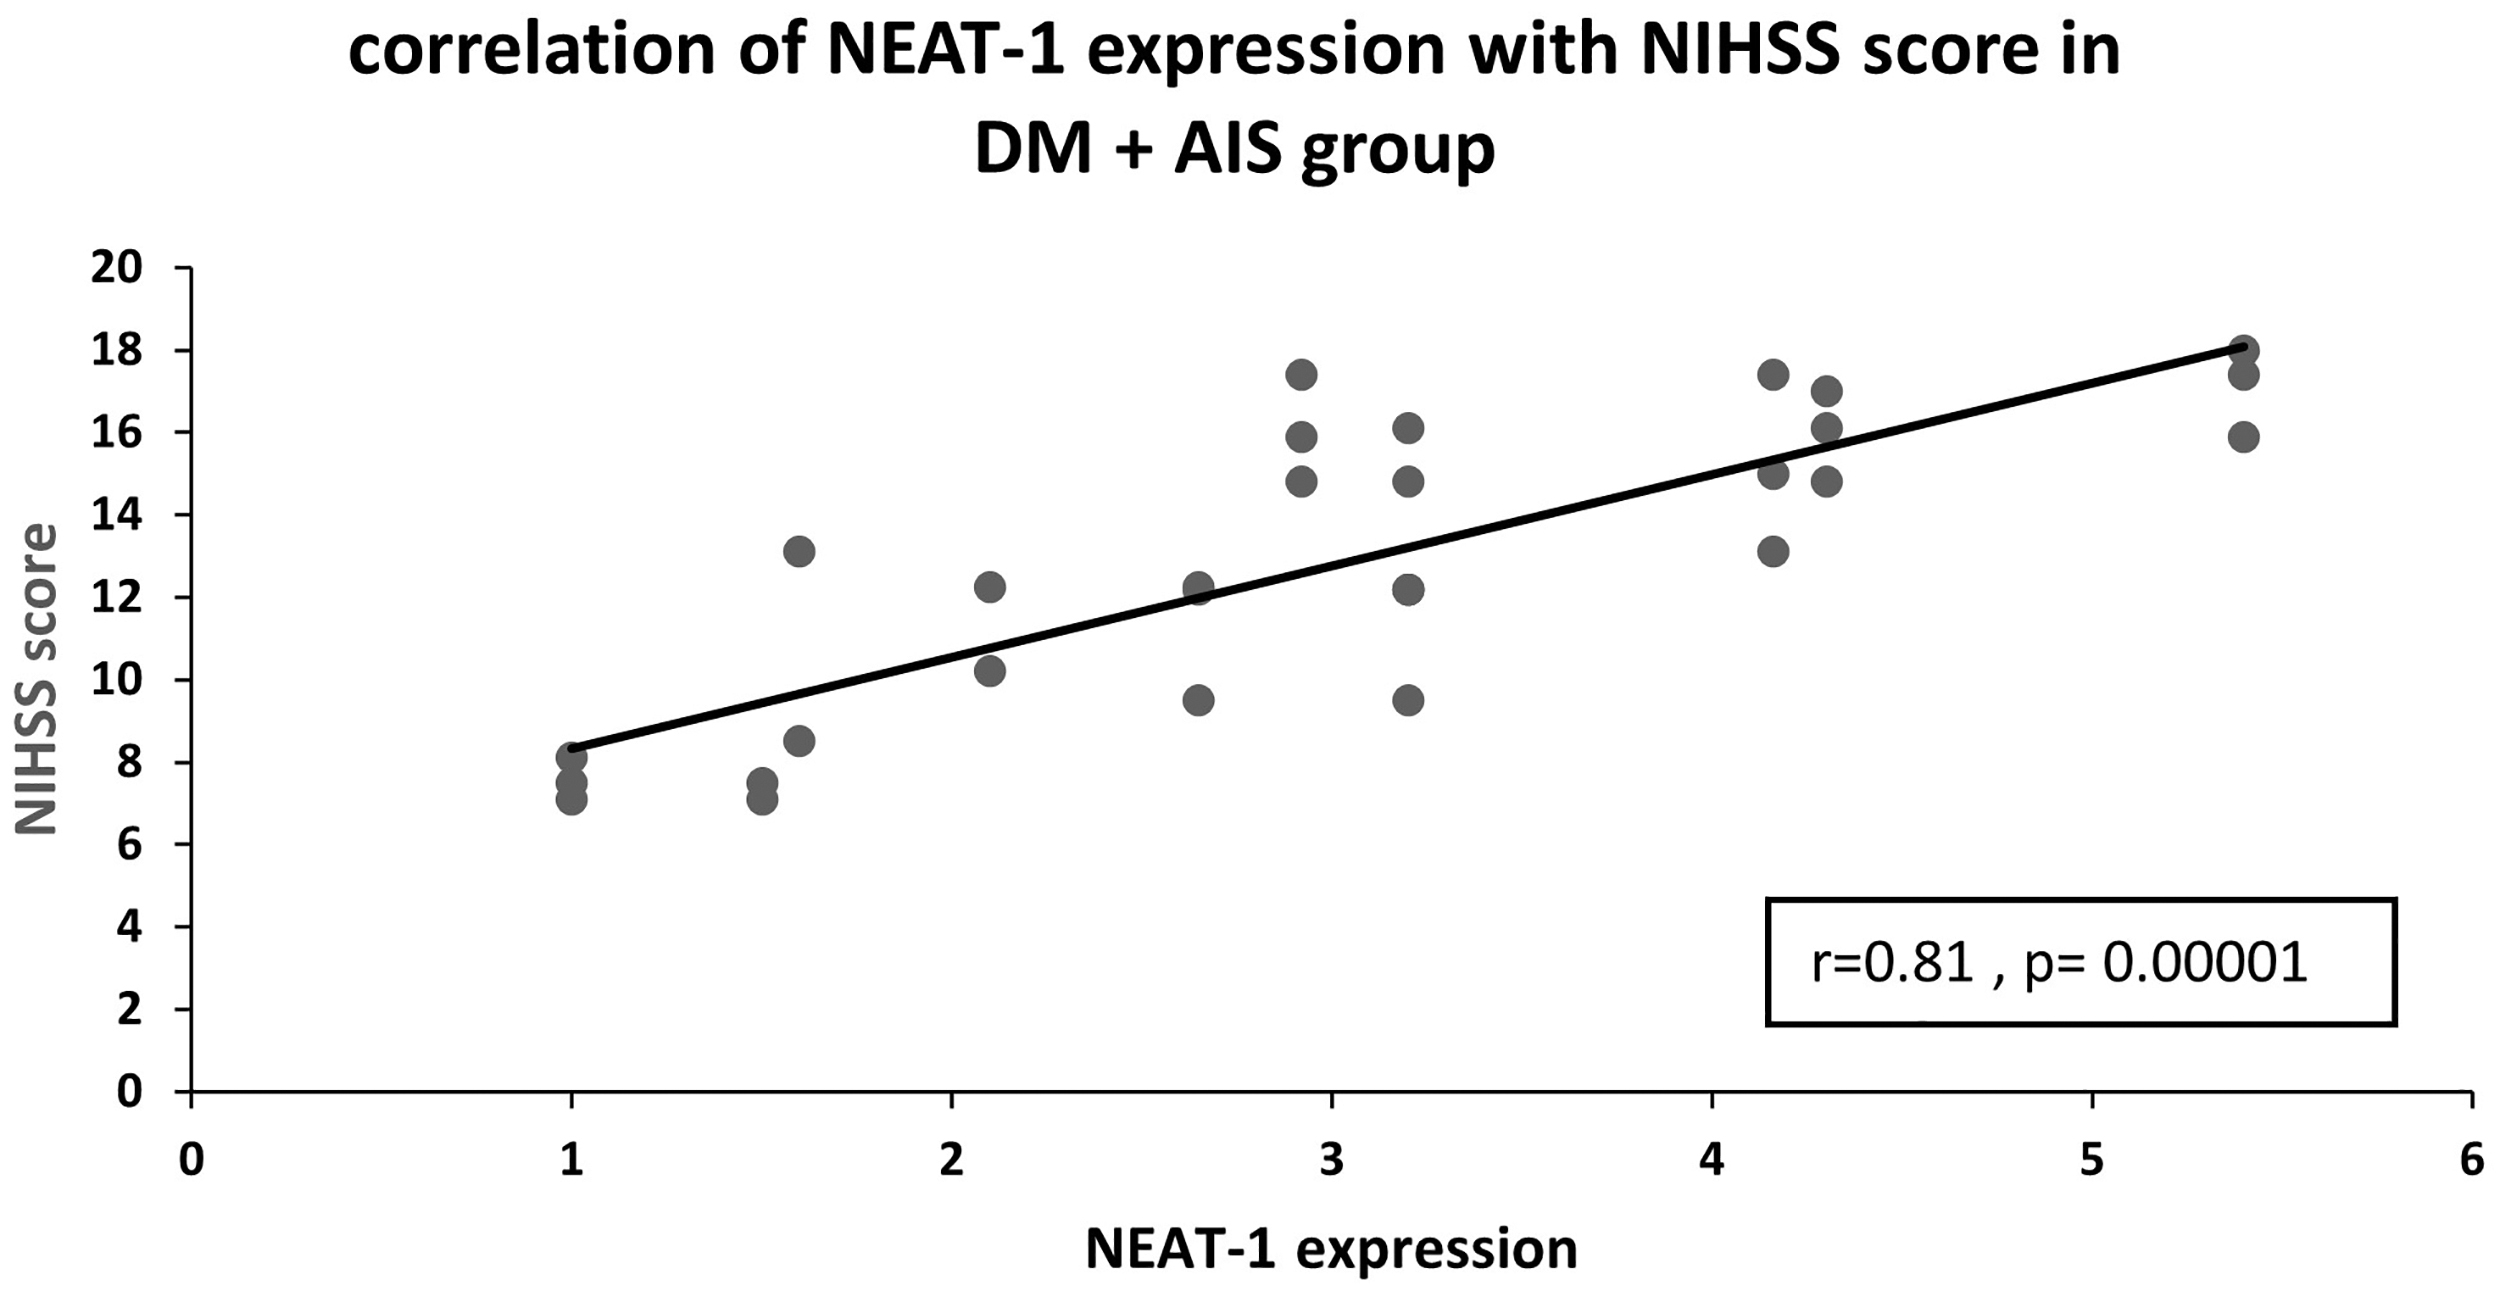
Correlation between NEAT1 expression level with NIHSS score in DM+AIS group. Correlation was determined by Spearman's rank correlation test. NIHSS, National Institute of Health stroke scale.
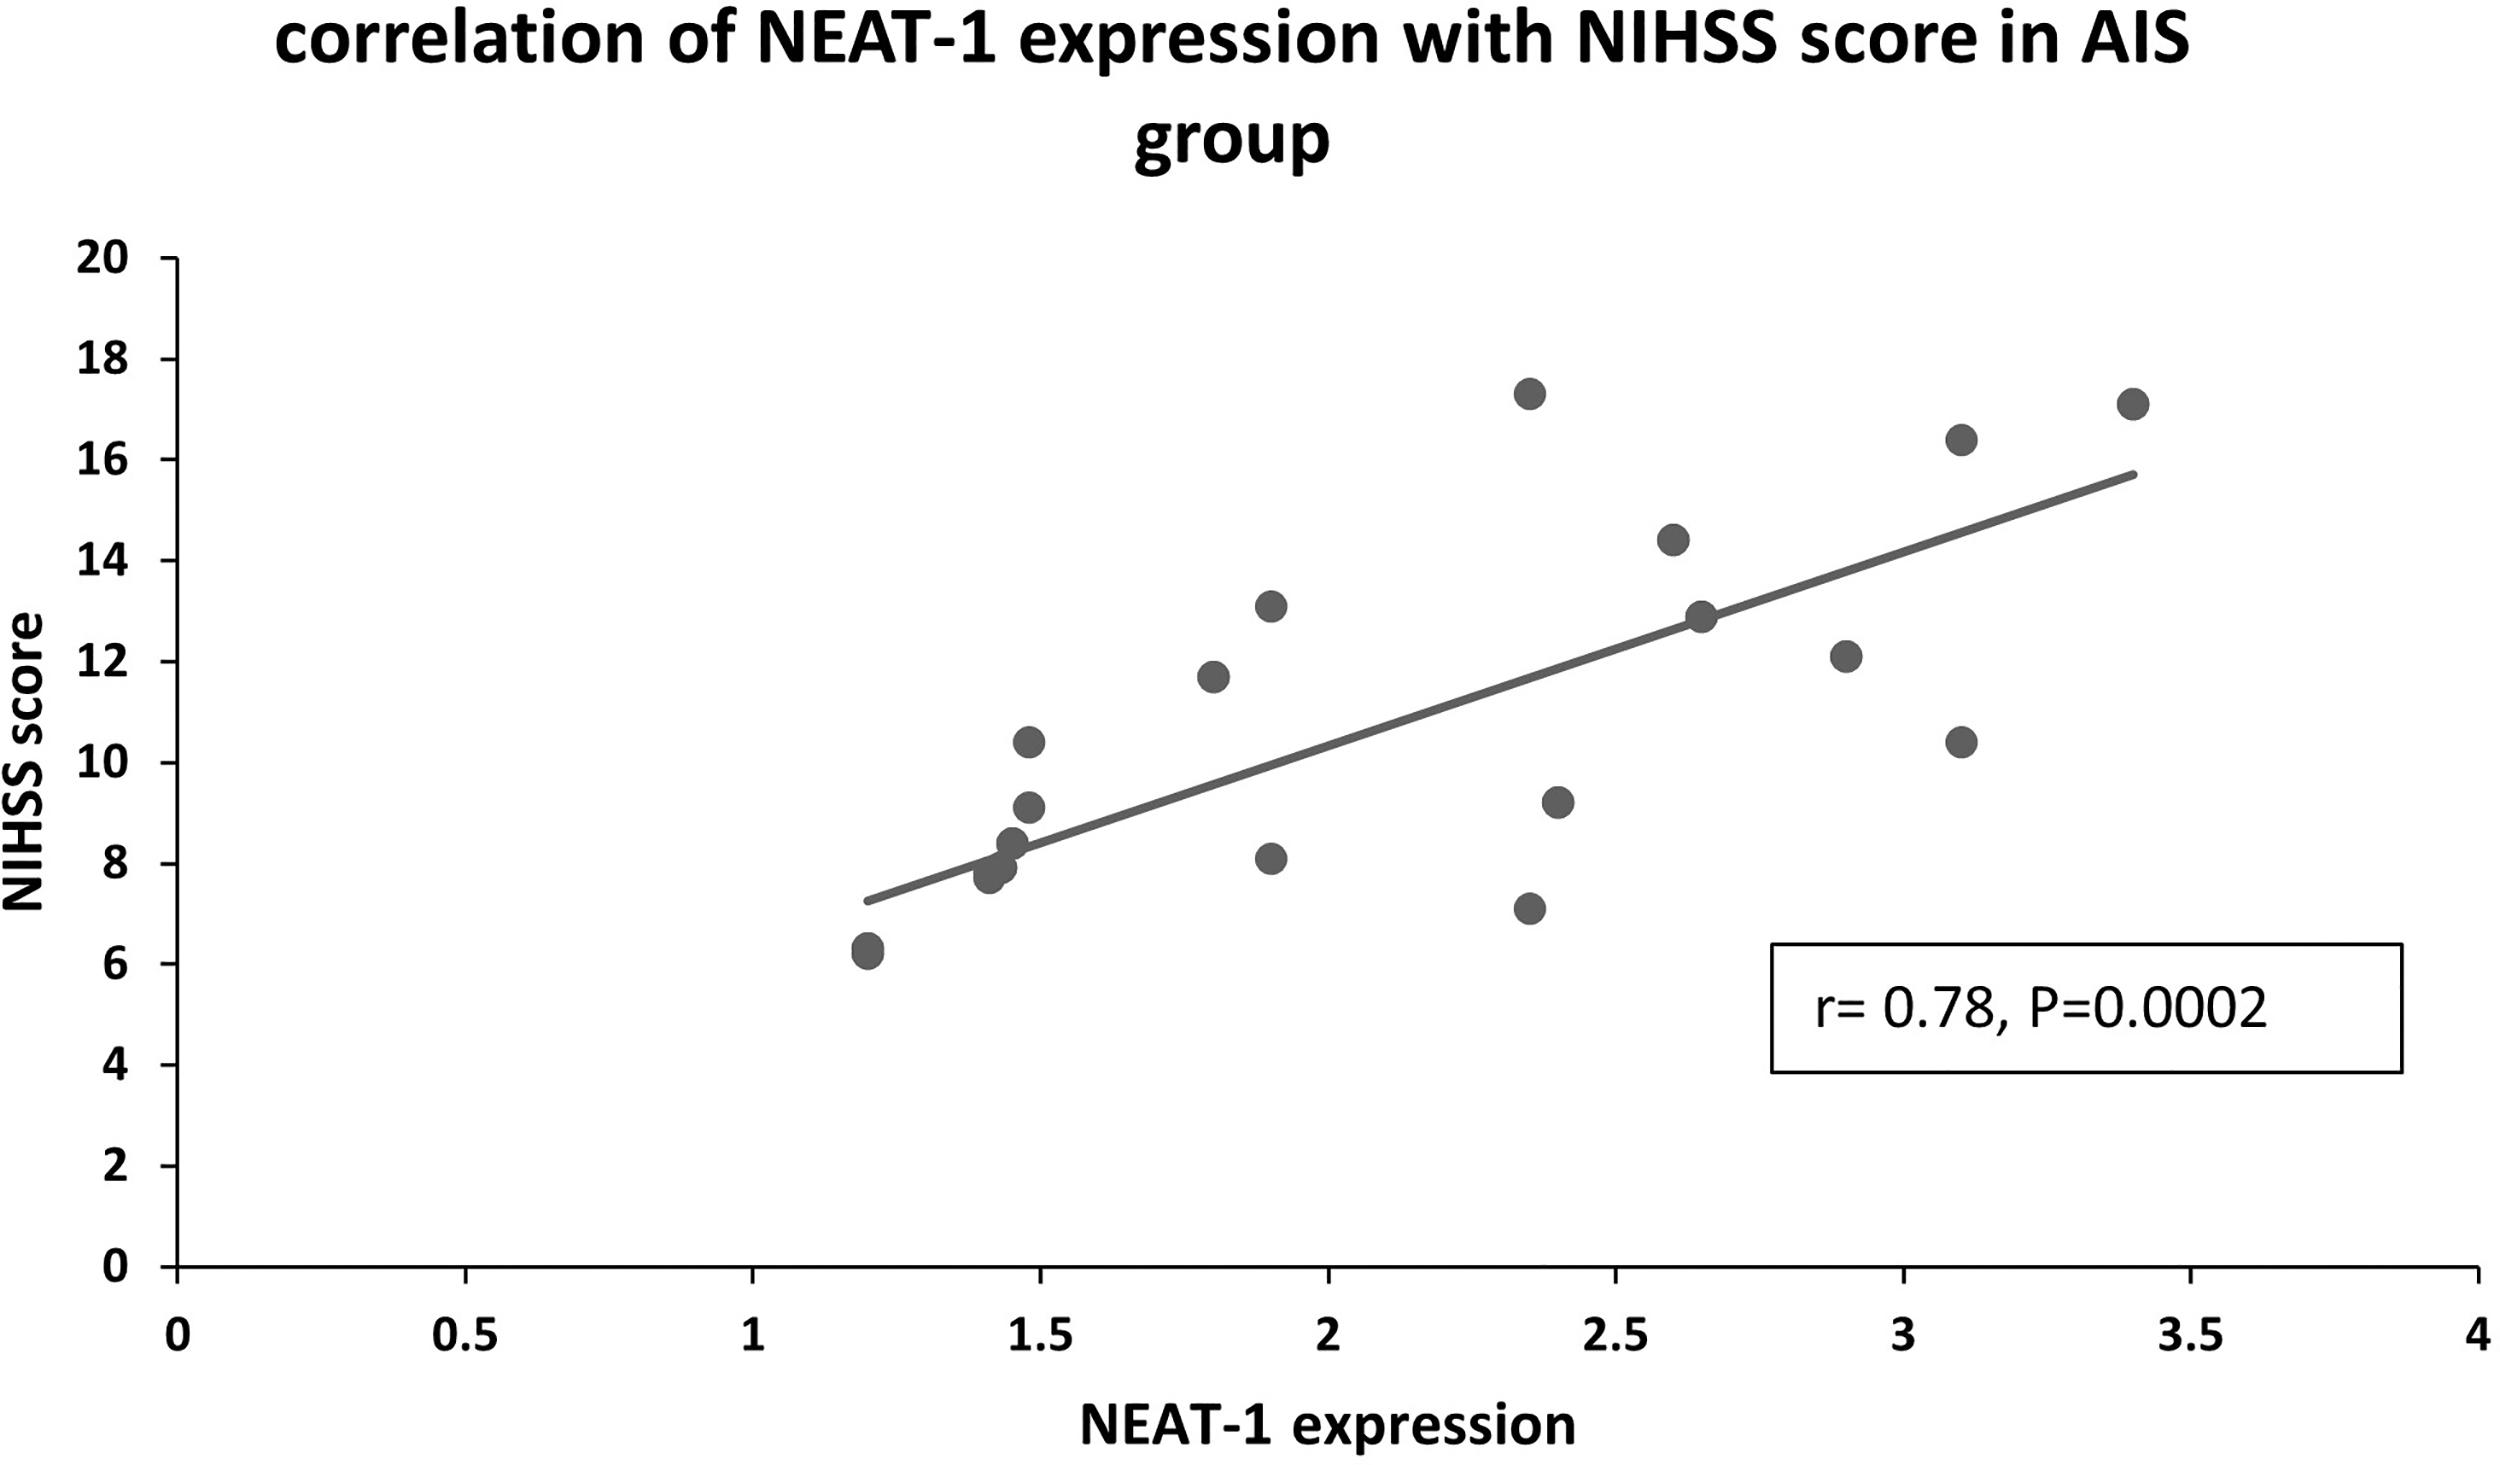
Correlation between NEAT1 expression level with NIHSS score in AIS group. Correlation was determined by Spearman's rank correlation test.
Patient group correlation of NEAT1 with studied parameters
Correlation analysis revealed significant positive correlation between NEAT1 expression and inflammatory markers CRP and TNF-α and significant −ve association with miRNA-124 in patient groups. However, there was no link seen between NEAT1 levels and age, fasting plasma glucose, HbA1C, TG, or total cholesterol (Table 2).
Patient Groups Correlation of Nuclear Enriched Abundant Transcript 1 with Studied Parameters
Significant ≤0.05.
CRP, C reactive protein; TNF-α, tumor necrosis factor alpha.
Discussion
In comparison to nondiabetics, diabetics have increased risk of stroke with a very poor prognosis (Olesen et al, 2019).
miRNAs and lncRNAs have been shown to be important in maintaining homeostasis maintenance via multiple genes regulation, thus they can act as trustable diagnostic and prognostic biomarkers as well as having therapeutic role in DM complications (Jakubik et al, 2021).
The NEAT1 gene encodes the lncRNA NEAT1, which stimulates activation of various inflammasomes in a variety of illnesses, including sepsis, lupus, asthma, and colitis (Li et al, 2020; Klec et al, 2019; Zhang et al, 2019; Zhang et al, 2016).
Given these factors, we built our study to assess the association between one of the lncRNAs, one of its target miRNAs and IS. We chose to assess the association of NEAT1 expression levels and its target miRNA-124 with IS in T2DM patients and whether it might be used as a diagnostic sign for AIS in diabetes patients.
The expression of lncRNA NEAT1 was shown to be greater in DM+AIS patients when compared with AIS group, and with control group in our study. Also, the level of NEAT1 was shown to be greater in AIS group than in control group and greater in DM group when compared with control group. This indicates that diabetes mellitus and ischemia together raised the level of NEAT1.
Previous studies revealed overexpression of lncRNA NEAT1 in diabetes mellitus and diabetic complications. In line with our results, a human study by Alfai et al (2021) revealed elevated circulating NEAT1 expression in T2DM patients and their expression level was linked with poor patient outcomes and could lead to other diabetic complications. Also, Asadi et al (2021) demonstrated that dysregulated NEAT1 expression, related miRNAs and genes might be involved in the pathogenesis of diabetic neuropathy.
Huang, et al (2019) in their experimental study revealed that in diabetic rats and glucose-induced mesangial cells, NEAT1 levels were considerably higher. Also, NETA1 knockdown could reduce renal injury in DM rats in an obvious manner. They added that NEAT1 attributed to the progression of diabetic nephropathy via activation of Akt/mTOR signaling.
Moreover, Ma et al (2019) reported that overexpression of the lncRNA NEAT1 was associated with high glucose levels concluding that NEAT1 was overexpressed in diabetic nephropathy.
When compared to the control group, the level of NEAT1 in the AIS group was considerably higher. NEAT1 expression was found to be linked with risk of AIS (AUC = 0.949) using ROC curve analysis, and optimal cutoff point value of 1.44 was reported (Fig. 3) that distinguish AIS patients from control.
Li et al (2020), reported similar findings, claiming that lncRNA NEAT1 might be used as a new biomarker to predict greater AIS risk and contribute to inflammation level, illness severity, and prognosis in such disease.
The involvement of lncRNA NEAT1 in cerebrovascular and cardiovascular illnesses has been established in previous experimental research by Du et al (2019), Ren et al (2019), and Wang et al (2019). NEAT1 promotes inflammatory responses in cardiac ischemia/reperfusion (I/R) injury animal models, and lncRNA NEAT1 knockdown inhibits atherosclerosis complications in vitro.
Furthermore, Han and Zhou (2019) and Zhou et al (2019) explained the implication of NEAT1 in IS, revealing that NEAT1 facilitates OGD/R injury and inflammation of microglia cells. NEAT1 also regulates the vascular smooth muscle cells phenotypic conversion, as well as epithelial cell death, resulting in intima thickening or vascular blockage. They concluded that lncRNA NEAT1 could be used as a promising therapeutic tool for IS.
According to Dua et al (2019), lncRNA NEAT1 may increase levels of reactive oxygen species, disrupting the typical start of inflammatory pathways, resulting in more formation of inflammatory cytokines, and thus higher inflammatory factors levels (including CRP, TNF-α, IL6, IL8, and IL22) and lower levels of anti-inflammatory cytokines in patients with AIS.
Interestingly, our study is the first to examine NEAT1 expression in Diabetic stroke patients. We showed that NEAT1 has a good predictive value for risk of AIS in diabetic patients using ROC curve analysis (AUC = 0.715), with a value of 2.1 as the optimal cutoff point. This indicated that NEAT1 could distinguish DM + AIS from DM only patients and showed the importance of NEAT1 expression as diagnostic marker of stroke in diabetic patients.
We looked at the relationship between NEAT1 and NIHSS score in both the DM+AIS and AIS groups using correlation analysis. A significant positive association has been observed between the level of NEAT1 and NIHSS score in DM+AIS group (Fig. 5) and in AIS group (Fig. 6).
Han and Zhou (2019) found similar results, suggesting that the lncRNA NEAT1 may exacerbate the microglial cells dysfunction in the brain via the Wnt/β-catenin pathway, as a result, this hampered normal cerebrovascular physiology, resulting in worsened disease severity and, as a result, a higher NIHSS score.
Furthermore, Nishimoto et al (2013) found that lncRNA NEAT1 could cause motor neuron death, leading to a terrible neurodegenerative illness, worsening the aberrant cognitive impairments and the functional activities of AIS patients, and raising NIHSS score.
Zhou et al (2019) discovered that lncRNA NEAT1 enhanced vascular intima thickening or blockage by influencing the vascular smooth muscle cells phenotypic conversion, as well as excessive apoptosis of epithelial cells, which may aggravate the severity of AIS.
Furthermore, miRNAs are a type of short noncoding RNAs, and previous work has shown that NEAT1 and miR-124 interact via a competitive endogenous RNA regulatory network (Cheng and Guo, 2017).
The role of miR-124 in inflammation has been studied extensively. miR-124 is a key regulator of anti-inflammatory reactions through limiting the formation of proinflammatory cytokines such as TNFα and IL6 (Yu et al, 2008). Activated microglia downregulate miR-124 expression in vitro, and miR-124 levels in the CNS are negatively related to microglial activity and macrophages (Ponomarev et al, 2011). Inflammatory neurons are also desensitized by miR-124, which enhances neuron-microglia contact (Hartmann et al, 2015).
In this study, miR-124 was downregulated in DM+AIS group and in AIS group in comparison with control group. Furthermore, in patient groups, NEAT1 expression was adversely linked with miR-124 expression (Table 2). We also discovered that high levels of the lncRNA NEAT1 were linked to elevated CRP levels and proinflammatory cytokines TNF-α levels in patients (Table 2). These findings suggested that NEAT1 may influence the incidence, severity, inflammation amount, and prognosis of AIS by negatively affecting miR124.
Zhao et al (2019) revealed that both bioinformatics prediction and experimental confirmation revealed that the lncRNA NEAT1 served as a guide for miR-124 via a specific binding site. They also discovered that overexpression of NEAT1 could suppress miR-124 expression, whereas knockdown of NEAT1 resulted in high miR-124 expression.
Hamzei et al (2016) showed that miR-124 injection boosted survival of neurons and the amount of M2-like polarized microglia/macrophages, which is consistent with our findings. miR-124 also decreased symptoms of experimental autoimmune encephalomyelitis and CNS leukocyte infiltration, according to Ponomarev et al (2011).
Morris et al (2015) observed that the deletion of miR-124 reduced the number of oligodendrocyte cells and the myelination of axonal projections in the ventral hindbrain. Moreover, Sun et al (2013) found that intravenous injection of miR-124 increased expression in the brains of stroke-affected mice, and that miR-124 dramatically reduces infarct volume, prompting late apoptosis.
The most important limitations of our study was the small sample size. As this was the first study on NEAT1 expression in DM+AIS patients and only a few supportive studies had been conducted, it is highly recommended that this study be repeated in a larger number of patients to confirm the findings.
In conclusion, when compared to AIS alone patients, and the control group, NEAT1 was overexpressed in DM+AIS patients. The lncRNA NEAT1 was found to have a high predictive value for AIS risk in diabetic patients. As a result, NEAT1 expression could be used as a stroke diagnostic marker in diabetes individuals. In comparison to the control group, miR-124 was downregulated in the DM+AIS and AIS groups. Thus, via modulating miR124, lncRNA NEAT1 may influence the prevalence, severity, and prognosis of AIS.
Footnotes
Acknowledgment
Thanks to Zagazig University and all our patients.
Authors' Contributions
R.A.K.: review and editing (equal), conceptualization (lead), writing—original draft (equal), and methodology (lead). M.M.A.: review and editing (equal), writing—original draft (equal), diagnosis, and selection of cases (lead). H.E.Z.: review and editing (equal), conceptualization (supporting), writing—original draft (equal), and methodology (supporting).
Author Disclosure Statement
No competing financial interests exist.
Funding Information
No funding was received for this article.