




Abstract
Background:
The increasing prevalence of non-alcoholic fatty liver disease (NAFLD) has become a global health problem. NAFLD has few initial symptoms and may be difficult to detect early, so there is need for a minimally invasive early detection marker. We hypothesized that miR-122 and miR-20a levels combined, as the miR-122/miR-20a ratio might detect NAFLD more sensitively.
Methods:
This study involved 167 participants with low alcohol intake. Those who had an increase in echogenicity of the liver parenchyma and hepato-renal contrast on ultrasonography were classified as the NAFLD group (n = 44), which was further classified into mild (n = 26) and severe (n = 18) groups based on echogenic intensity and hepatic vessel and diaphragm visualization. Participants without fatty liver were included in the normal group, except for those with an abnormal body mass index, glycated hemoglobin, and systolic blood pressure (n = 123) values. Serum miR-122 and miR-20a expression levels in participants were measured by real-time polymerase chain reaction, and the miR-122/miR-20a was calculated.
Results:
In the NAFLD group, miR-122 expression was significantly higher and the miR-20a was significantly lower than in the normal group, in agreement with previous studies. miR-122/miR-20a was also significantly higher in the NAFLD group. Receiver operating characteristic curve analysis was performed with miR-122/miR-20a as an NAFLD detection marker, and the area under the curve of miR-122/miR-20a was significantly larger than that of miR-122 or miR-20a alone.
Conclusions:
The miR-122/miR-20a ratio, combined with miR-122 and miR-20a levels, is a useful biomarker to detect NAFLD with high sensitivity.
Introduction
Non-alcoholic fatty liver disease (NAFLD) is a general term for fatty liver that is not caused by alcohol intake, viruses, or drugs. The onset of NAFLD is closely related to lifestyle-related diseases such as type 2 diabetes, hyperlipidemia, and obesity (Byrne and Targher, 2015; Cobbina and Aklaghi, 2017). The prevalence of NAFLD is increasing due to the rapid increase in high-calorie and high-fat diets and other lifestyle-related changes, and it now affects 10-30% of adults (Eguchi et al., 2012; Hamaguchi et al., 2005; Yunossi et al., 2016).
NAFLD is broadly divided into non-progressive simple fatty liver (NAFL) and non-alcoholic steatohepatitis (NASH), which presents with inflammation of the liver parenchyma, fat accumulation, and fibrosis in addition to fatty liver. NASH is a progressive lesion that can develop into cirrhosis and liver cancer (Bedossa et al., 2014).
Previously, NAFL and NASH were considered to be different pathological conditions, but in recent years, cases of progression from NAFL to NASH have been observed, and it is now thought that they are different phases of the same disease group (Tokushige et al., 2021).
Interventions such as lifestyle changes before progressing to NASH are important to reduce the risk of aggravation. However, both NAFL and NASH have no subjective symptoms in many cases until they progress to liver cirrhosis or liver cancer, and early detection is difficult. NAFLD/NASH does not currently have a specific blood diagnostic marker, and there are many cases in which transaminase, which is often used in the diagnosis of liver damage, shows normal values.
Liver biopsy is used for definitive diagnosis, but it is highly invasive and cannot be easily performed. Therefore, there is need for a diagnostic marker for NAFLD that is less invasive and can be easily detected even in mild cases.
Micro-RNA (miRNA) is a type of non-coding RNA of about 20-25 bases. miRNAs regulate protein expression by complementary binding to the 3′-untranslated region of target mRNAs, destabilizing the mRNAs and suppressing translation. In general, a given miRNA targets multiple mRNAs and is involved in protein expression in various regions throughout the body (Ma et al., 2009; O'Brien et al., 2018). An association between miRNAs and various diseases has been reported in recent years (Kim et al., 2021; Schweiger et al., 2021; Wang et al., 2020).
Many studies have been conducted about the relationship between NAFLD and miRNAs. In addition to miR-122, 20a, miR-21, 29, 33, and 34 have also been reported to be previously associated with NAFLD (Gjorgjieva et al., 2019). miR-21 promotes lipid uptake into the liver and is upregulated in liver tissue and plasma in NASH (Becker et al., 2015; Calo et al., 2016).
miR-33 regulates cholesterol and fatty acid metabolism and is upregulated in liver tissue and blood in NAFLD (Auguet et al., 2016; Dávalos et al., 2011; Rayner et al., 2010). miR-34 is upregulated in the plasma and liver of NASH patients, suppressing fatty acid catabolism, and promoting lipid storage (Liu et al., 2018; Xu et al., 2015).
The expression of miR-29 is elevated in the blood of NAFLD patients, and this miRNA attenuates insulin signaling and reduces glucose uptake (Jampoka et al., 2018; Massart et al., 2017). miR-122 is the most abundantly expressed miRNA in liver, accounting for ∼50% in humans (Girard et al., 2008; Lagos-Quintana et al., 2002).
It works in conjunction with liver-enriched transcription factors to regulate liver development, differentiation, and homeostasis (Laudadio et al., 2012; Xu et al., 2010). Due to its importance, studies on the relationship between miR-122, liver function, and liver disease have attracted much interest, and many reports have been published to date. miR-122 regulates the expression of genes involved in hepatic fatty acid metabolism and cholesterol synthesis (Esau et al., 2006).
The association with NAFLD has also been clarified, and miR-122 in the blood increases in NAFLD patients (Jampoka et al., 2018). miR-20a regulates p53 and PTEN by targeting p63 in the liver, thus regulating glycogen synthesis and the AKT/GSK pathway (Fang et al., 2016). miR-20a is associated with hepatocellular carcinoma and liver inflammation (Appourchaux et al., 2016; Fahim et al., 2019; Fan et al., 2013).
In NAFLD, miR-20a has been reported to be decreased, and upregulation of miR-20a targets CD36 to show the inhibitory effect of NAFLD (Wang et al., 2020). Since abnormal glucose metabolism is an important factor in the onset of NAFLD, miR-20a expression level analysis in NAFLD patients is of great significance. Previous studies by our laboratory targeting the same population as this study have revealed that miR-122 is increased and miR-20a is decreased in the blood of NAFLD patients (Ando et al., 2019; Yamada et al., 2013).
Focusing on two types of miRNAs that have been observed to fluctuate in our previous studies, we aim at comparing the efficacy of miRNA alone and miR-122/20a as NAFLD biomarkers in the same region population.
In this study, we propose a method of using the ratio of miR-122, which has attracted attention as a biomarker for liver disease, and miR-20a, which shows the opposite trend as miR-122 in the blood of NAFLD patients (hereafter referred to as “miR-122/20a”). In recent years, attempts have been made to apply them as biomarkers that are capable of detecting pathological conditions more sensitively by combining a plurality of miRNAs (Ashirbekov et al., 2020; Huang et al., 2010).
miR-122 is most highly expressed in the liver, plays an important role in maintaining liver function, and is associated with several liver diseases. miR-20a regulates glucose metabolism in the liver, suggesting its involvement in the pathogenesis of NAFLD.
It also exhibits the opposite variation to miR-122 in NAFLD. These miRNAs have been found to be associated with NAFLD in our previous research on populations in the same region. We analyzed whether the expression ratio of these two miRNAs (miR-122/20a) functions as a more effective biomarker in the control group like the previous study.
Materials and Methods
Study participants
Of the 527 people who underwent a general health examination in Hokkaido, Japan, in 2012, we finally recruited 167, excluding 74 who had alcohol intake exceeding the criterion, 14 who had missing test data, and 272 who had abnormal biochemical data values or plaques on blood vessel walls. The final classification was 123 in the normal group and 44 in the NAFLD group (26 in the mild group, 18 in the severe group).
In the present study, many of the NAFLD group presented with relatively mild symptoms, so we attempted to compare them with a completely healthy group. Therefore, examinees with abnormal values in factors such as lifestyle-related diseases in the biochemical data are excluded. The criteria used to determine exclusion are explained in the next section. All subjects provided written informed consent. The study protocol was approved by the Ethics Committee of Fujita Health University (Approval No. HM19-091) and complied with guidelines of the Declaration of Helsinki and subsequent amendments.
Participant data
The health status, drinking history, and smoking history of the participants were obtained via a self-administered questionnaire administered with the support of public health nurses during the health examination. Based on each participant's self-reported daily alcohol consumption (amount and type of alcoholic drink) determined from the questionnaire, we calculated the daily rate of ethanol intake.
In this study, we excluded from our analysis men consuming ≥30 g/day and women consuming ≥20 g/day, the threshold values for the definition of NAFLD in the Japanese guidelines (Tokushige et al., 2021). Height, weight, waist circumference, and blood pressure were measured, and body mass index (BMI) was calculated by dividing weight (kg) by the square of the height (m).
Participants who met any of BMI ≥25, glycated hemoglobin (HbA1c) >6.5, systolic blood pressure ≥140, diastolic blood pressure ≥90, HDL-c <40, triglycerides ≥150, or vascular wall plaque formation were excluded from the normal group.
Assessment of hepatic steatosis
Ultrasound examination was performed by any of three certified sonographers (Japan Society of Ultrasonics in Medicine) using a ProSound α7 with UST-9130 convex probe (Hitachi Aloka Medical, Tokyo, Japan). The presence of intrahepatic steatosis was assessed based on the results of ultrasound examination.
Ultrasonography images were independently evaluated by each of the three sonographers and classified into three levels: normal, mild, and severe. Normal was defined as a state in which neither increased echogenicity of the liver parenchyma nor hepato-renal contrast was observed. Mild hepatic steatosis was defined as a slight increase in echogenicity and hepato-renal echo contrast.
Severe hepatic steatosis was defined as a marked increase in liver echogenicity and a poor or lack of visualization of the hepatic vessels and diaphragm. If there were disagreements in the classification among the sonographers, we classified participants based on the diagnosis shared by the majority (i.e., two of three) of the evaluators.
Blood biochemistry
As part of the examinations, a fasting blood sample (no anti-coagulant) was collected from each participant. Following clotting, the samples were centrifuged, and the serum supernatants were collected within 1 h after collection. The resulting serum samples were stored at −80°C until analysis. Blood biochemical parameters were measured using an auto-analyzer (JCS-BM1650; Nihon Denshi, Tokyo, Japan).
Measurement of miRNA expression level
We measured the expression levels of miR-122 and miR-20a in serum by quantitative real-time polymerase chain reaction (qRT-PCR). TRIzol reagent (Invitrogen, Carlsbad, CA) was used to isolate miRNAs from serum. TRIzol reagent and serum were mixed, and 5 μL of 5 nM Syn-cel-miR-39 miRScript miRNA Mimic was added to provide a normalized control; each sample was vortexed immediately. Each sample was added to molecular-grade chloroform (FUJIFILM Wako Pure Chemical Corporation, Osaka, Japan) to separate the aqueous and organic phases; followed by centrifuging at 13,200 g for 15 min at 4°C.
The aqueous phase was immediately transferred to a new 1.5 mL tube, and the TRIzol protocol continued. Isolated total RNA was dissolved in 15 μL of RNase-free water. The reverse transcription reaction system contained 1 μL of miScript Reverse Transcriptase Mix, 4 μL of 5 × miScript HiFlex Buffer, 5 μL of total RNA, and 10 μL of RNase-free water.
Samples were allowed to react at 37°C for 60 min followed by 95°C for 5 min in a 2720 Thermal Cycler (Applied Biosystems, Foster City, CA). The reacted samples were diluted with 380 μL of TE Buffer (10 mM Tris-HCl, pH 8.0; 1 mM EDTA, pH 8.0). qRT-PCR was performed with a miScript System (Qiagen, Valencia, CA) that included specific primers for each miRNA. PCR cycles were completed at 95°C for 15 min, 45 cycles at 94°C for 15 s, 55°C for 30 s, and 70°C for 30 s.
Real-time PCR was performed using an ABI PRISM 7900 Sequence Detection System (Applied Biosystems). The relative expression of each miRNA was calculated using the comparative standard curve method normalized to spiked-in cyn-39 levels. miRNA 120/20a was calculated by dividing the miR-122 expression level by the miR-20a expression level.
Statistical analysis
Statistical analyses were performed using JMP version 14.2.0 software (SAS Institute, Cary, NC) and R version 3.5.0 statistical software (R Foundation for Statistical Computing, Vienna, Austria). Two-tailed Student's t-tests and Dunnett's tests were used for comparisons of continuous variables showing a normal distribution. Wilcoxon rank sum tests and Steel tests were used to compare continuous variables with log-normal distributions.
Receiver operating characteristic (ROC) curve analysis was used to evaluate NAFLD detectability by miRNA. p-Values of <0.05 were considered statistically significant.
Results
Characteristics of the participants
The study participants were divided into a normal group and NAFLD group based on ultrasonography and biochemical data (Table 1). Further, the NAFLD group was divided into a mild group and a severe group according to the degree of fat deposition in the liver.
Characteristics of Participants
Mean ± SD.
Two-tailed Student's t-test.
Tukey-Kramer's honestly significant deference test.
Median (interquartile range).
Wilcoxon rank sum test.
Steel-Dwass test.
γ-GTP, γ-glutamyl transpeptidase; ALT, alanine aminotransferase; AST, aspartate transaminase; BMI, body mass index; DBP, diastolic blood pressure; HbA1c, glycated hemoglobin; HSD, honestly significant deference; NAFLD, non-alcoholic fatty liver disease; SBP, systolic blood pressure; SD, standard deviation; TG, triglyceride.
The characteristics of the participants are shown in Table 1. The proportion of men in the NAFLD group was higher than that in the normal group, and there was no difference in age between the two groups. Significant differences were observed between the normal group and the NAFLD group in terms of BMI, HbA1c, and triglycerides.
Measurement of miRNA expression levels
Table 2 shows the results of correlation analysis between miRNA expression levels and metabolic parameters or drinking/smoking habits. miR-20a was significantly negatively correlated between triglycerides and systolic blood pressure. There was a significant correlation between miR-122/20a and alcohol consumption. Other items did not correlate with each miRNA.
Correlation Analysis of Micro-RNAs with Metabolic Parameters and Drinking/Smoking Habits
Spearman's rank correlation coefficient was used for statistical analysis.
Next, we compared serum levels of miRNAs between the normal and NAFLD groups (Table 3). Compared with the normal group, the expression level of miR-122 in blood was significantly increased in the NAFLD group (fold change: 1.00 vs. 2.34, p = 0.023). In addition, the expression level of miR-20a in blood was significantly decreased as compared with the normal group (fold change: 1.00 vs. 0.33, p = 0.001).
Comparison of Micro-RNA Expression Level
Expression level of miRNA was expressed as a fold change for the Normal group.
Wilcoxon rank sum test and Steel-Dwass test were used for the statistical analysis.
miRNA, micro-RNA.
The changes in these blood miRNA expression levels by NAFLD were consistent with previous studies. By the degree of fat accumulation, the expression level of miR-122 was significantly increased in the severe group (fold change: 3.63, p = 0.003), and that of miR-20a was significantly decreased in the mild group (fold change: 0.28, p = 0.004).
miR-122/20a was significantly increased in the NAFLD group compared with the normal group (fold change: 1.00 vs. 7.20, p < 0.001). In addition, miR-122/20a was increased significantly in both the mild group and the severe groups as defined by the degree of fat accumulation (mild group fold change: 6.57, p = 0.023, severe group fold change: 11.49, p < 0.001).
No significant difference was observed between the mild group and the severe group for miR-122, miR-20a, and miR-122/20a. As in our previous study, the presence of NAFLD increased blood miR-122 expression and decreased miR-20a expression in this study. miR-122/20a, by measuring both miR-122 and miR-20a, was significantly increased in the blood of the NAFLD group.
In addition, logistic regression analysis was performed to identify confounders contributing to changes in miRNA expression levels in the NAFLD group (Table. 4). Logistic regression analysis adjusted for age and sex showed that miR-122/20a was significantly associated with NAFLD (p = 0.003, Model 1).
Logistic Regression Analysis Between Non-Alcoholic Fatty Liver Disease and Each Micro-RNA Expression Level
Adjusted for age and sex.
Adjusted for age, sex, smoking habit, and alcohol intake.
Adjusted for age, sex, smoking habit, alcohol intake, HbA1c, TG, and SBP.
CI, confidence interval.
As a result of the analysis in which drinking and smoking habits were added to the adjustment factors, miR-122/20a and NAFLD showed a significant relationship (p = 0.018, Model 2), and when triglycerides, HbA1c, and systolic blood pressure were added to the adjustment factors, a similar significant relationship was observed (p = 0.022, Model 3). These results showed that the higher miR-122/20a observed in the NAFLD group was an independent factor regardless of other confounding factors.
ROC curve analysis
ROC curve analysis was performed to compare the diagnostic capabilities of each miRNA and miR-122/20a for NAFLD (Fig. 1). As a result of creating an ROC curve with the NAFLD group as positive, the area under the curve (AUC) of miR-122/20a was the largest (miR-122 AUC = 0.615 [0.513-0.718], miR-20a AUC = 0.663 [0.570-0.757], miR-122/20a AUC = 0.709 [0.612-0.807]).
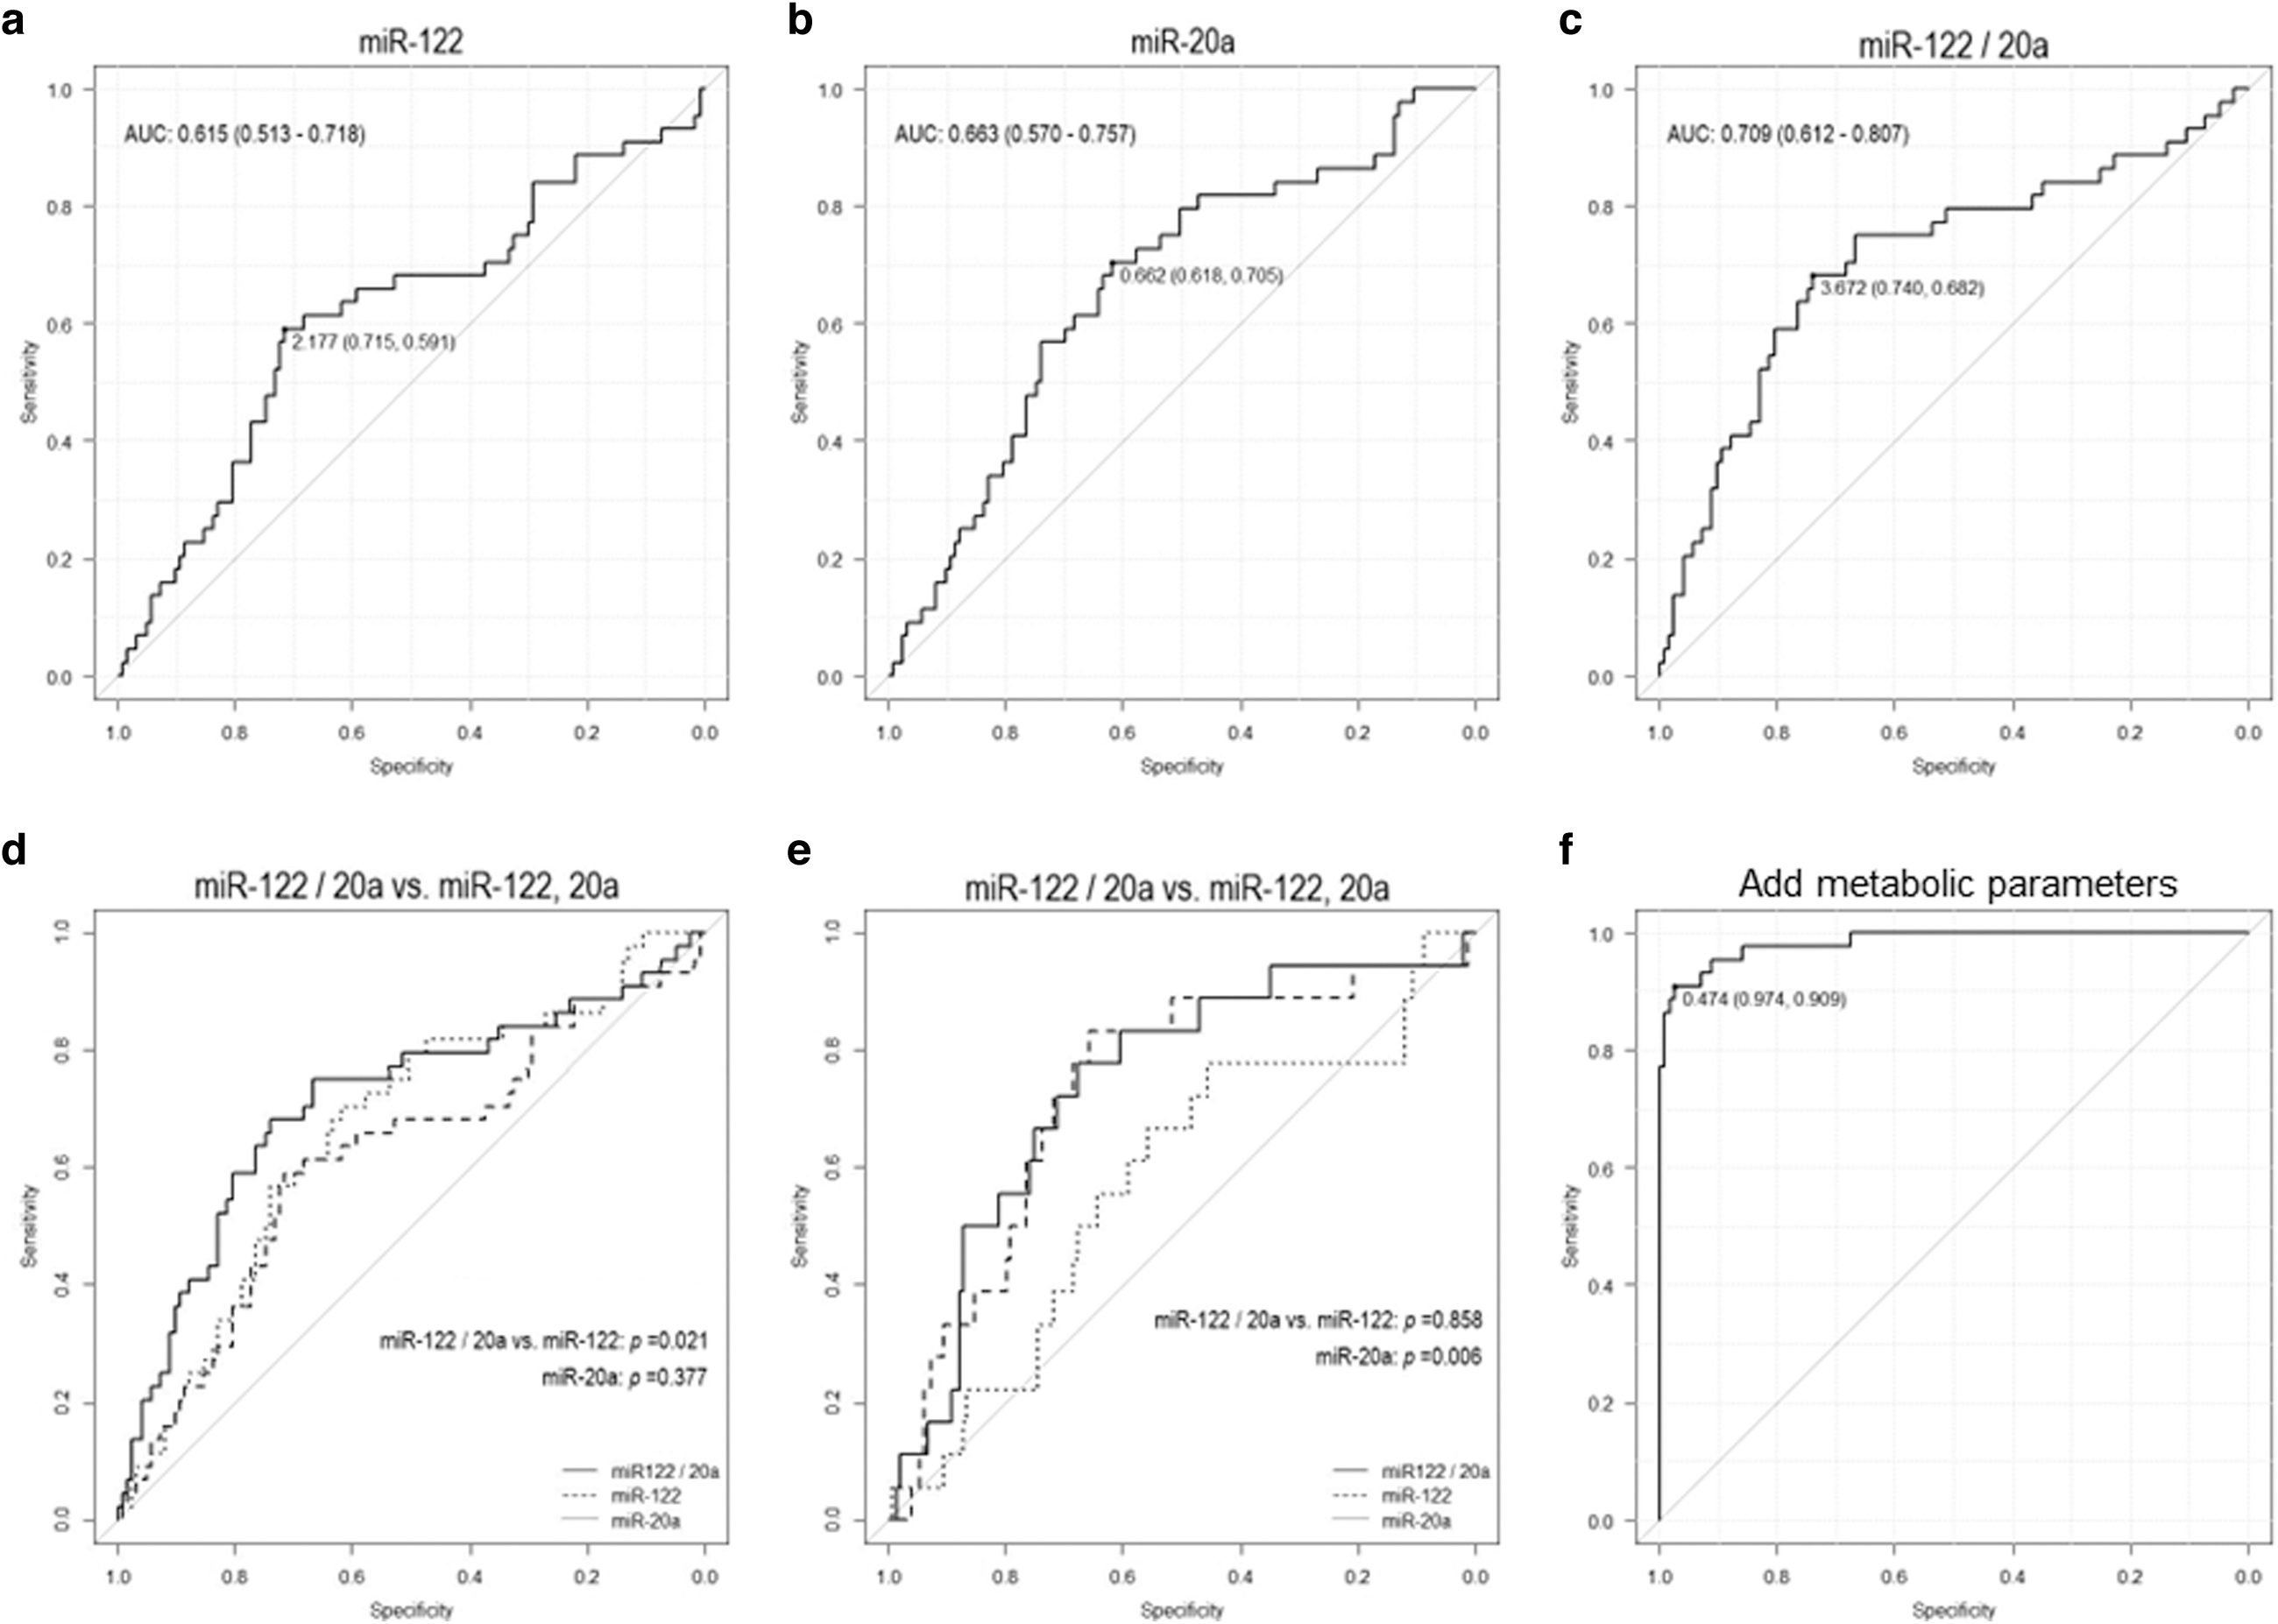
Assessment of NAFLD detection performance of miRNA by ROC curve analysis.
It was also significantly larger than the AUC of miR-122 (p = 0.021). Even when the ROC curve was created with the severe group as positive, the AUC of miR-122/20a was the largest (miR-122 AUC = 0.729 [0.603-0.856], miR-20a AUC = 0.576 [0.433-0.720], miR-122/20a AUC = 0.740 [0.618-0.863]). It was also significantly larger than the AUC of miR-20a (p = 0.006).
In addition, a multivariate ROC curve was created by adding drinking/smoking habits, triglycerides, HbA1c, systolic blood pressure, and miR-122/20a as explanatory variables (Fig. 1f). As a result, confounding factors did not reduce AUC. ROC curve analysis revealed that miR-122 functions as a highly accurate marker for severe NAFLD, and miR-20a also functions as a detectable marker for mild NAFLD.
Discussion
In recent years, there has been increasing interest in the discovery and development of non-invasive blood biomarkers for NAFLD. Circulating miRNAs are stably present in blood and are expected to serve as NAFLD biomarkers. Many studies have focused on the association between NAFLD and miRNAs (Gjorgjieva et al., 2019; Lin et al., 2020; Torres et al., 2018), and previous studies in our laboratory have shown that miR-122 is increased and miR-20a decreased in the blood of NAFLD patients (Ando et al., 2019; Yamada et al., 2013).
Since some previous studies have attempted to combine multiple miRNAs into biomarkers (Porzycki et al., 2018), we examined the feasibility of combining miR-122 and miR-20a as biomarkers, which change in opposite directions by NAFLD. In this study, we calculated the ratio of miR-122 to miR-20a and verified its practicality as a NAFLD biomarker in comparison with each miRNA alone.
As a result, miR-122/20a was significantly increased in both the mild group and the severe group compared with the normal group and had superior detection ability compared with using each miRNA alone. In addition, the maximum AUC was confirmed in ROC curve analysis, suggesting that it is also excellent for NAFLD diagnosis.
In addition, using miR-122/20a does not require a standard miRNA for expression level correction, so there are fewer barriers to its use in clinical practice. This suggests that miR-122/20a is practical as a minimally invasive biomarker for NAFLD.
miR-122 is specifically expressed in the liver (Bandiera et al., 2015), and its relationship with liver disorders such as NAFLD has been actively studied (Sun et al., 2020; Thakral and Ghoshal, 2015). However, it has been found that its expression is increased not only in liver disorders but also by hepatitis C virus infection (Dubin et al., 2014).
An association of miR-20a with NAFLD has also been reported, and there are reports of its involvement in systemic cancers such as hepatocellular carcinoma (Gao et al., 2019; Wen et al., 2015). Since miRNAs have many target genes and can act systemically via various mechanisms, the detection of one type of miRNA may have low disease specificity. Therefore, combining multiple miRNAs as reported here may be more suitable for developing practical biomarkers.
The lack of subjective symptoms is one factor that makes early detection of NAFLD difficult. Therefore, NAFLD is often diagnosed after the symptoms have progressed without patients having undergone ultrasonography or MRI examination. Aspartate transaminase (AST) and alanine aminotransferase (ALT) as measured by blood tests are markers of non-specific liver damage, and there are cases in which AST and ALT are at normal levels even in patients with advanced NAFLD.
In this study, miR-122/20a was significantly increased, even though we employed relatively mildly symptomatic examinees, suggesting that miR-122/20a is useful as a blood biomarker because of its high specificity for NAFLD. Several miRNAs associated with NAFLD and liver disease have been reported.
In this study, the method using the ratio of miRNA expression level was examined in a population like the previous study, with a combination of miRNAs that varied in the previous study. Therefore, the optimal combination as a biomarker has not been verified, and to clarify it, it will be necessary to confirm changes in other miRNAs.
This study is novel in those two types of miRNAs that vary depending on NAFLD were combined and applied as biomarkers. However, there are some limitations in this study. First, this is a cross-sectional study, and the causal relationship between NAFLD and miRNA expression level cannot be clarified. Longitudinal studies may reveal new aspects, such as the prediction of onset by miRNAs and the prediction of poor prognosis.
Second, the number of participants, especially the NAFLD group, was not large. This is because the participants, who were recruited from health examinations in Yakumo city, were in relatively good health. A few people in this population have advanced fatty liver disease, so this study should be considered as having focused on early NAFLD patients.
Third, Fibroscan and MRI examinations were not performed in this study. These tests are used to measure liver cirrhosis due to fibrosis. In this study, NAFLD was defined as the deposition of fat in the liver not caused by alcohol, and the participants were grouped. The Fib-4 index and NAFLD fibrosis score (NFS), which are indicators of liver fibrosis, were calculated for the participants in this study and compared between the normal group and NAFLD group.
No significant difference was observed between the groups for either Fib-4 index or NFS (Supplementary Table S1). Based on the expression levels of miR-122, miR-20a, and 122/20a, we classified the participants into a low expression group and a high expression group and compared the Fib-4 index and NFS between them. No significant difference was found in the Fib-4 index and NFS values between each group (Supplementary Table S2).
In conclusion, the expression level of miR-122 in blood increased and the expression level of miR-20a decreased in the NAFLD group. Moreover, miR-122/20a was significantly increased in both the mild group and the severe group compared with the normal group.
The ROC curve analysis showed that the AUC of miR-122/20a was larger than that of each miRNA alone, suggesting that miR-122/20a is useful as a diagnostic and early detection marker for NAFLD. Further longitudinal studies are needed to further verify the function of miR-122/20a as an NAFLD biomarker.
Footnotes
Acknowledgment
The authors thank the participants, and the staff of the Health Examination Program for Residents of Yakumo, Hokkaido, Japan.
Authors' Contributions
Y.H.: Writing—original draft; Formal analysis (equal); Methodology (equal); and Conceptualization (equal). H.Y.: Conceptualization (equal); Investigation (equal). E.M.: Conceptualization (equal). R.F.: Investigation (equal); Methodology (equal); and Writing—review and editing (equal). Y.A.: Investigation (equal); Formal analysis (equal). M.Y.: Formal analysis (equal); Investigation (equal). G.M. (equal): Formal analysis (equal); Investigation (equal). Y.T.: Investigation (equal); Methodology (equal); and Writing—review and editing (equal). Y.I.: Writing—review and editing (equal). N.I.: Investigation (equal). K.S.: Investigation (equal). K.O.: Investigation (equal). H.I.: Investigation (equal). K.O.: Investigation (equal). K.S.: Conceptualization (equal); Funding acquisition; Investigation (equal); and Writing—review and editing (equal).
Data Availability Statement
The data that support the findings of this study are available on reasonable request from the corresponding author, K.S. The data are not publicly available due to their containing information that could compromise the privacy of research participants.
Author Disclosure Statement
No competing financial interests exist.
Funding Information
This research was funded by the Ministry of Education, Culture, Sports, Science, and Technology of Japan via Grants-in-Aid for Scientific Research Numbers 26293144, 17K09139, 20K10515, and 16H06277 to K.S. and by a research grant from Fujita Health University (K.S.).

References
Supplementary Material
Please find the following supplemental material available below.
For Open Access articles published under a Creative Commons License, all supplemental material carries the same license as the article it is associated with.
For non-Open Access articles published, all supplemental material carries a non-exclusive license, and permission requests for re-use of supplemental material or any part of supplemental material shall be sent directly to the copyright owner as specified in the copyright notice associated with the article.
