




Abstract
Background:
Studies have shown that the Mitochondrial Transcription Termination Factor 3 (MTERF3) negatively regulates mitochondrial gene expression and energy metabolism, and plays a significant role in many cancer types. Nevertheless, the expression and prognostic role of MTERF3 in patients with thyroid carcinoma (THCA) is still unclear. Thus, we investigated the expression, clinicopathological significance, and prognostic value of MTERF3 in THCA.
Methods:
The protein and mRNA expression levels of MTERF3 were, respectively, analyzed using immunohistochemistry (IHC) from THCA tissues and RNA-Seq data downloaded from The Cancer Genome Atlas. In addition, the relationships among the expression of MTERF3, the stemness feature, the extent of immune infiltration, drug sensitivity, the expression of ferroptosis, and N6-methyladenosine (m6A) methylation regulators, were evaluated as prognostic indicators for patients with THCA using the Kaplan-Meier plotter database.
Results:
The IHC and RNAseq results showed that the protein and mRNA expression levels of MTERF3 in adjacent nontumor tissues were significantly higher than in THCA tissues. The survival analysis indicated that decreased expression of MTERF3 was associated with a poorer prognosis. Furthermore, the expression of MTERF3 not only negatively correlated with the enhancement of the stemness of THCA and the reduction of drug sensitivity but also was implicated in ferroptosis and m6A methylation.
Conclusion:
The data from this study support the hypothesis that decreased expression of MTERF3 in THCA is associated with a poor prognosis.
Introduction
In recent decades, although the morbidity of thyroid carcinoma (THCA) referred to as the most popular malignant tumor in endocrine neoplasm has increased sharply (Sung et al., 2021), the mortality rate of it has been stable in China (Xia et al., 2022). Therefore, some scholars believe that there is overdiagnosis and overtreatment of THCA in clinical application (Roman et al., 2017). In papillary THCA regarded as the most common type in four major pathology types of THCA (Grani et al., 2018), the molecular genetic markers, including B-Raf Proto-Oncogene (BRAF), RAS, Phosphatase and Tensin Homolog (PTEN), and so on, have been widely used in clinical practices (Nikiforov and Nikiforova, 2011), but they still lack specificity and sensitivity and are not effective molecules for evaluating prognosis. Thus, searching for an effective biomarker is an important problem to be solved urgently.
The Mitochondrial Transcription Termination Factor 3 (MTERF3) as a member of the Mitochondrial Transcription Termination Factors (MTERFs) gene family is a negative regulator of the transcription of mitochondrial DNA (mtDNA), a factor associated with oxidative phosphorylation, and an indispensable gene in embryonic development (Park et al., 2007). Besides, overexpression of MTERF3 correlates with the onset and progression of some kinds of carcinomas, including but not limited to, breast cancer, colorectal cancer, and glioma (Liu et al., 2019; Wang et al., 2020; Zi et al., 2019). Importantly, we accidentally found that the expression of MTERF3 in THCA is low and the relationship between it and the prognosis is not reported.
In this study, we aimed to investigate the differences in the expression of MTERF3 in papillary THCA tissues and adjacent nontumor tissues by immunohistochemistry (IHC) protocol, and also analyze the correlations between the MTERF3 expression and factors associated with tumor progression, including stemness features, prognosis, drug susceptibility, and expression of ferroptosis and N6-methyladenosine (m6A) methylation regulators by bioinformatics analysis. We expect these could provide further data support for molecular diagnosis and treatment of THCA. The flowchart of this study was shown in Figure 1.
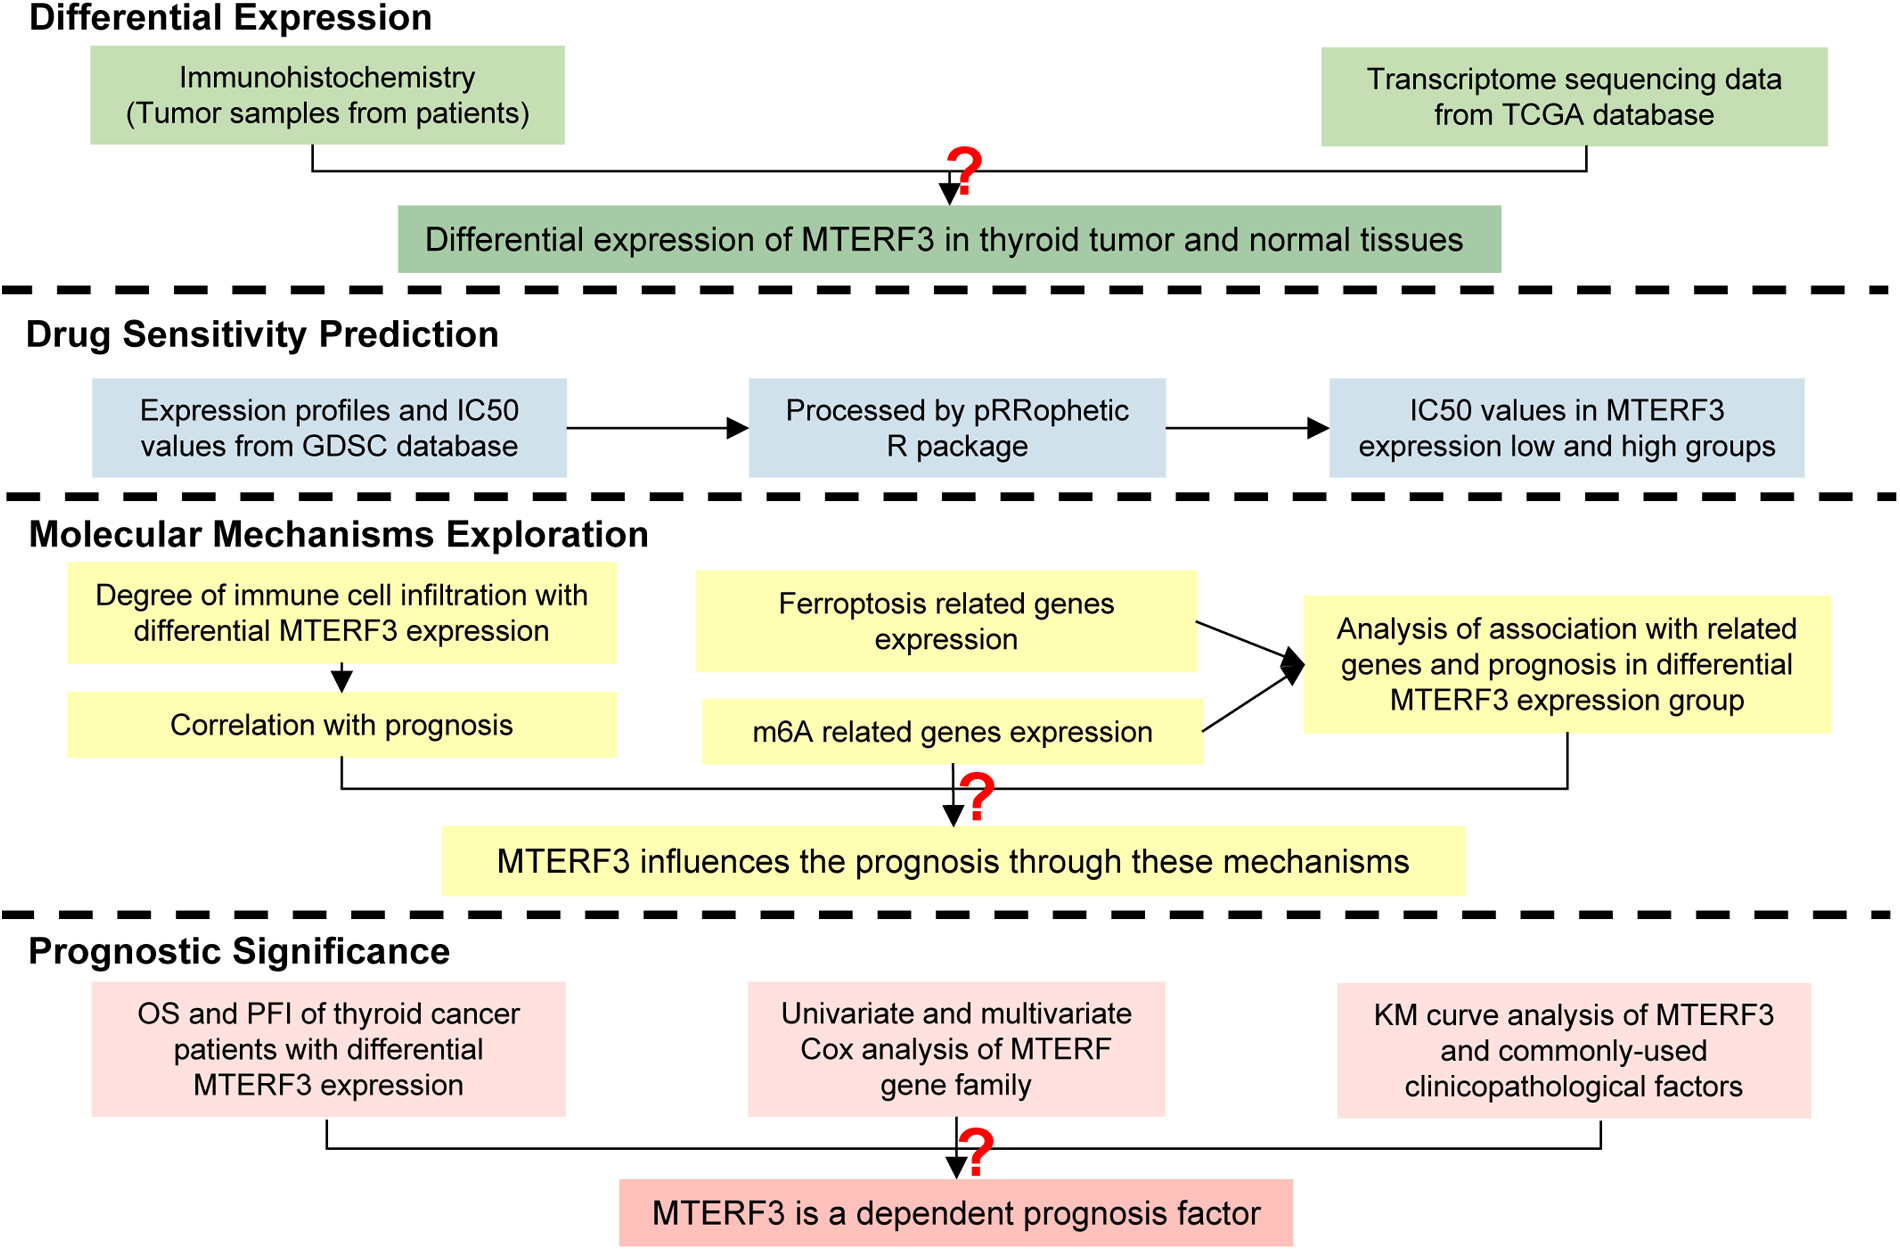
Flowchart of this study.
Materials and Methods
Clinical specimens and data source
THCA samples (n = 50) were collected from the Department of Pathology of Lin'an People's Hospital Affiliated to Hangzhou Medical College from 2021 to 2022, which was under the supervision of the Ethics Committee of Hangzhou Medical College. The authors had no access to information that could identify individual participants during or after data collection. The clinical data and mRNA expression data of 568 samples consisted of 58 normal samples, and 510 THCA samples were obtained from The Cancer Genome Atlas (TCGA).
Immunohistochemistry
Detection for MTERF3 protein expression levels was performed by IHC using the streptavidin-peroxidase method in THCA specimens. The primary antibody of MTERF3 (EM1701-29, 1:130; Huabio, Hangzhou, China) was added dropwise and incubated overnight at 4°C. The slides were stained using the Maxvision TM3 HRP-Polymer IHC Kit (KIT-5220; MXB Biotechnologies, Fuzhou, China). Cell staining of each slide was observed under the microscope and measured by ImageJ (version 1.53q).
Drug susceptibility analysis
Half maximal inhibitory concentration (IC50) is a key indicator of drug efficacy. The IC50 score estimated using ridge regression was used to predict drug susceptibility of sorafenib, docetaxel, and doxorubicin by pRRophetic R package based on the Genomics of Drug Sensitivity in Cancer (GDSC) dataset (Geeleher et al., 2014a; Geeleher et al., 2014b). That we associated the MTERF3 expression categorized into low- and high-expression groups with the susceptibility of sorafenib, docetaxel, and doxorubicin by pRRophetic package was used to explore the relationship between MTERF3 expression and prognosis of THCA.
Immunity analysis
The infiltration degree of immune cells was explored by the GSVA R package (Hänzelmann et al., 2013), and the markers of immune cells were extracted from Bindea's study (Bindea et al., 2013). The correlations between MTERF3 expression and the infiltration of immune cells were analyzed by Spearman's correlation analysis. The closer the value of Spearman's correlation coefficient (r) is 1 or −1, the stronger the correlation. Bruni's study showed that the enrichment of CD8 T cells was positively related to good prognosis of THCA patients (Bruni et al., 2020; Hegde and Chen, 2020). Based on the above, we probed the association of the MTERF3 expression and the prognosis of THCA by analyzing the relationship between the infiltration of CD8 T cells and MTERF3 expression.
Expression and survival analysis of ferroptosis and m6A methylation regulators
Ferroptosis regulators were obtained from Ze-xian Liu's research (Liu et al., 2020), and the m6A methylation regulators were searched from Juan Xu's study (Li et al., 2019). In this study, the expression of these regulators was visualized by the pheatmap R package. Cox regression models were constructed for multivariate analysis of the ferroptosis- and m6A-related genes, and then the iteration was performed under the step function by survival R package. Kaplan-Meier (KM) curves were performed to analyze the data in the low-risk and high-risk groups that were divided through the risk scores computed by the final model.
The correlation between the expression of MTERF3 and the prognosis of THCA patients
With the median of MTERF3 expression as the dividing point, the samples of patients were categorized into low- and high-expression groups. Meanwhile, the overall survival (OS) and progress-free interval (PFI) of THCA patients were predicted by performing the KM curves according to the data of TCGA. The survival curves of low and high MTERF3 expression groups were compared by the log-rank test. This test was also used to compute the effects of MTERF3, BRAF, Ret Proto-Oncogene (RET), PTEN, Tumor Protein P53 (TP53), and Thyroglobulin (TG) expression on the PFI of patients in T3 or T4 of T stage. Because the tumor progressed gradually during the dedifferentiation of cancer cells (Friedmann-Morvinski and Verma, 2014), the oncogenic dedifferentiation was evaluated by mRNA expression-based stiffness index (mRNAsi), which was computed by one-class logistic regression (OCLR) machine learning algorithm, for exploring the relationship between the MTERF3 expression and THCA progression.
Statistical analysis
All data were analyzed by R software (version 4.0.3). Sample comparisons between two groups were conducted by paired or unpaired Student t-test (for normally distributed data with equal variance) or by Mann-Whitney U test (for skewed distributed data). All statistical tests were two-tailed, and the significance level was set as α = 0.05.
Results
THCA tumor patients with reduced MTERF3 expression
To confirm the difference in MTERF3 expression between adjacent nontumor tissues and THCA tissues, the MTERF3 expression was quantitatively analyzed and investigated by binding IHC (Fig. 2A, B) and hematoxylin and eosin (H&E) staining (Fig. 2C, D) in 50 patients with papillary THCA. The results showed that the expression of MTERF3 in adjacent nontumor tissues was dramatically higher than in papillary thyroid cancer tissues (p < 0.001, Fig. 2E).
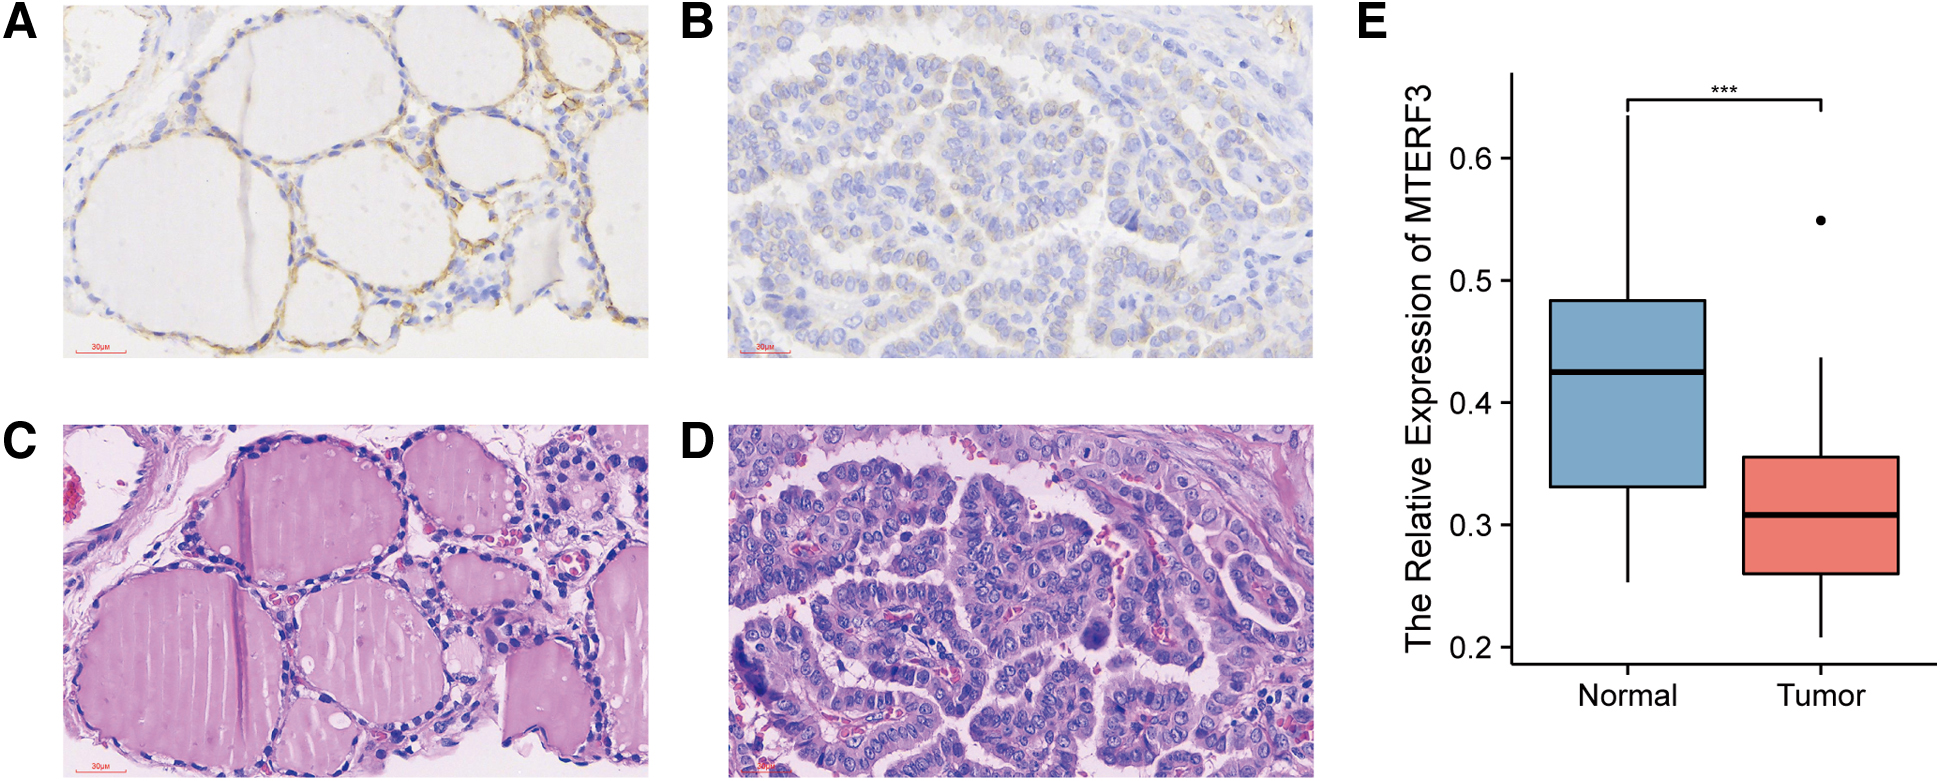
MTERF3 expression in tumorous and nontumorous thyroid tissues. In IHC ( × 400),
Interestingly, based on the RNA-Seq data obtained from the TCGA database, MTERF3 expression in THCA tissues also was significantly lower than in normal tissues (p < 0.01, Fig. 3A). Thus, the above results indicated that the expression of MTERF3 was reduced in THCA tissues.
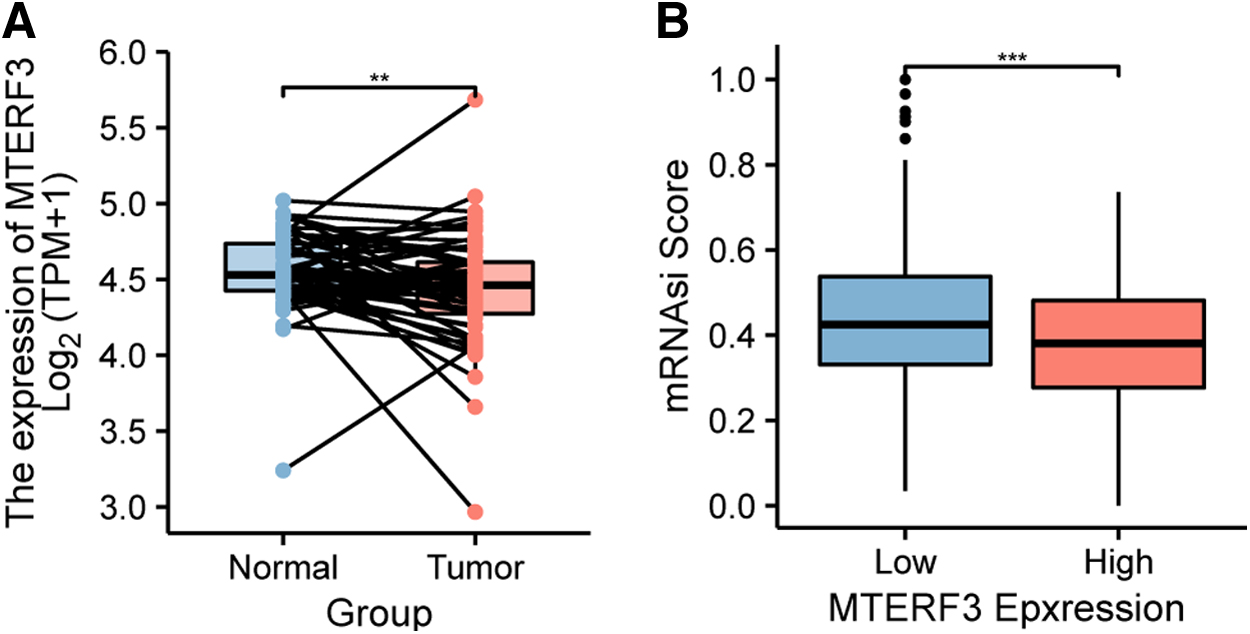
Bioinformatic data of THCA patients from the TCGA database.
THCA with higher level of tumor stemness expressing lower MTERF3
According to the grouping method introduced previously, between low and high MTERF3 expression groups, the tumor stemness based on the mRNAsi score was compared with each other. The results showed that the mRNAsi score in the low MTERF3 expression group was dramatically higher than that in the high MTERF3 expression group (p < 0.001, Fig. 3B). This phenomenon implies that tumor progression in the low MTERF3 expression group in THCA was worse than that in the high MTERF3 expression group due to the more intense oncogenic dedifferentiation in the former.
Estimation of chemotherapeutics and immune microenvironment of THCA
After using the pRRophetic package to predict the sensitivity of doxorubicin, sorafenib, and docetaxel in low and high MTERF3 expression groups of THCA, we found that the IC50 scores of 3 chemicals in the low MTERF3 expression group, all were significantly higher than that in high MTERF3 expression group. This result suggested that lower MTERF3 expression in THCA patients could be adverse to the prognosis due to the reduced sensitivity of these drugs (Fig. 4).

Association between drug sensitivity and MTERF3 expression. The IC50 score was calculated by pRRophetic of
The GSVA R package was used to visualize the correlation between MTERF3 expression and the infiltration level of CD8 T cells. Then, we found that the MTERF3 expression exhibited a positive correlation with the enrichment of CD8 T cells (r = 0.152, p < 0.05, Fig. 5). In addition, the enrichment of CD8 T cells was positively correlated with good prognosis of THCA patients according to Bruni's study mentioned in the methods section. Thus, the expression of MTERF3 may affect the enrichment of CD8 T cells, which alters prognosis.

MTERF3 expression positively correlated with the enrichment of CD8 T cells.
Expression analysis of ferroptosis- and m6A methylation-related genes
By mapping the expression heatmap of genes involved in the ferroptosis and m6A methylation as critical roles in tumorous progression or prognosis of THCA patients, we found that the expression of MTERF3 in THCA positively correlated with the expression of ferroptosis and m6A regulators (Fig. 6A, B). Through multivariate Cox and step analysis, we constructed the PFI prognosis risk model of THCA patients by ferroptosis-related genes and m6A-related genes. THCA patients were divided into two groups by the median risk scores calculated by the formula of the risk model. The difference in PFI distribution between low-risk and high-risk groups was statistically significant (log-rank p < 0.05, Fig. 6D, E).
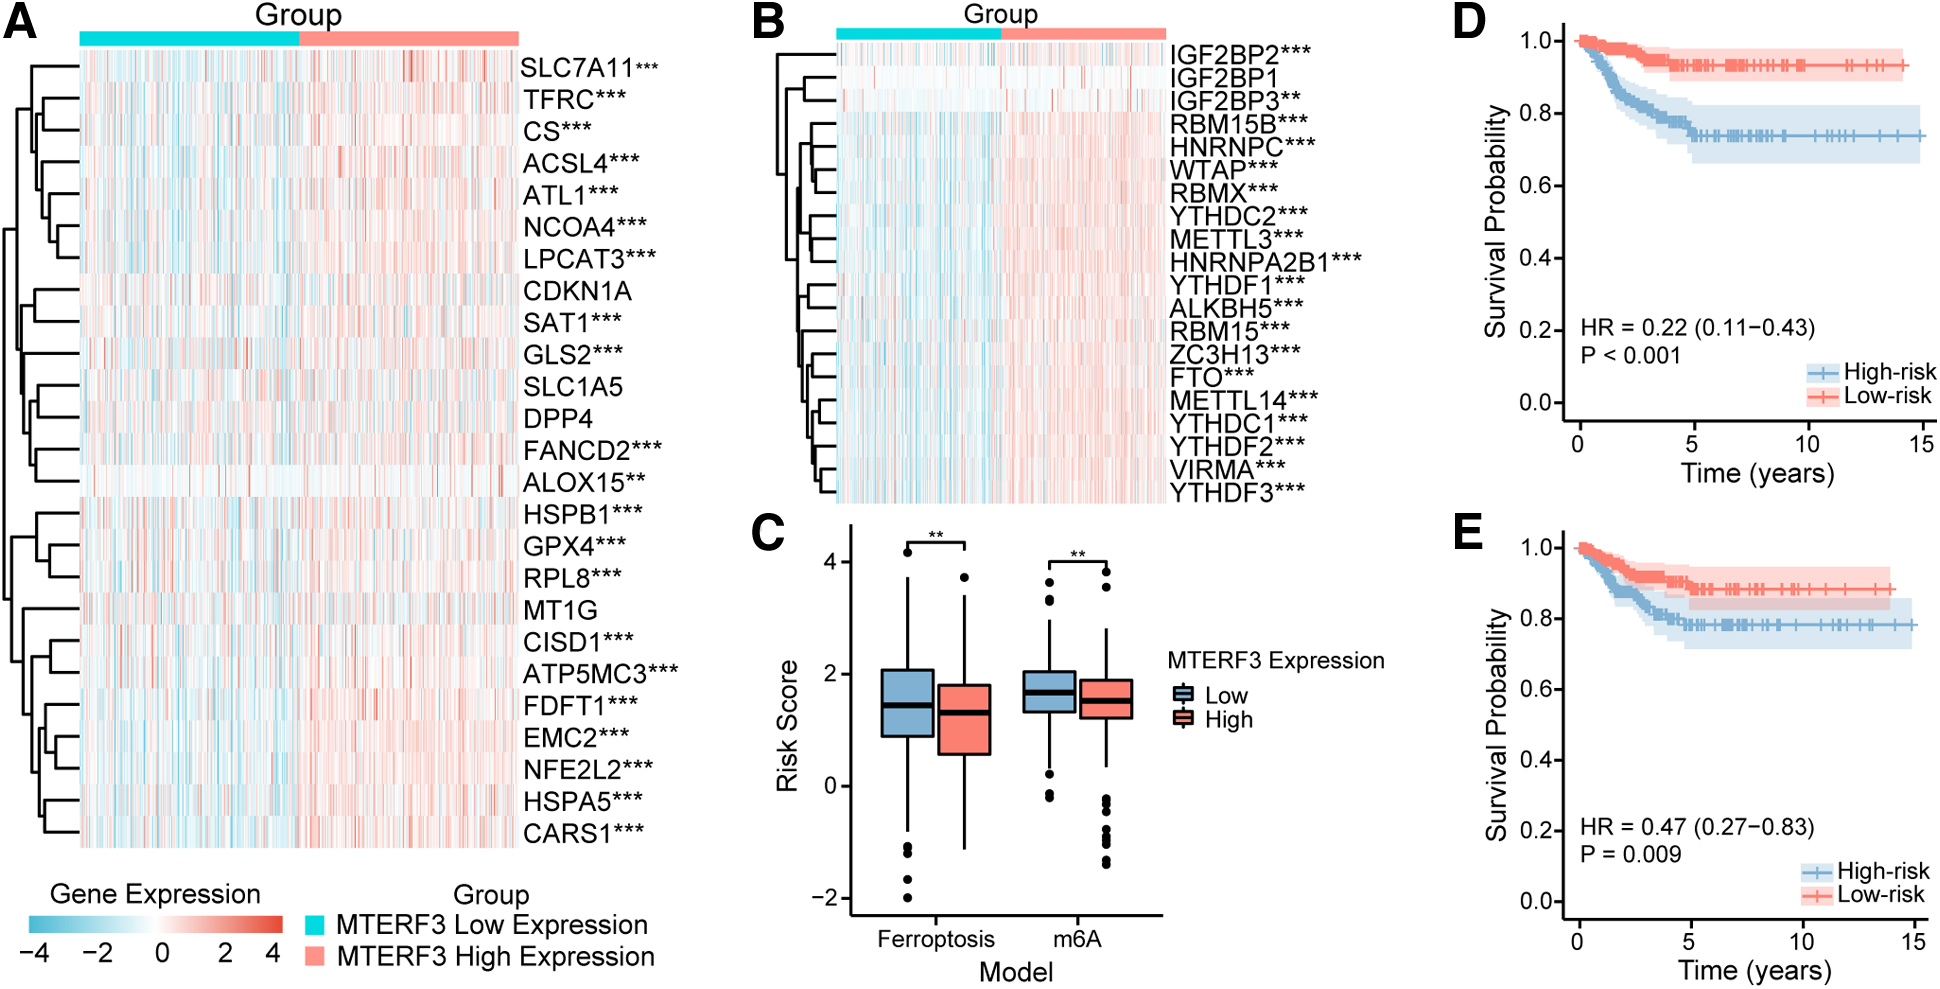
Association between the MTERF3 expression with ferroptosis- and m6A-related genes. Heatmap of gene expression of
After calculating the risk scores in the low and high MTERF3 expression groups by ferroptosis- and m6A-related gene models, we found that the risk scores in low MTERF3 expression groups were significantly higher than the high MTERF3 expression groups (p < 0.01, Fig. 6C).
The risk model constructed by ferroptosis genes was computed by the following formula.
The risk model constructed by m6A methylation-related genes was calculated by the following formula.
Low MTERF3 expression in THCA potentially predicting poor prognosis
During survival analysis, although the difference in OS distribution between low and high MTERF3 expression groups was not statistically significant (log-rank p = 0.847, Fig. 7A), low expression of MTERF3 was associated with shorter PFI (log-rank p = 0.007, Fig. 7B). To explore the utility of MTERFs gene family members in predicting PFI, univariate and multivariate Cox regression analyses of MTERF1, MTERF2, MTERF3, and MTERF4 were performed (Fig. 7C). The results showed that MTERF3 (p = 0.007) and MTERF4 (p = 0.012) were independent prognostic factors for PFI in THCA patients by univariate Cox regression. Surprisingly, the survival contribution degree of MTERF3 was higher than that of MTERF4 based on the hazard ratio of univariate Cox regression.
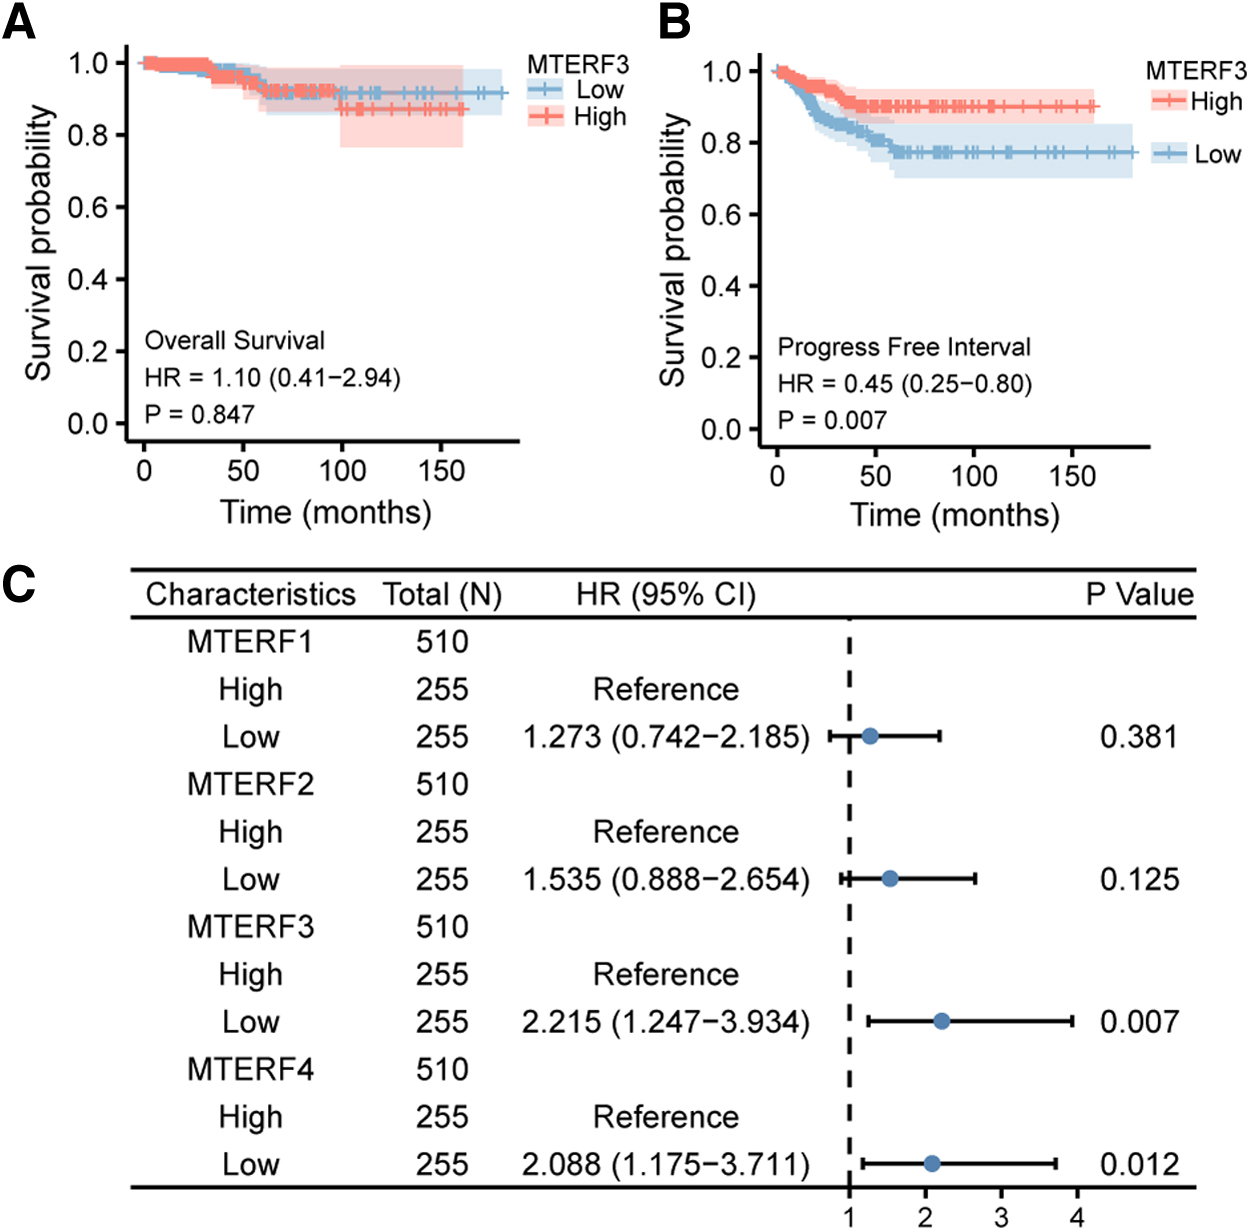
Survival analyses of MTERF3 and univariate Cox regression of MTERFs gene family.
However, the difference between MTERF3 and MTERF4 was not statistically significant after performing a multivariate Cox regression. Therefore, MTERF3 is the best prognostic marker among MTERFs gene family members, and the low expression of MTERF3 may predict poor PFI in THCA patients.
In addition, to estimate the prognostic value of MTERF3 and other clinicopathological molecules such as BRAF, RET, PTEN, TP53, and TG for advanced THCA patients, PFI analyses for these molecules were, respectively, performed in THCA patients staged at T3 or T4 (Fig. 8). Surprisingly, the PFI for MTERF3 had a statistically significant difference between low- and high-expression groups (log-rank p = 0.014, Fig. 8A), while the PFIs for other clinicopathological molecules were not statistically significant (log-rank p > 0.05, Fig. 8B-F). The results suggested that the survival of advanced THCA patients could not be predicted by other clinicopathological molecules, but it seems that it could be predicted by MTERF3.
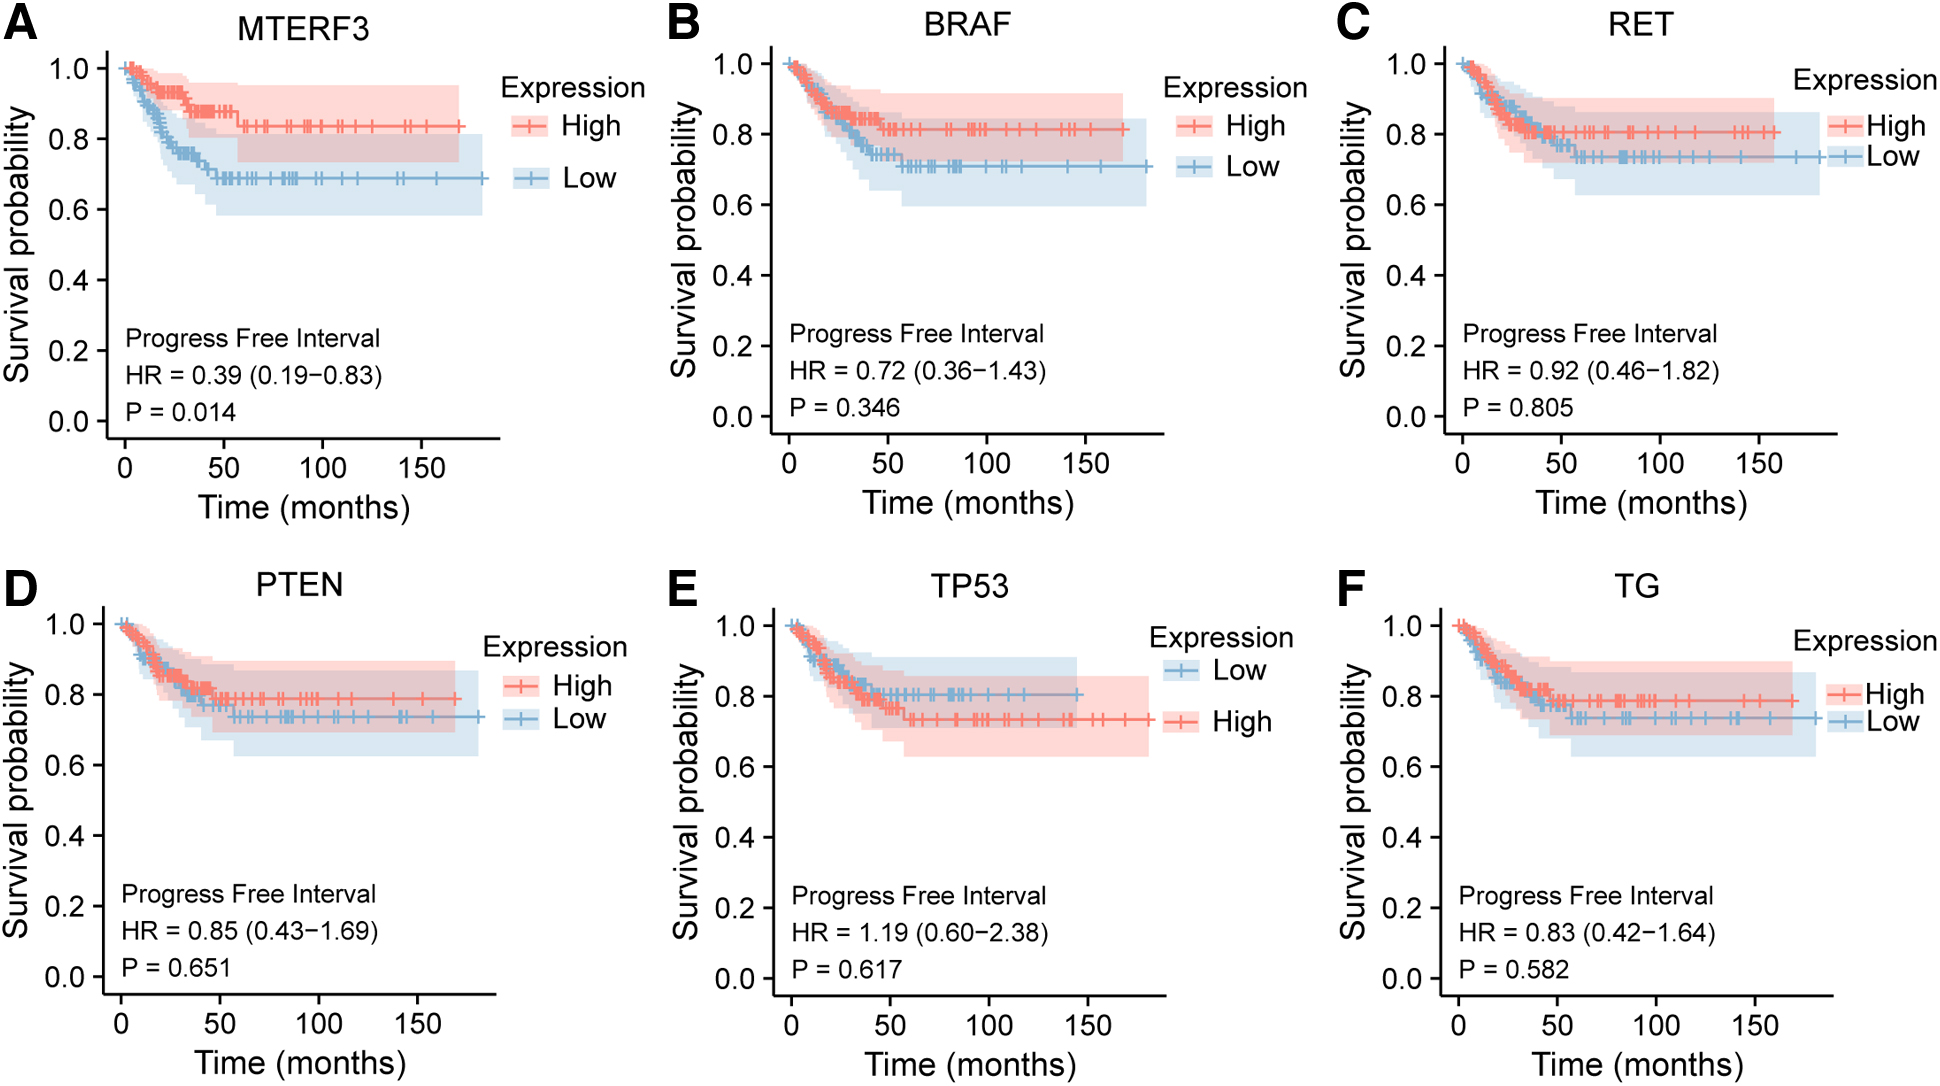
PFI analyses of some molecules in THCA patients staged at T3 and T4. KM analyses for the expressions of
Discussion
MTERFs are encoded in nuclear, transferred to the cytoplasm, and localized in the mitochondria (Fernandez-Silva et al., 1997). MTERF3 belongs to the MTERFs family, which regulates the transcription of mtDNA (Park et al., 2007). Energy metabolism, apoptosis, and other essential biological functions are mediated by mitochondria (Xiao et al., 2018). Besides, genetic defects of the mitochondrial genome are associated with diabetes, heart disease, and carcinomas (Park et al., 2007). However, the core mechanisms of abnormal MTERF3 expression in cancer are still undefined. Park's study demonstrated that oxidative phosphorylation levels and transcript stability of mitochondria were decreased after MTERF3 knockdown (Park et al., 2007).
Anna's research showed that MTERF3 knockdown activated the transcription of mtDNA and affected the assembly of the large mitochondrial ribosomal subunit, thus promoting abnormal expression of ribosomal proteins and the progression of the tumor (Anna et al., 2013). The above shows that MTERF3 plays an important role in cellular function, transcript stability of mitochondria, progression of the tumor, and so on.
In our investigation, not only MTERF3 was expressed lower in THCA tissues than in normal tissues by IHC and RNA-Seq data, but also the low MTERF3 expression group had stronger tumor stemness than the high MTERF3 expression group by the OCLR algorithm. Therefore, based on the property of promoting tumor proliferation from the tumor stemness (Milanovic et al., 2018), the low expression of MTERF3 in THCA can promote tumor proliferation. Besides, our research revealed that not only the patients with low expression of MTERF3 had a shorter PFI than patients with high expression of MTERF3, but also MTERF3 is the best independent prognostic factor of THCA patients among the MTERFs family, and the only factor which could differentiate patients staged at T3 and T4 with longer or shorter PFI when compared with other clinicopathological markers. It demonstrated effectually the potential of MTERF3 to predict the prognosis of THCA.
The situation found by us showed that expression of MTERF3 also correlated with the degree of immune cell infiltration. Especially, lower infiltration levels of CD8 T cells, which were positively correlated with the prognosis of THCA patients (Bruni et al., 2020; Hegde and Chen, 2020), trended also to lower expression of MTERF3 in THCA patients. Thus, the downregulation of MTERF3 may induce poor prognosis in THCA patients by decreasing the enrichment of CD8 T cells.
Similarly, MTERF3 expression was closely related to the expression of ferroptosis- and m6A methylation-related genes. Through constructing prognosis models based on the risk scores of these related genes in THCA patients divided into low and high MTERF3 expression groups, we found that the risk scores indicating a poor degree of prognosis in the low MTERF3 expression groups of THCA were higher than that in the high MTERF3 expression groups. The above reflects indirectly that low expression of MTERF3 in THCA can predict poor prognosis.
Ferroptosis, aggregating the ferrous ion and lipid peroxides, is a novel cell death form, which is associated with the progression and survival of THCA (Chen et al., 2023; Tang et al., 2021; Wang et al., 2021). Moreover, increasing the expression of glutathione peroxidase 4 (GPX4) as a key regulator of ferroptosis inhibited the progress of THCA and led to poor prognosis by suppressing ferroptosis of THCA cells (Chen et al., 2023). RNA m6A methylation, one of the most common RNA modifications, includes regulators of m6A methylation that are suggested prognostic markers of THCA, closely implicated in the progression and drug resistance of THCA (Xu et al., 2023).
Our investigation has shown that a worse prognosis of THCA corresponds to the low MTERF3 expression closely related to the expression of ferroptosis- and m6A methylation-related genes. Therefore, we speculate that MTERF3 may interact with regulators of ferroptosis and m6A methylation and regulate these molecules to affect the prognosis of patients with THCA. This hypothesis seems to be supported by our analysis based on STRING and RM2Target database (Bao et al., 2023; Szklarczyk et al., 2023).
In addition, we found that the THCA patients with low expression of MTERF3 had less sensitivity to doxorubicin, sorafenib, and docetaxel than the patients with high expression of MTERF3. Therefore, MTERF3 may be a potential indicator for adjusting dosage and selecting drugs in chemotherapy on the way to a better prognosis.
However, a limitation of this study is that we were not able to verify these results by in vitro and in vivo experiments in a short period because of the constraining of logistic resources and specialized scientific research laboratories. Besides, the mechanisms of abnormal expression of MTERF3 in THCA are still unclear. The future work of our team should focus on the mechanism of MTERF3 abnormal expression and the detection of it by in vitro and in vivo experiments, which is expected to provide theoretical support for clinical practices.
Conclusions
The expression of MTERF3 was lower in THCA compared with adjacent nontumor tissues. The results indicated that low expression of MTERF3 was the independent prognostic factor for poor prognosis of THCA patients.
Footnotes
Acknowledgments
The authors are grateful to the patients who participated in this study. The authors also gratefully acknowledge TCGA and GDSC for providing data. Many thanks are also given to Xiantao platform and Assistant for Clinical Bioinformatics for convenient data visualization.
Authors' Contributions
M.-t.S. and C.-z.F. designed this research. H.-y.Z. and M.-t.S. performed the data analysis and visualization. L.-h.Y. performed the experiments of H&E and IHC staining of histopathological slides. H.-j.R., M.-l.G., and J.-j.F. made the clinical diagnosis of the slides. H.-y.Z. wrote this article. M.-t.S. and Y.-y.L. revised the article. Y.-y.L. and C.-z.F. supervised and guided this project. All authors contributed to the article and approved the submitted version.
Author Disclosure Statement
No competing financial interests exist.
Funding Information
This work was supported by the Zhejiang Provincial Program for the Cultivation of High-level Innovative Health talents and Scientific Research Fund of Zhejiang Provincial Education Department (Y201942775).
References
Supplementary Material
Please find the following supplemental material available below.
For Open Access articles published under a Creative Commons License, all supplemental material carries the same license as the article it is associated with.
For non-Open Access articles published, all supplemental material carries a non-exclusive license, and permission requests for re-use of supplemental material or any part of supplemental material shall be sent directly to the copyright owner as specified in the copyright notice associated with the article.
