




Abstract
Background:
Earlier research has demonstrated a genetic basis for the susceptibility to ankylosing spondylitis (AS) and the severity of AS. By employing a genome-wide association study, recent work has established a correlation between the susceptibility to AS and the ANO6, HAPLN, and EDIL3 genes in a Western study population—though alternative studies have not corroborated these findings. This study aims to examine the effects of ANO6, HAPLN1, and EDIL3 polymorphisms on the susceptibility and severity of AS among the predominantly Chinese Han population.
Methods:
The study involved the collection of blood samples from 497 patients with AS and 498 nonrelated healthy individuals. All participants in the study were human leukocyte antigen (HLA) HLA-B27 positive and of Han Chinese descent. Illness severity was the criteria used for classifying patients with AS. Thirteen tagSNPs in ANO6, HAPLN1, and EDIL3 were chosen and then subjected to genetic typing. Analysis was conducted on the occurrence rates of various genotypes and alleles between the control group and patients with varying AS severity.
Results:
Following Bonferroni correction, it was found that the rs4768085 and rs17095830 single nucleotide polymorphism (SNPs) in ANO6 were related to the susceptibility to AS. Further, the rs6869296 SNP in HAPLN1 and the rs2301071 SNP between EDIL3 and HAPLN1 were also related to AS susceptibility. Regarding AS severity, the rs4768085, rs2897868, rs7965430, and rs11182965 SNPs in ANO6 were found to be associated.
Conclusions:
Among the Han population in China, the ANO6 and HAPLN1 genes are related to the susceptibility to AS; the ANO6 gene is also associated with the severity of AS.
Introduction
Ankylosing spondylitis (AS) is a prevalent form of inflammatory disease that typically begins with swelling in the sacroiliac joint and ultimately leads to spinal fusion, causing damage to the spine, peripheral joints, tendons, and ligaments (Ashrafi et al., 2020). AS can result in spinal ankylosis and irreversible structural damage (van der Heijde et al., 2019); the disorder significantly reduces work efficiency (Yang X et al., 2016; Hwang et al., 2021).
Hamersma et al. (2001) conducted a familial analysis that initially revealed the correlation between genetics and the extent of AS disease. Advances in technology and our comprehension of the genome have significantly enhanced endeavors to identify genes associated with AS since this preliminary investigation. A genome-wide association study revealed a correlation between susceptibility to AS and SNP rs17095830 in the ANO6 gene, as well as SNP rs4552569 between the HAPLN1 and EDIL3 genes. Furthermore, Lin et al. (2011) propose that cartilage matrix development and bone formation may contribute to the development of AS. However, Wei et al. (2013) conducted a similar study on the Taiwanese population and found no correlation between polymorphisms and AS susceptibility or severity. This is concerning given the genetic similarity between the Chinese and Taiwanese populations and the elevated rate of false positives in genome-wide association studies. Additional research is needed to verify the correlation between ANO6, HAPLN1, EDIL3, and AS found by Lin et al. Therefore, our research aims to replicate Lin et al.’s study, investigating the association between AS and these genes. We hypothesize that the ANO6, HAPLN1, and EDIL3 genes are linked to both the susceptibility and severity of AS. Linkage disequilibrium (LD) is the nonrandom association of alleles at different loci. According to HapMap, most of the SNPs on these three genes are in LD, meaning that we only need to select several tagSNPs to study the entire gene. Calculations were performed by Haploview, and finally, 13 tagSNPs were selected.
Methods
Study population
In this study, we recruited 497 AS patients and 498 unrelated healthy controls, matched for age and sex. All participants had Han Chinese ancestry. Blood samples were collected from patients admitted to the PLA General Hospital from 2010 to 2020. To reduce the serological impact, we selected patients who had tested HLA-B27 positive. Nonsteroidal antiinflammatory drugs were routinely administered to all AS patients, with no alternative treatments employed.
The AS patients consisted of 439 males (88.3%) and 58 females (11.7%) with an average age of 31.21 years (16-60 years old) (Table 1). The healthy controls consisted of 431 males (86.5%) and 67 females (13.5%), with an average age of 30.6 years (16-60 years old). There were no significant differences observed in patient sex or age distribution between the AS and control cohorts (p = 0.396 and 0.327). All AS diagnoses were confirmed by skilled rheumatologists and met the modified New York criteria (van der Linden et al., 1984). Individuals suffering from rheumatoid arthritis, inflammatory bowel disease, psoriasis, or other autoimmune conditions were excluded from both groups.
Demographic Data of AS Patients and Controls
There is no significant difference in age and sex distribution between AS patients and controls. Numerical values are presented as mean ± standard deviation.
AS, ankylosing spondylitis; BASFI, Bath ankylosing spondylitis function index; BASDAI, Bath ankylosing spondylitis disease activity index; mSASSS, modified Stokes ankylosing spondylitis spine score.
Obtaining fundamental data
Participants completed the Bath AS function index (BASFI) questionnaire to evaluate the patient’s functional status and the Bath AS disease activity index (BASDAI) questionnaire to assess AS activity (Calin et al., 1994; Garrett et al., 1994). The modified Stokes AS spine score (mSASSS) is an established scoring method for measuring long-term spinal alterations (Baraliakos et al., 2009; Sieper et al., 2009; Creemers et al., 2005). The mSASSS score for each patient was derived from lateral X-ray films of the cervical and lumbar spine. The mSASSS scores were individually allocated by three authors, and the mean score was used.
Categorization of severity
Agreement on the categorization of AS severity is lacking (Amor et al., 1994). This research defines severe AS as requiring surgical intervention within a decade of diagnosis. Signs of requiring surgery include difficulties in standing, forward-facing vision, and viscera compression caused by kyphosis, resulting in pain (Kiaer and Gehrchen, 2010). Normal AS patients display sacroiliac joint inflammation, but their spinal and other joints remain relatively unaffected, necessitating only medical intervention without surgery within 10 years of diagnosis. Based on this classification, 164 patients with AS were classified as having severe subtypes, whereas 333 patients were classified as having normal subtypes. Table 2 displays a comparative analysis of clinical characteristics between severe AS and normal AS patients.
Clinical Features Comparing Severe AS and Normal AS
There is no difference between severe AS patients and normal patients in sex distribution, age, and duration of diagnosis; however, the BASFI, BASDAI, and mSASSS are higher in severe AS patients.
AS, ankylosing spondylitis; BASFI, Bath ankylosing spondylitis function index; BASDAI, Bath ankylosing spondylitis disease activity index; mSASSS, modified Stokes ankylosing spondylitis spine score.
SNPs selection
Data were downloaded from the HapMap database for the Chinese Han Beijing (CHB) population (Chinese Han in Beijing). Using Haploview 4.2 software for calculations, the result indicates that most SNPs in these genes are in LD. Therefore, we only needed to select a few representative tagSNPs to study the entire gene. The select criteria were r2>0.8 and minor allele frequency >5%. Thirteen tagSNPs were selected for investigation: seven in ANO6, two in HAPLN1, two in EDIL3, and two between HAPLN1 and EDIL3. ANO6 is located on chromosome 12, whereas HAPLN1 and EDIL3 are on chromosome 5.
Figure 1 illustrates the position of each chosen tagSNP. The SNP rs4768085 localizes to the promoter of ANO6. The SNP rs163716 localizes to the promoter of EDIL3. All the other SNPs are in the introns of their respective genes.
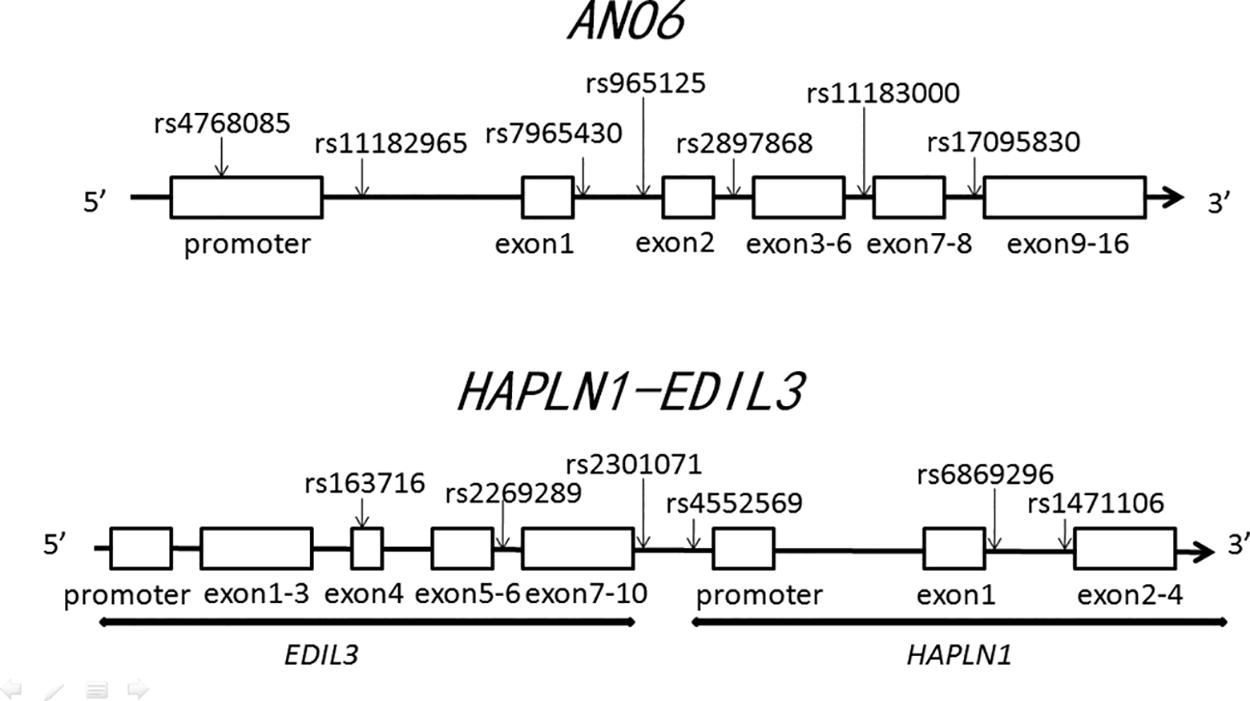
The positions of each selected tagSNP on the genes. The SNP rs4768085 is in the promoter of ANO6. The SNP rs163716 is in the promoter of EDIL3. Other SNPs are all in the introns of their respective genes.
DNA extraction and genotyping analysis
Using the AxyPrep Blood Genomic DNA Miniprep kit (Axygen Biosciences), DNA extraction was performed on 2 mL samples of whole blood. The MassARRAY system (Sequenom) was used to identify SNPs. The technique of chip-based matrix-assisted laser desorption ionization flight time mass spectrometry was employed (Tost and Gut, 2005). Most SNPs were successfully genotyped. Genotype detection was more than 98% in both AS groups and healthy controls.
Statistical analysis
We used the following formula to test Hardy-Weinberg equilibrium: χ2 = (O(AA) - Q(AA))2/Q(AA) + (O(AB) - Q(AB))2/Q(AB) + (O(BB) - Q(BB))2/Q(BB), where O represents the observed allele frequency, Q represents the expected allele frequency, and A and B represent the two kinds of alleles. If the p value was < 0.0001, this SNP was considered to not be in Hardy-Weinberg equilibrium and was not selected. An independent sample t test was used to analyze participant age distribution, and the Pearson’s chi-squared test was used to analyze participant sex distribution. Genotype and allele frequency distributions were analyzed using the Pearson’s chi-squared test with age and sex adjusted. When analyzing genotype and allele frequencies, if the p value was < 0.01 after Bonferroni correction, this SNP was considered significantly different between AS cases and healthy controls. Relative risk associated with a major genotype or allele was estimated with a 95% confidence interval. Each SNP’s three genotypes were compared, with the p value for each genotype being displayed only when it reached a significance level of 0.05. Comparisons were made between the severe AS group and the control group, followed by comparisons between the normal AS group and the control group. SNPs showing notable differences between AS patients and controls were considered linked to AS susceptibility. SNPs exhibiting notable differences between patients with severe AS compared with the control groups, and between normal AS patients and control groups, were deemed linked to AS severity. SPSS 19.0 statistical software was used for all statistical analysis.
Declaration of ethical standards
In this experiment, blood samples were obtained from participants’ routine blood tests. Guidelines on clinical data collection, the local Ethics Committee’s guidelines, and the 1975 Helsinki Declaration were adhered to in gathering and using DNA specimens. Written informed consent was obtained from all participants (or from the parents of participants if they were under the age of 18). The research protocol was approved by the Institutional Review Board of Tianjin Hospital and the PLA General Hospital.
Results
Clinical features
Table 1 documents the BASFI, BASDAI, and mSASSS data for patients with AS. Within the group of 497 AS patients, the average BASFI was 4.30 ± 1.75, the average BASDAI was 4.20 ± 1.19, and the average mSASSS was 16.4 ± 16.4 (mean ± standard deviation). A comparison between patients with severe AS and those with normal AS revealed no significant differences in gender, age, or length of the illness (p = 0.149, 0.315, and 0.810, see Table 2). In the severe AS group, the BASFI values were significantly higher (6.03 ± 2.05) compared with the normal AS group (3.44 ± 0.54) (p value <0.001), indicating a decline in patient functionality in the severe AS group. Likewise, the BASDAI showed was significantly higher in the severe AS group (5.49 ± 1.09) compared with the normal AS group (3.56 ± 0.54; p value <0.001)—indicating increased disease activity. This trend was consistent in mSASSS cases (37.1 ± 13.2 in severe AS patients compared with 6.21 ± 1.07 in normal AS patients, p value <0.001), indicating a higher incidence of radiographical alterations in severe AS patients.
Genotype and allele
We genotyped 13 tagSNPs with comprehensive findings presented in Table 3 (ANO6) and Table 4 (HAPLN1-EDIL3). All 13 selected tagSNPs were in Hardy-Weinberg equilibrium: rs4768085 p = 0.0746; rs11183000 p = 0.7131; rs965125 p = 0.1283; rs2897868 p = 0.2177; rs17095830 p = 0.0007; rs7965430 p = 0.2704; rs2269289 p = 0.4045; rs6869296 p = 0.0179; rs1471106 p = 0.5958; rs163716 p = 0.6455; rs2301071 p = 0.0154; rs4552569 p = 0.0002.
SNPs in ANO6 Were Compared Between All AS Patients, Severe AS Patients, and Normal AS Patients Versus the Control Subjects
“All” means the p value that we compare all the three genotypes using the chi-squared method. The p value for individual genotypes is shown only if significant at 0.05 level.
The last lines of genotypes or alleles are the major genotypes or the major alleles. The other genotypes or alleles are compared with them. The relative risk associated with major genotypes and major alleles is estimated as an odds ratio (OR) with a 95% confidence interval (CI).
OR (95% CI) is adjusted by age and sex using multiple regression analysis.
p value is <0.05 but cannot pass Bonferroni correction, which shows marginal significant difference.
p value <0.01, which shows significant difference after Bonferroni correction. When the genotypes or alleles are both related to severe AS and normal AS, they should be considered to be related to severity of AS. If the genotypes or alleles are only related to one of severe AS or normal AS, they should not be considered to be related to severity of AS, we will not use “*” even if p value is <0.01.
AS, ankylosing spondylitis.
SNPs in HAPLN1-EDIL3 Were Compared Between All AS Patients, Severe AS Patients, and Normal AS Patients Versus the Control Subjects
“All” means the p value that we compare all the three genotypes using the chi-squared method. The p value for individual genotypes is shown only if significant at 0.05 level.
The last lines of genotypes or alleles are the major genotypes or the major alleles. The other genotypes or alleles are compared with them. The relative risk associated with major genotypes and major alleles is estimated as an odds ratio (OR) with a 95% confidence interval (CI).
OR (95% CI) is adjusted by age and sex using multiple regression analysis.
p value is <0.05 but cannot pass Bonferroni correction, which shows marginal significant difference.
p value is <0.01, which shows significant difference after Bonferroni correction. When the genotypes or alleles are both related to severe AS and normal AS, they should be considered to be related to severity of AS. If the genotypes or alleles are only related to one of severe AS or normal AS, they should not be considered to be related to severity of AS, we will not use “*” even if p value is <0.01.
SNPs in ANO6 were compared between all AS patients and control subjects, between severe AS patients and control subjects, and between normal AS patients and control subjects (Table 3). The rs4768085 SNP shows a significant difference when comparing all AS patients with controls, with the AA genotype being higher in AS patients than in controls (p = 0.009). This SNP also shows a significant difference when comparing severe AS with controls and normal AS with controls: the AA genotype is higher in severe AS patients (p < 0.0001) and lower in normal AS patients (p < 0.0001). Additionally, the A allele is higher in severe AS patients (p < 0.0001) and lower in normal AS patients (p < 0.0001). Interestingly, all AA genotype patients seem to exhibit severe AS, whereas all CC genotype patients exhibit normal AS. Therefore, the rs4768085 SNP appears to be significantly related to AS severity.
The rs11183000 SNP shows a significant difference when comparing all AS patients with controls, with the GA genotype being lower in AS patients than in controls (p < 0.0001). This SNP also shows significant differences when comparing severe AS with controls and normal AS with controls: the GG genotype is higher in severe AS patients (p < 0.0001) and lower in normal AS patients (p < 0.0001), and the G allele is higher in severe AS patients (p < 0.0001) and lower in normal AS patients (p < 0.0001). However, this SNP is not in Hardy-Weinberg equilibrium, so despite some significant results, the data have lower power.
The rs2897868 SNP shows a significant difference when comparing severe AS with controls and normal AS with controls: the CC genotype is lower in severe AS patients (p = 9.368 × 10⁻¹⁰) and higher in normal AS patients (p = 0.009). The C allele is also lower in severe AS patients (p = 3.990 × 10⁻¹²) and higher in normal AS patients (p = 0.007). The rs17095830 SNP shows a significant difference when comparing all AS patients with controls, with the GG genotype being higher in AS patients than in controls (p = 0.002).
The rs7965430 SNP shows a significant difference when comparing severe AS with controls and normal AS with controls: the AA genotype is higher in severe AS patients (p = 2.907 × 10⁻²⁹) and lower in normal AS patients (p = 9.076 × 10⁻⁷). The A allele is higher in severe AS patients (p = 5.857 × 10⁻²⁸) and lower in normal AS patients (p = 1.447 × 10⁻⁵). The rs11182965 SNP shows a significant difference when comparing severe AS with controls and normal AS with controls: the AA genotype is higher in severe AS patients (p = 6.005 × 10⁻²²) and lower in normal AS patients (p = 5.381 × 10⁻⁷), the AC genotype is higher in severe AS patients (p = 6.478 × 10⁻¹²) and lower in normal AS patients (p = 0.008), and the A allele is higher in severe AS patients (p = 4.262 × 10⁻²¹) and lower in normal AS patients (p = 2.295 × 10⁻⁶).
SNPs in HAPLN1-EDIL3 were compared between all AS patients, severe AS patients, and normal AS patients versus the control subjects (Table 4). The rs6869296 SNP shows a significant difference when comparing all AS patients with controls, with the GC genotype being higher in all AS patients than in controls (p = 0.001). The rs2301071 SNP shows a significant difference when comparing all AS patients with controls, with the AG genotype being lower in all AS patients than in controls (p = 0.006) and the A allele being lower in all AS patients than in controls (p = 2.740 × 10⁻³⁴).
Haplotype analysis
The LD map of ANO6 is illustrated in Figure 2, comparing all AS patients with the control group. The Haploview 4.2 software excluded all haplotypes due to their minimal LD. Supplementary Figure S1 shows the LD map of ANO6, comparing patients with severe AS to the control group. Supplementary Figure S2 illustrates the LD map of ANO6, highlighting differences between typical AS patients and the control group. Supplementary Figure S3 presents the LD map of HAPLN1-EDIL3, comparing all AS patients with the control groups. The LD map for HAPLN1-EDIL3 is illustrated in Supplementary Figure S4, highlighting differences between severe AS patients and the control group. Supplementary Figure S5 shows the LD map of HAPLN1-EDIL3, comparing normal AS patients with control individuals. The Haploview 4.2 software did not generate any haplotypes due to minimal LD.

Linkage disequilibrium (LD) map of ANO6 comparing all ankylosing spondylitis patients and controls. Darker color indicates higher LD, lighter color indicates less LD. Numbers in the squares indicate correlation coefficient (R2) value.
Discussion
A genome-wise association study found that the rs17095830 SNP in the ANO6 gene and the rs4552569 SNP between the HAPLN1 and EDIL3 genes were related to AS susceptibility. However, Wei et al. (2013) repeated the research on the Taiwanese population and did not find these two SNP loci to be associated with AS. The differing conclusions of these studies highlight the need to repeat the studies in other populations to enhance their persuasiveness.
ANO6 encodes anoctamin6, also known as transmembrane protein 16F (TMEM16F), which triggers the activation of an outwardly rectifying chloride channel when Fas receptors are stimulated during apoptosis induction. Ano6 activation requires elevated levels of intracellular Ca2+ (Martins et al., 2011). It was discovered that Ano6 functions as a conduit for the release of bicarbonate in airways and other epithelial tissues (Tian et al., 2012). Recent research has revealed that ANO6 functions as a calcium-dependent conduit for both cations and anions; TMEM16F has also been found to be related to the speed of migration of Ehrlich Lettre ascites cells (Kmit et al. 2013; Jacobsen et al., 2013). Suzuki et al. (2010) explored the role Ano6 plays in both external and internal programmed cell death. Ano6 is activated during the control of cellular volume and apoptosis of cells (Kmit et al., 2013; Juul et al., 2014). Furthermore, studies have demonstrated that ANO6 knockout mice have reduced mineral content in their skeletal tissues (Ehlen et al., 2013). Our data indicated ANO6 is associated with susceptibility to AS and severity in the Chinese Han population. This suggests that a mutation in ANO6 may lead to disorders in Ca2+ deposition, resulting in fibrosis and ankylosis. Hyaluronan and proteoglycan link protein 1 (HAPLN1), also known as cartilage link protein 1, plays a crucial role in the extracellular matrix of cartilage (Dudhia et al., 1994). HAPLN1 encodes the HAPLN1 protein, which ensures the stability of aggrecan and hyaluronic acid clusters by attaching to aggrecan on the hyaluronic acid sequence. The aggregates formed possess a robust macromolecular configuration, aiding in joint compression resistance and shock absorption. Mice lacking HAPLN1 exhibit chondrodysplasia that is fatal around the time of birth, and those with two identical mutations aimed at HAPLN1 exhibit impaired cartilage growth and delayed bone development (Watanabe and Yamada, 1999). HAPLN1 plays a crucial role in maintaining cartilage balance and could contribute to osteoarthritis development accompanied by spinal deterioration. Both HAPLN1 and EDIL3 encode proteins in the extracellular matrix, crucial for the development of cartilage. The HAPLN1 gene is also linked to the development of osteophytes in cases of spinal osteoarthritis among Japanese individuals (Urano et al., 2011).
The EDIL3 protein reduces standard Wnt signaling, mirroring the inhibitory impact of DKK1, which disrupts Wnt signaling and thereby controls bone development (Takai et al., 2010; Glantschnig et al., 2010). In an animal arthritis model, it was demonstrated that blocking DKK1 results in the merging of sacroiliac joints, a key indicator of the advancement of AS (Uderhardt et al., 2010). Cultured cartilage grafts exhibit a notable increase in EDIL3 protein concentrations (Wilson et al., 2010).
Our data indicate that the rs6869296 SNP in HAPLN1 is associated with AS susceptibility, and the rs2301071 SNP between EDIL3 and HAPLN1 is also related to the AS susceptibility. This suggests that HAPLN1 is linked to susceptibility to AS, possibly due to abnormalities in the growth of cartilage and bone development. However, the rs2301071 SNP is neither in HAPLN1 nor in EDIL3, and there is insufficient evidence to establish a relationship between this SNP and EDIL3.
Our research confirms the relationship between the ANO6, HAPLN1, and EDIL3 genes with AS susceptibility and severity in the Chinese Han population. ANO6 is associated with both susceptibility to AS and its severity, whereas HAPLN1 is linked to AS susceptibility. These findings suggest that genetic screening for these polymorphisms could help predict the onset and severity of AS, allowing for earlier intervention and potentially improved patient outcomes.
Further research is necessary to elucidate the mechanisms by which these genetic variations contribute to AS pathology and to explore their potential as targets for therapeutic intervention. Our study has some limitations, including the differences in sampling range between our data and the HapMap data and the use of tagSNPs instead of a full genome-wide association study. Increasing the sample size and including diverse populations in future studies will be crucial for validating these associations and enhancing our understanding of the genetic basis of AS.
By advancing our knowledge of the genetic factors underlying AS, we can move closer to personalized treatment strategies that improve the quality of life for those affected by this debilitating disease. Future efforts should focus on integrating genetic insights with clinical practice to develop comprehensive management plans for AS patients.
Footnotes
Acknowledgments
The authors would like to thank Prof. Yan Wang’s and Prof. Wei Chai’s students at PLA General Hospital for blood sample collection. Finally, the authors would like to thank all the participants, AS patients, and normal controls for their cooperation.
Authors’ Contributions
Z.L.: conceptualization, data curation, methodology, and writing—original draft. W.L.: conceptualization, investigation, methodology, and writing—review and editing. J.L.: data curation. J.W.: data curation. W.C.: funding acquisition. Y.W.: funding acquisition. S.S.: writing—review and editing. X.M.: funding acquisition, validation, and writing—review and editing.
Author Disclosure Statement
The authors declare no conflict of interest.
Funding Information
No funding was received for this article.

References
Supplementary Material
Please find the following supplemental material available below.
For Open Access articles published under a Creative Commons License, all supplemental material carries the same license as the article it is associated with.
For non-Open Access articles published, all supplemental material carries a non-exclusive license, and permission requests for re-use of supplemental material or any part of supplemental material shall be sent directly to the copyright owner as specified in the copyright notice associated with the article.
