
Abstract
Abstract
Introduction
Materials and Methods
Methods
A prospective observational study performed between July, 2007, and May, 2009, in the department of gynecology at the Jawaharlal Institute of Postgraduate Education and Research, in Puducherry, India. The study included 113 patients who were diagnosed with ovarian tumors clinically or via USG. Patients with recurrent ovarian masses and masses found during pregnancy were excluded from this study. After obtaining informed consent from each participant, a detailed history and physical examination were performed. The parameters studied were age, menopausal status, CA 125 levels, and USG features. Transabdominal USG was performed using a 3.75 MHz abdominal transducer (Toshiba Model SSA-340 A, Shimoishigami, Otwara-Shi, Tochigi-Ken, Japan). Sonographic markers/characteristics were noted per Tingulstad et al. 3 and Ferrazi et al. 2 USG scores were noted as per the 2 researchers criteria separately. Five mL of venous blood was collected and allowed to clot. Serum was separated by centrifugation at room temperature. Serum CA 125 levels were assayed by the UBI MAGIWEL Ovarian cancer CM-601 quantitative solid-phase enzyme-linked immunosorbent assay (United Biotech Inc, Mountain View, CA 94041).
RMI 2 was calculated by using absolute values of CA 125×M×U. M represents menopausal status, a value of 1 was assigned to premenopausal status and a value of 4 was assigned for postmenopausal status. U represents the USG score per Tingulstad et al.'s criteria. 3 A total score of 0 or 1 was considered to be U=1 and a score of 2 or more was considered to be U=4. The USG features noted, per Tingulstad et al., were: whether a cyst is multilocular or unilocular, bilateral or unilateral; the presence or absence of solid areas; the presence of ascites and intrabdominal metastasis. U was 1 when no abnormality or a single abnormality was present, and U was 4 when more than 2 abnormalities were noted.
All women were subjected to staging laparotomy, and surgicopathologic staging was reached. Histopathologic diagnosis was considered to be the “gold standard” for defining the outcomes, and malignant tumors were staged according to the International Federation of Gynecology and Obstetrics (FIGO).
Statistical analysis
SSPS version 15 software was used. A t-test was used to compare the individual parameters and a Mann-Whitney's U-test was used to compare the scores. Receiver operative characteristic (ROC) curves were used to determine the best cutoff scores.
Results
The clinical profile of the patients is shown in Table 1. The mean age of the participants was 40, and the mean age at menopause was 46 among 27 postmenopausal women in this series. The most common symptom was pain in the abdomen, followed by a mass in abdomen. Table 2 shows the histopathologic diagnoses of ovarian tumors. Among 113 tumors, 86% were diagnosed as benign and 14% were diagnosed as malignant according to histopathologic examination. The most common benign tumor was a serous cyst adenoma and the most common malignant tumor was a serous cysadenocarcinoma. Table 3 shows the staging of malignant ovarian tumors per FIGO staging. Thirty seven percent of the tumors were in stage I. Table 4 shows the performance of the RMI 2 at various cutoff values for predicting malignancy. According to the ROC curve, the best cutoff value was 100 with a negative predictive value (NPV) of 92%, a positive predictive value (PPV) of 35%, a specificity of 84%, and a sensitivity of 56%. Table 5 shows the best cutoff value of the Ferrazzi score was 8, at which the sensitivity of the test was 81%, specificity was 82%, and a negative predictive value of 96%.
Bolding indicates subtotals of benign and malignant tumors.
S. No., serial number.
FIGO, International Federation of Gynecology and Obstetrics.
Bolding represents most significant results.
RMI, risk malignancy index, PPV, positive predictive value; NPV, negative predictive value.
Bolding represents most significant results.
PPV, positive predictive value; NPV, negative predictive value.
Table 6 shows the comparison of RMI 2 and Ferrazzi scoring, along with other parameters of prediction for malignancy. The p-values for serum CA-125, RMI 2, and Ferrazzi scoring were p 0.0002, p 0.0006, and p<0.0001, respectively. When these three parameters were compared with ROC curves, Ferrazzi scoring was found to be the most accurate predictor of malignancy at all cutoff values with a maximum area under the curve (AUC) of 0.89 (Fig. 1) at a 95% confidence interval.
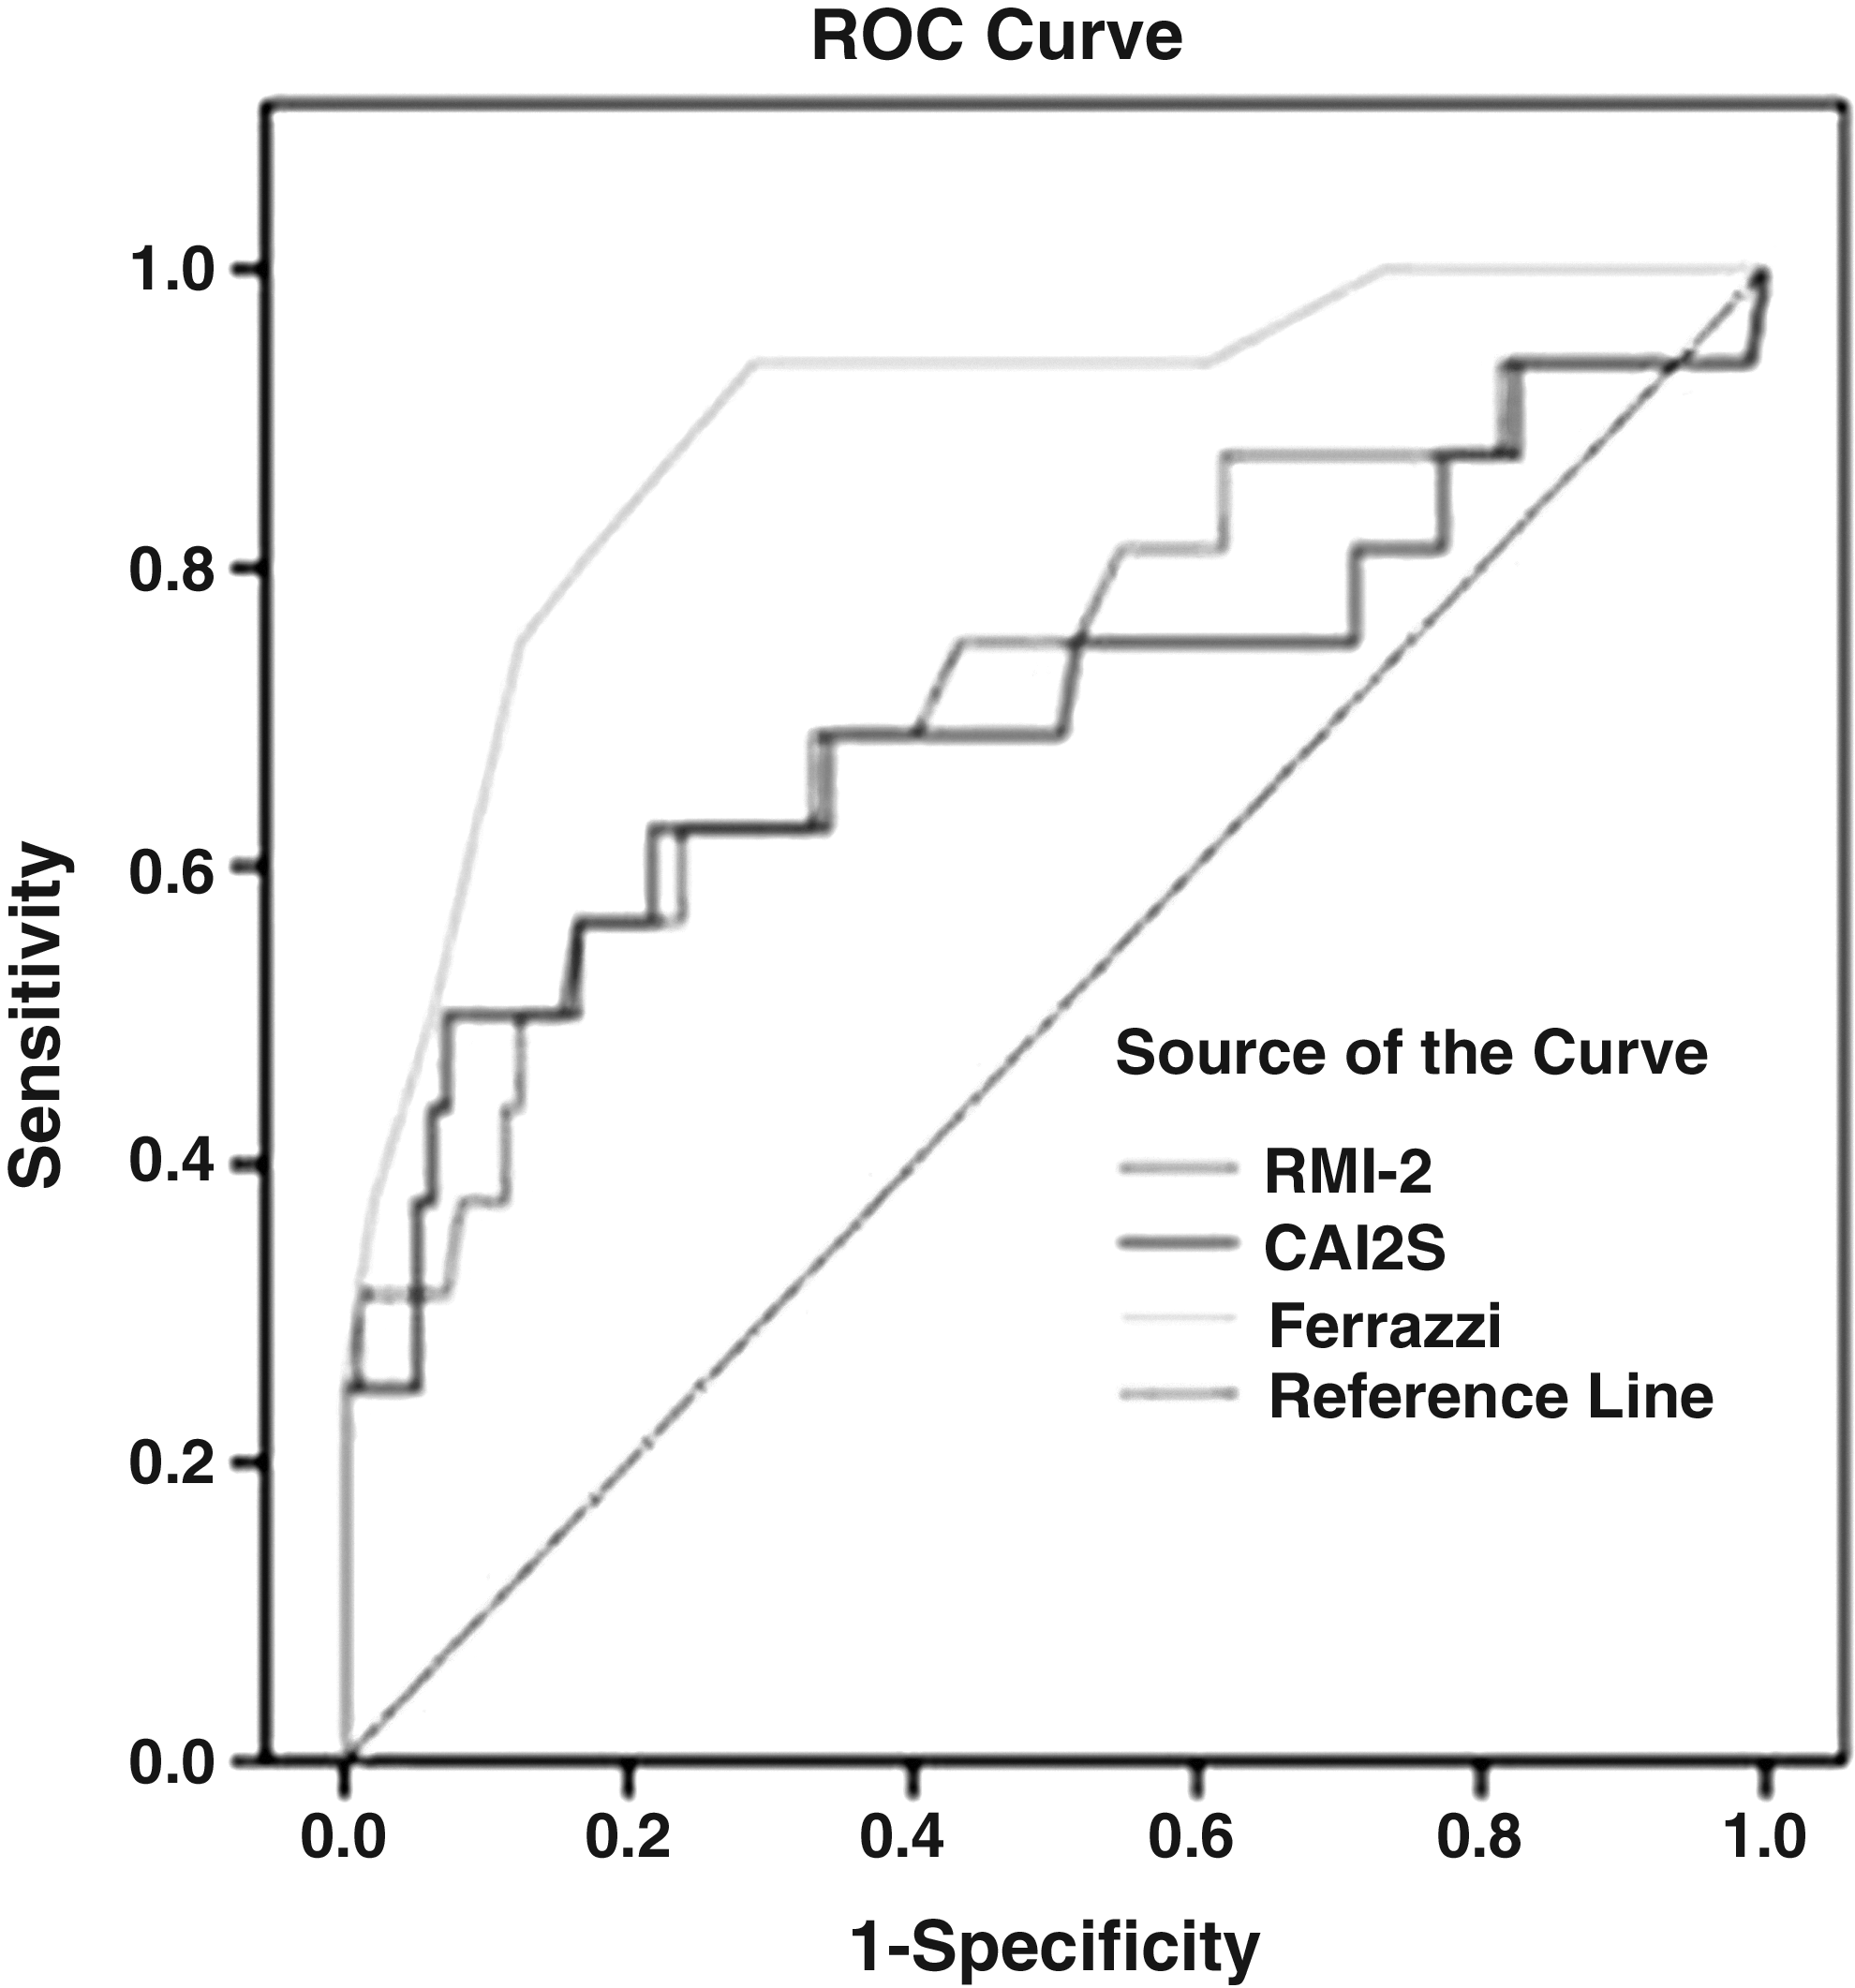
Comparison of receiver operating characteristic (ROC) curves.
S. No., serial number. RMI, risk malignancy index,
Discussion
The discrimination between malignant and benign tumors is an important step in the preoperative evaluation of ovarian masses as this helps in planning the surgical procedure. Used alone, the diagnostic accuracy of demographic and biochemical variables is not good enough for clinical use. Hence, various combined variables were developed, such as the RMI and artificial neural network, but they are complicated and costly. Ferrazzi scoring is one of the descriptive morphologic scoring systems that have been developed as less-expensive alternatives. The validity of this scoring system has not been tested by many researchers.
In the present study, 86% of the tumors were benign and 14% were malignant; this comparable to the series of Morgante et al., who reported 75% benign tumors and 25% malignant tumors. 1 However, Manjunath et al. found a high incidence of malignancy (64% of 152 ovarian masses). 4 This was a retrospective study of 152 women with ovarian masses, and the USG scores were also calculated retrospectively based on the records. Tingulstad et al. reported 32% malignant tumors in 173 patients, and 43% of these tumors were in stages I or II. This was a prospective study using RMI 2. 3 In the present study 37% of malignancies were in stage I, although the incidence of malignancy was only 14%. The most common malignant tumor in the present study was cystadenocarcinoma, which was consistent with other studies.4–6 But Ulusoy and colleagues reported 20% of malignancies that were mucinous cystadenocarcinomas, which is a higher percentage compared to the present study. 7 In the present study, menopausal status as a single variable was found to be statistically significant in predicting malignancy with a sensitivity of 62.5%, aspecificity of 72%, a PPV of 27%, and an NPV of 92%. This is comparable with other prospective and retrospective studies. Tingulstad et al. reported 80% of malignancies occurring in postmenopausal women, whereas, in the present study, 63% of malignancies occurred in postmenopausal women. The mean CA-125 levels in malignant tumors was 251.1 in the present study, which was much lower than the other studies. The best cutoff value of CA-125 was determined to be 35 international units (IU)/mL using the ROC curve. Sensitivity at this cutoff value was 50%, specificity 92%, PPV was 50%, and NPV was 92%. Einhorn and collegues obtained the same cutoff value with a sensitivity of 78%, a specificity of 93%, a PPV of 75%, and an NPV of 93%. 8 Similarly Olivier and colleagues' reported a specificity of 96% and an NPV of 99% at a CA-125 cutoff level of 35 IU/mL. 9 But Morgante et al. described a cutoff level of 50 IU/mL to have best specificity of 95% and an NPV of 92%. 1 Similar results were obtained by Tingulstad and colleagues. 3
In the present study the best cutoff value of RMI 2 for predicting malignancy was 100, which much lower than the other studies.1,3,9 The probable reason is that a higher percentage of malignancies (37%) occurred in premenopausal women, compared to what occurred in other studies (19% 10 and 20% 3 ). RMI 1 at a cutoff of 200 had a sensitivity of 85%, and the specificity was 97%. Patients with an RMI score of >200 had, on average, 42 times the background risk of cancer than patients with a lower value of 0.15 times the background risk. 10 RMI 2, which produces a score of 4 for postmenopausal status, versus 3 in RMI 1, was found to have a significantly better predictive value for malignancy than RMI 1 (McNemar test p<0.001) at the same cutoff of 200. The sensitivity of RMI 2 at this cutoff was 80%, and the specificity was 92%, with a PPV of 83%. 3 The RMI 2 at a cutoff level of 125 had a sensitivity of 81% and a specificity of 90%, and, for all cutoff values, RMI 2 performed better than RMI 1. 1 The present study, which showed an RMI 2 of 100, had a specificity of 84% and a an NPV of 92%, although the sensitivity was 56%.
The best cutoff value for Ferrazzi scoring in the present study was 8 with an 82% specificity and a 96% NPV. This is comparable to that of Ferrazzi et al., which had a specificity of 77% and an NPV of 99% at a cutoff level of 8. Daponte et al. reported a higher specificity of 100% and an NPV of 93% at the same cutoff level of 8 using the Ferrazzi scoring system on a population of 100 premenopausal women. The RMI 2 of 150 had a specificity of 86.5% and NPV of 93.9%. Based on their findings Daponte et al. concluded that Ferrazzi scoring can be strongly recommended for prediction of malignancy preoperatively. 11 Malignant tumors in the present study had a significantly higher mean score of 9.56 than benign tumors with a mean of 5.38 (p<0.0001). This is comparable to the study of Ferrazzi et al. with mean scores of 11.69 for malignant tumors and 6.6 for benign tumors. When RMI 2 and Ferrazzi scoring were compared, Ferrazzi scoring emerged as a best predictor with a higher area under the ROC curve of 0.890. Ferrazzi scoring had better sensitivity, specificity, and predictive values at its best cutoff of 8, compared to the best cutoff level of RMI 2. Daponte and colleagues also reached the same conclusions. 11 The Ferrazzi scoring system is a detailed morphometric USG score, which may explain its superiority. Other morphologic scoring systems applying US by Sassone et al. 12 and De Priest et al. 13 are in use. A score of 9 or more by Sassone et al. 12 predicts malignancy with sensitivity of 100% and a specificity of 83%. The problem with this is the description of echogenicity, which will become subjective according to the assessor. The scoring system of De Priest et al. 13 uses tumor volume, which may be difficult to measure when a tumor is large.
Conclusions
The Ferrazi method of scoring was found to be a better predictor malignancy, compared to the RMI 2 (p<0.0001), and the Ferrazi method is simple, fast, and inexpensive. It can be performed by a general gynecologist, which would allow a reliable referral of malignant tumors to a specialist gynecologic oncologist for optimal therapy.
Footnotes
Disclosure Statement
No competing financial conflicts exist.