
Abstract
Abstract
Introduction
T
Failed microinsert placement can lead to patient dissatisfaction; repeat procedure attempts; unintended or ectopic pregnancy; perforation of the Fallopian tube, uterus, or other internal organs; or the necessity for subsequent medical interventions, such as removal of an incorrectly placed microinsert, laparoscopic-device removal from the peritoneal cavity, or tubal ligation. 2 These additional medical interventions increase health risks for women and costs for both the patients and the health care industry. Demonstrated successful placement rates are between 63% and 100%.2–65 Some explanations for placement success include procedure-related factors such as an in-patient setting,16,21 a shorter procedure time, 3 greater provider experience,3,5 and various types of medications and medication procedures.3,5,7, 21,22,29,38,47 Placement success associated with patient-related factors include prior use of an intrauterine device (IUD), 13 a history of sexually transmitted infections (STIs), 33 a lower body mass index (BMI), 11 and follicular phase of the menstrual cycle.8,11,22 To date, there are no systematic analyses of variables associated with placement rates.
The purpose of the current study was to utilize meta-analyses to (1) identify the average rate for successful bilateral Essure microinsert placement on first attempt, and (2) identify variables associated with these successful placement rates.
Furthermore, the medical literature reveals that there disparate definitions of what constitutes, and how to calculate, a successful placement rate. Rationales vary for different calculations; for example, if the determination of a success rate is the outcome of full sterilization, multiple sterilization attempts could be included. In this article, however, an attempt is made to standardize the data from multiple studies into a consistent definition: successful bilateral microinsert placement on first procedural attempt. This is the manufacturer's definition and it is useful to patients, practitioners, and researchers.
Materials and Methods
A meta-analysis was conducted on successful bilateral Essure microinsert placement rates on first procedural attempt and potential variables associated with successful placements.* For study selection, the second and fourth authors utilized PubMed, in addition to Google Scholar, which is also a powerful search tool for identifying citation sources. 66 Snowballing (pursuing references from acquired articles' references) was also utilized; this is a particularly powerful method for finding high-quality sources in obscure locations. These multiple methods increased the likelihood of detecting relevant articles. 67
Preferred Reporting Items for Systematic Reviews and Meta-Analyses (PRISMA) guidelines
68
were followed for study inclusion. All combinations of the keywords
Articles that were not original research studies on Essure (n=1692) were excluded. For example, the word
Other exclusions were studies on the Adiana (another hysteroscopic sterilization device used in the past) or review articles. Other exclusions included: use of Essure for other medical purposes (e.g., in-vitro fertilization; n=39); data only on the follow-up appointment (e.g., adherence rates, technology evaluation; n=30); postprocedural complications only recorded (e.g., perforations, pregnancies; n=28); product development (n=6); non–peer-review publications (e.g., conference proceedings or posters; n=16); fiscal cost analysis (n=4); procedural tips (n=4); language unknown to any research team members (n=17); nonhuman species (n=4); and case reports (n=16). This left 102 articles for full-text review. Forty-six additional studies were excluded after full-text review for the following reasons: insufficient data (no first attempt or no placement rate given; n=28); not an original research study on Essure (n=9); only provided data on the follow-up appointment (n=4); cost analysis with no placement rate given (n=1); pain assessment with no placement rate given (n=3); and a mixed analysis of both the Essure and Adiana (n=1).
Consistent with the snowball method, 67 the references of the 56 selected articles were reviewed to identify additional pertinent articles. This yielded 12 additional articles that were reviewed, with 8 that met inclusion criteria, for a total yield of 64 articles (Fig. 1). If more than one article was written by the same author(s), the current authors verified that the results were not based on identical patient populations by assessing the research year(s) and sample sizes. Several articles selected were in French31,32,48,64,65 and were read and translated by the second author.
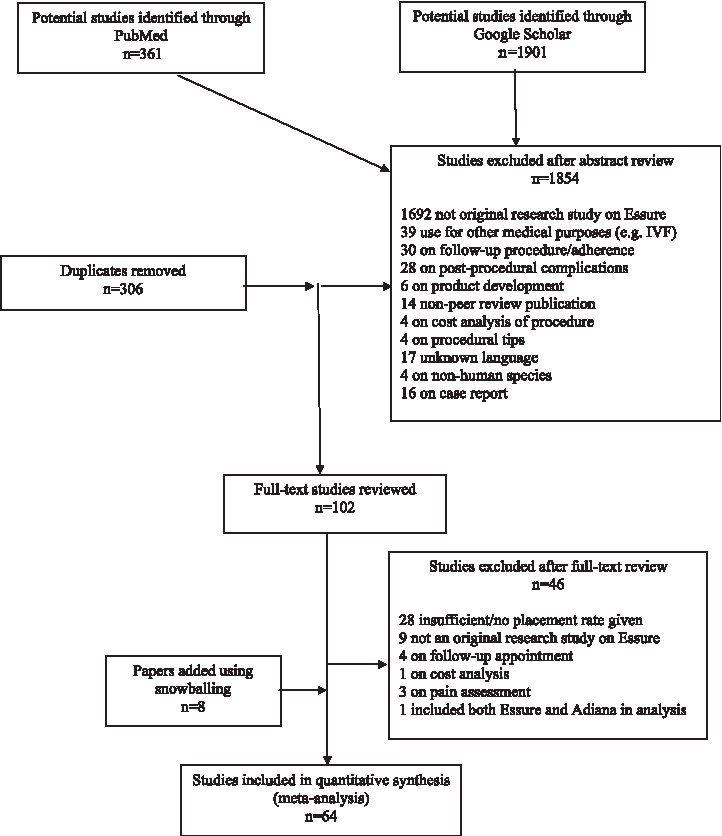
Flow diagram for final sample size of Essure placement rate.
Data presented in the articles were utilized and raw data were not obtained from the article authors. Some articles required converting means into percentages,36,42 and because use was made of a clinically significant definition of placement rate—the ability to place any number of Essure microinserts into both Fallopian tubes successfully upon first procedural attempt—several statistics were converted, which are described below.
Several studies compared two groups of women,48,57,59,62 whom were combined into one sample size; means for each group were calculated into raw numbers based on their individual sample sizes and then one mean for both groups was calculated with a weighted average. Four studies included separate placement rates for study group subsets but did not supply overall placement rates,7,17,21,29 thus, the total number of placements in both groups was divided by the total number of patients in each study. For one study 61 only one group was included because the second group met the current review's exclusion criteria.
Some studies omitted failed attempts in their placement rates because of the inability to visualize the tubal ostia,5,15,20,32,35–37,48 yet the current authors considered these attempts as failures because the procedures were actually attempted. Thus, the total number of attempts was used as the denominator. Several studies included unilateral placement rates in women who had previous salpingectomies,13,22,48 so these placement rates were omitted from the total denominators and numerators as necessary. Eight articles9,10,17,19,25,26,30,56 only reported bilateral placement rates after more than one attempt. In these cases, the placement rate was recalculated using the data supplied in the article for the first attempt. Finally, if studies had exclusion criteria of their original cohort size, 5 wherein women were excluded before the procedure was attempted, the original cohort size was not used as the denominator. Instead, the current authors included only those women for whom the procedure was attempted.
The extracted variables were entered into an Excel (Microsoft Office 2010 for Windows) spreadsheet as follows:
(1) Study data—author(s); study type; months and years when, and country/ies where, the research was conducted; and author(s) funding from the Essure manufacturer (2) Target population data—number of patients; means for BMI, age, gravidity, and parity; and percent of patients in the menstrual follicular phase and contraceptive use (3) Procedure data—Essure device model(s); number of practitioners who performed the procedures; mean operating time; type of medication(s); and percent of patients medicated, prior to or during the procedure; and percent of patients with an IUD in situ, patients undergoing concomitant intrauterine procedures, in outpatient settings, and first attempt bilateral placements.
Meta-analytically combining the placement rate results from several studies into one average placement rate (i.e., effect size) surrounded by a 95% confidence interval (CI) requires a normally distributed sampling distribution; thus, placement success rates were transformed into logits to both approximate a normal distribution and correct for overestimation of heterogeneity. 67 These logit success rates were subsequently weighted by the inverse-variance, which is standard in meta-analysis in order to account for the differences in each study's sample size. When merging the results of multiple studies into one dataset, it is inaccurate to take the average of all results, because each study has a different sample size, wherein studies with larger sample sizes will provide less variance and thus more precise estimates. In other words, if the average was taken from all the studies instead of the inverse-variance, studies that are less precise would hold as much weight as studies that are more precise. Thus, the logit transformed placement rates were multiplied by the inverse-variance to give more weight to studies with more precision. Standard errors were calculated and logit transformed placement rates were combined.
Finally, the logit placement rates were back-transformed by calculating the anti-log, in order to provide a single placement success rate of all the studies combined. Furthermore, a sensitivity analysis was run in Comprehensive Meta-Analysis (CMA) version 2 (Biostat, Englewood New Jersey) to determine if one of the studies that contained a considerably larger sample size 2 than the other studies affected the results profoundly.
The trim and fill algorithm was run in CMA to assess publication bias, 69 which imputes an estimated number of missing studies that could bias placement rates. A fixed effects model (FEM) and a random effects model (REM) were also run, because each approach yields valuable information. 70 The FEM was used to test if all of the samples estimated the same underlying population and provided a placement rate unique to the samples analyzed. The REM yielded generalizable results and was used with the assumption that the samples were heterogeneous because of differences in sample characteristics. With no a-priori hypotheses in mind, exploratory meta-regressions were then run; this is a meta-analytic technique used to test the sample characteristic variables (i.e., moderator variables), with “Methods of Moments” in CMA, which enabled the examination of variable associations with variations in placement success rates.
As recommended, meta-regressions were only performed when data were available from ten or more studies for each variable. 71 Therefore, variables with insufficient data, such as history of cesarean sections, ectopic pregnancies, STIs, and tobacco and drug use; epidural and regional anesthesia; type of insurance; and outpatient setting were omitted from the analysis. The country/ies where the Essure procedures were performed were also excluded from the analysis, because a method for categorization (i.e., dummy coding) was unclear because of multi-country and single-country studies.
The meta-regressions were used to assess associations with placement success rates related to 19 potential variables (i.e., moderators; Table 1). The first variable (1) was Essure device model. Based on the study months and years, the device model(s) were dummy coded as follows: 0=STOP [Selective Tubal Occlusion Procedure]; 1=1st model; 2=1st and 2nd models; 3=2nd model; 4=2nd and 3rd models; and 5=3rd model. The second variable (2) was mean BMI. If the study reported mean height and mean weight, these were converted into BMI.
Note: Certain data were not available for all studies; thus, the number of studies varies for each variable.
The Essure model was dummy coded as follows: 0=STOP [Selective Tubal Occlusion Procedure]; 1=1st model; 2=1st and 2nd models; 3=2nd model; 4=2nd and 3rd models; and 5=3rd model.
The variable measuring Essure funding was dummy coded as follows: 1=authors who reported funding from Conceptus (the company that owned Essure at the time; now Essure is owned by Bayer HealthCare Pharmaceuticals, Leverkusen, Germany) or conflicts of interest from funding; and 2=authors who did not report funding from Conceptus and had no conflicts of interest.
Study types were coded as: 1=prospective; and 2=retrospective.
N, number of studies; SD, standard deviation; BMI, body mass index; IUDs, intrauterine devices; IV, intravenous.
Other variables included: (3) if authors received funding or reported conflicts of interest from the Essure manufacturer; (4) study type (prospective or retrospective); (5) percent of patients who underwent concomitant intrauterine procedures; (6) percent of patients who had IUDs in place during the procedure; (7) percent of use of any type of hormonal contraception; (8) percent of patients in the follicular phase of the menstrual cycle; (9) percent of use of local anesthesia; (10) percent of use of general anesthesia; (11) percent of no anesthesia used; (12) percent of use of analgesics; (13) percent of use of intravenous sedation; (14) percent of patients who were premedicated; (15) mean operating time reported in minutes; (16) number of practitioners who performed the procedures; (17) mean patient age; (18) mean patient parity; and (19) mean patient gravidity. In addition to the meta-regression analyses, a weighted average for successful bilateral microinsert placements was calculated for each of the 19 variables (Table 2).
Notes: Meta-regressions were performed using methods of moment/mixed methods regression. Random-effect models were used to provide subgroup placement success rates. β=Slope; R2=the coefficient of determination.
Essure model was dummy coded as follows: 0=STOP [Selective Tubal Occlusion Procedure]; 1=1st model; 2=1st and 2nd models; 3=2nd model; 4=2nd and 3rd models; and 5=3rd model.
Categorical variable.
Continuous variable.
The variable measuring Essure funding was dummy coded as follows: 1=authors who reported funding from Conceptus (the company that owned Essure at the time; now Essure is owned by Bayer HealthCare Pharmaceuticals, Leverkusen, Germany); and 2=authors who did not report funding from Conceptus.
Dichotomous variable.
Study types were coded as: 1=prospective; and 2=retrospective.
CI, confidence interval; BMI, body mass index, IUD, intrauterine devices; IV, intravenous.
Results
Sixty-four studies reporting Essure microinsert placement rates on data collected from 19,307 patients were included in the analysis. Study sample sizes ranged from n=8 to n=4306. Successful placement rates ranged between 60% and 99% (0.6 and 0.99). The FEM produced the weighted average logit placement rate of 2.372 (95% CI: 2.136–2.427), which yielded a significant, back-transformed weighted average placement rate of 92% (0.919 [95% CI: 0.910–0.919]). Results from heterogeneity testing suggested that 1 or more of the 64 studies came from different populations (Q=494.33; degrees of freedom [df]=63; p<0.001; I 2 =87.255). The weighted average logit placement rate yielded in the REM was 2.424 (95% CI: 2.244–2.604), with a back-transformed weighted average placement rate of 92% (0.919 [95% CI: 0.904–0.931]; Fig. 2).
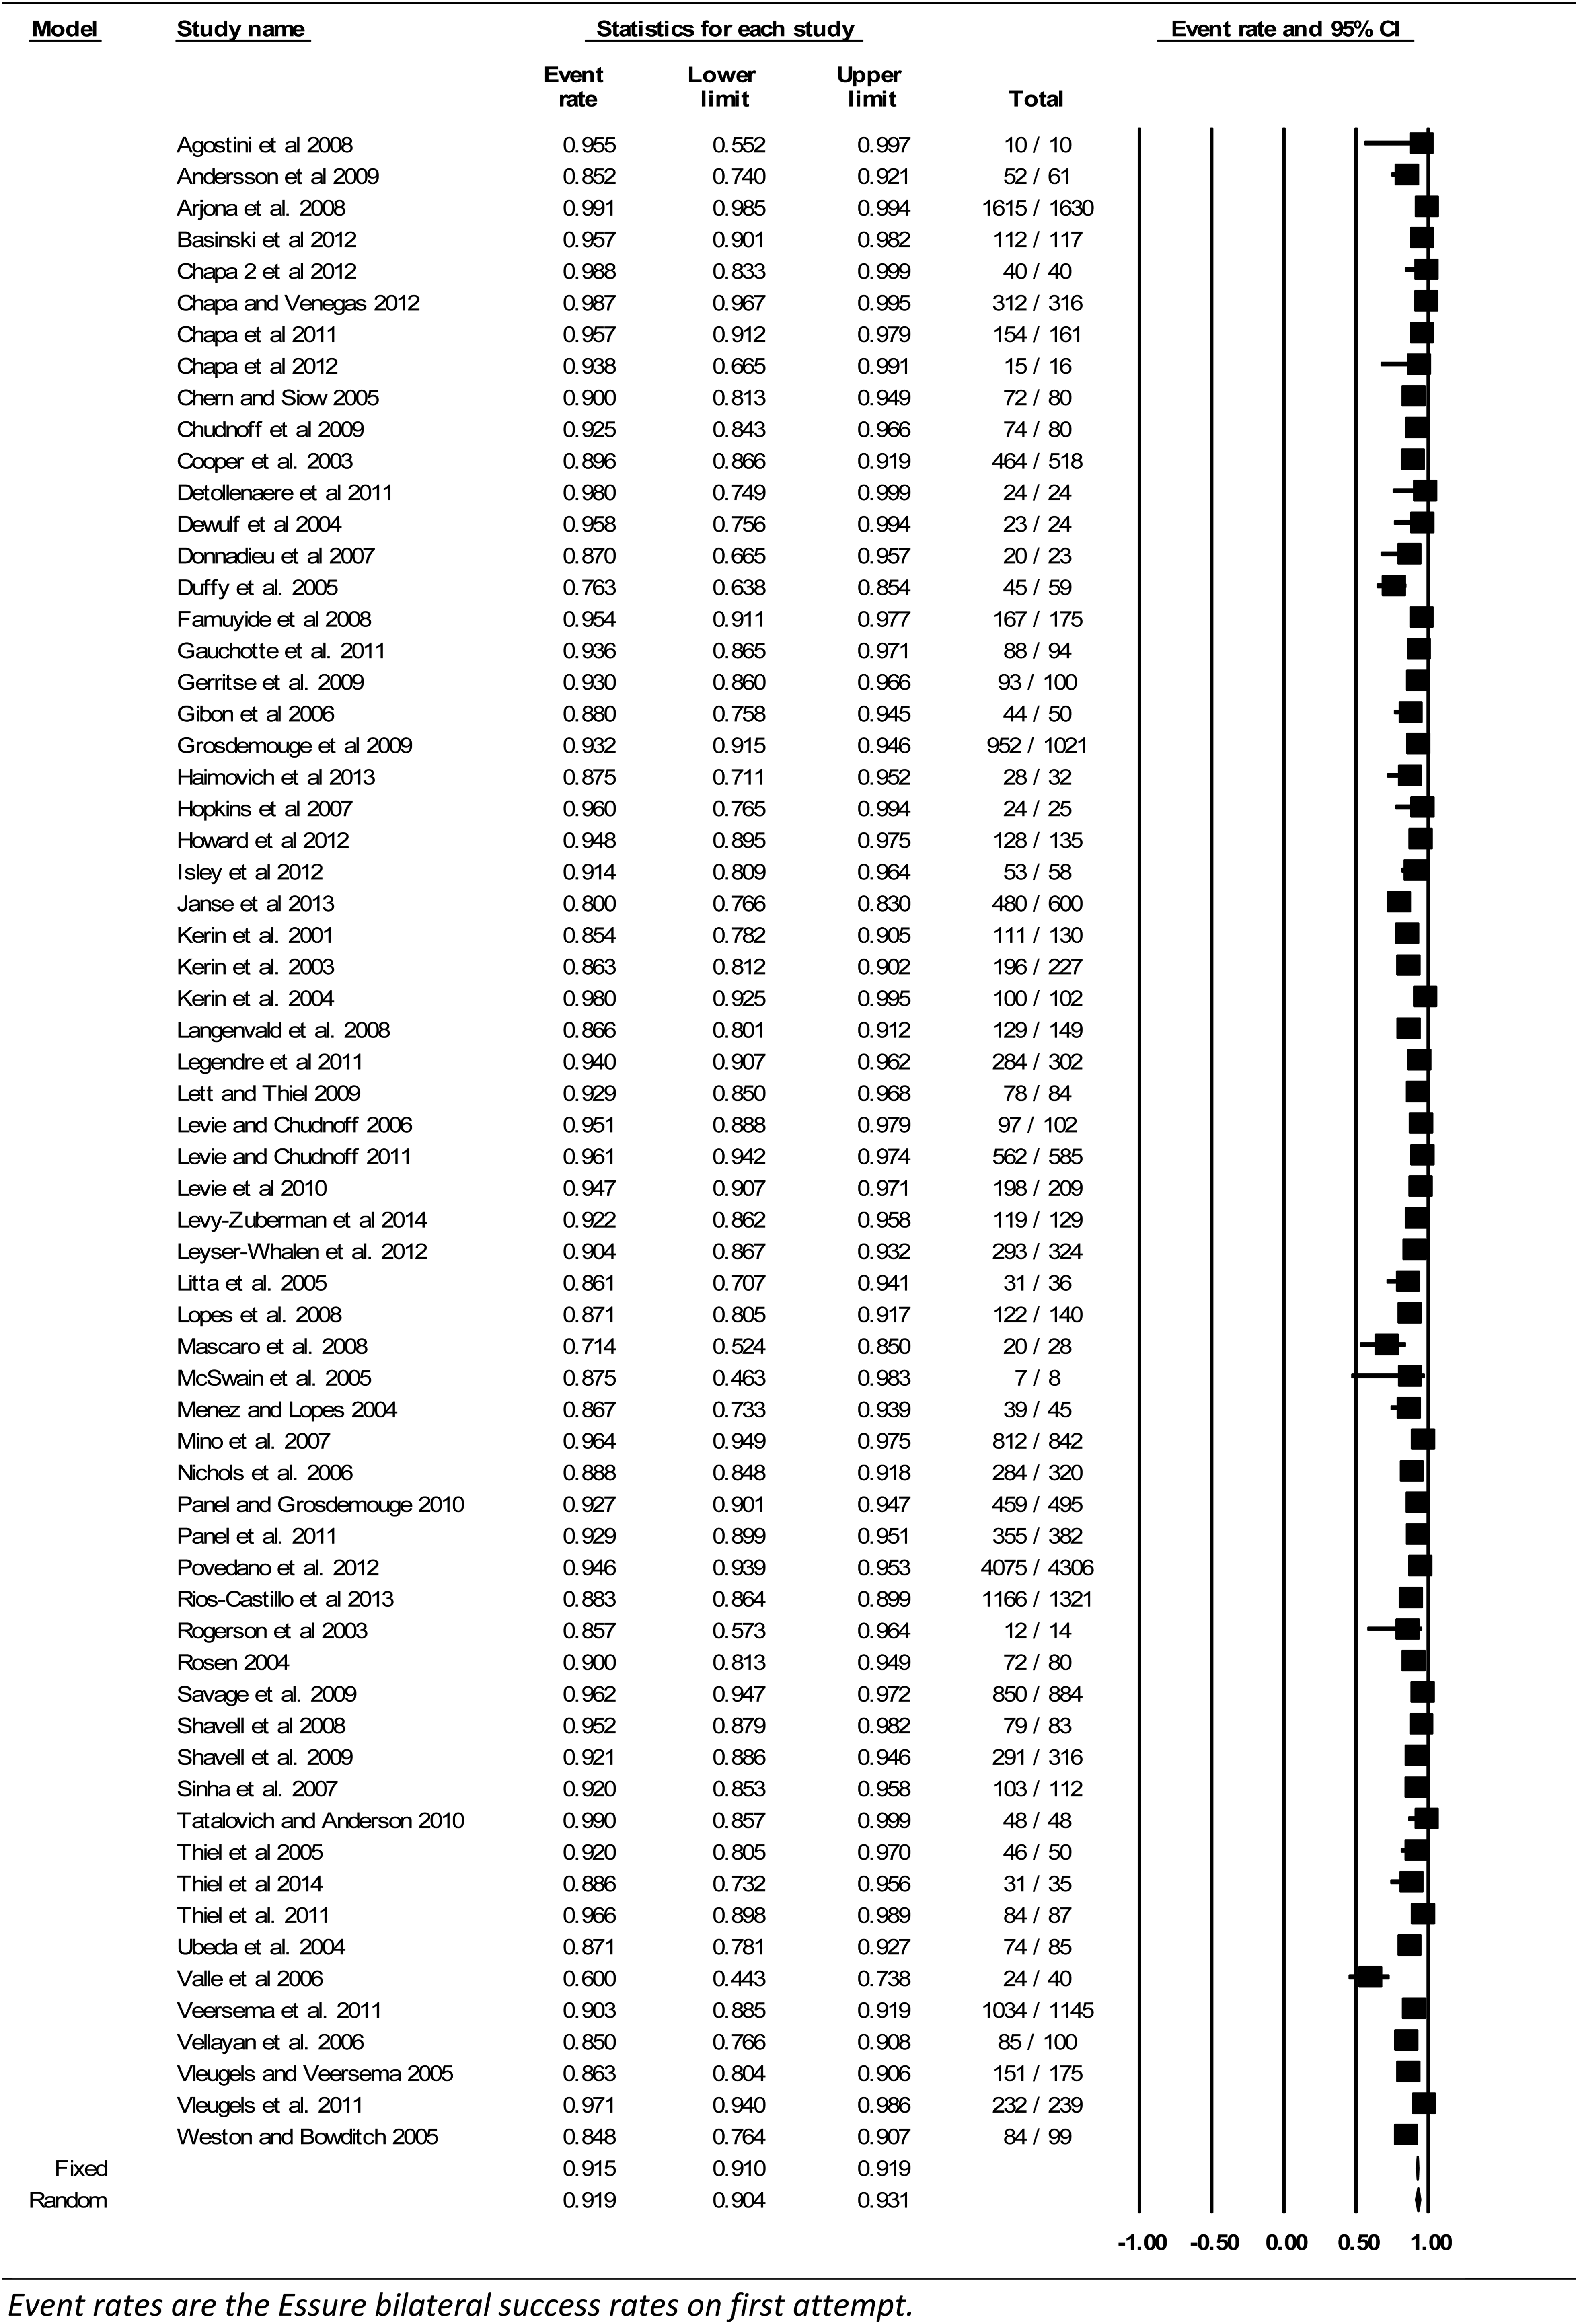
Forest plot of placement success rates (n=64).
The trim and fill procedure to assess publication bias was applied under the REM, and four studies were estimated to be missing; yet, this procedure produced a placement rate that was extremely close to the original REM, 91.4% (0.914 [95% CI: 0.910–0.919]), indicating that the effect of adding additional studies that may have been missed would neither reduce nor inflate the placement rate. Furthermore, the Classic Fail-Safe N was utilized as another method for assessing publication bias. The results showed that there would need to be 6332 nonsignificant findings to invalidate the placement rate that was found in this meta-analysis. Finally, the sensitivity analysis yielded an REM of 92% (0.918 [95% CI: 0.903–0.931]), suggesting that nearly no change was detected by removal of a study 2 that contained a considerably larger sample size than the other studies in the analysis.
It was not possible to analyze covariates as a result of the combination of large p-values and small df. Subgroup analyses on each of the 19 moderator variables yielded pooled placement rates that ranged between 90% and 95% (0.904–0.946). The bivariate meta-regression results suggested that each refinement of the Essure device model predicted a 0.18-unit increase in successful placement rate. The percentage of patients who received local anesthesia was also significantly associated with an ∼0.01 unit increase in successful placement rate (Table 2).
Every unit increase in BMI was significantly associated with a 0.13-unit increase in successful placement rate. Because studies were weighted by the inverse of the variance, more weight in the initial analysis was given to a study with patients with higher BMI and a higher placement rate. Thus, this analysis was re-run with the exclusion of two studies: one with the lowest mean BMI (24.09) and a large variance (0.232) with an 86% (0.861) placement rate, 30 and one with the highest mean BMI (32.7) that also had one of the smallest variances (0.043) with a 92% (0.921) placement rate. 3 The direction of the placement rate remained unchanged after excluding these two studies (93%, REM 0.924 [95% CI: 0.902–0.942]); higher BMI seems to be significantly associated with more successful placements.
Discussion
Currently, smaller and individual studies report on associations between provider- and patient-related variables and Essure placement rates, or systematic reviews on Essure focus on more narrow topics such as pregnancy rates. 72 The current meta-analysis augments this literature by: (1) drawing a large amount of data on successful, first-attempt bilateral placement rates from a plethora of studies with different populations; and (2) pooling these data to identify potential moderator variables while reducing random error.
The meta-regressions in this current review yielded three significant findings. First, as Essure models were refined, successful placement rates increased (Table 2). Because the majority of the studies were conducted over a time period that utilized only one device model, some with multiple practitioners with varying levels of experience, the current authors cannot attribute these results to increasing provider experience. Similarly, provider experience was not associated with successful placement in a large, multicenter, multiphysician study. 44
Whereas the current authors estimated Essure model by the study years, it was not certain if some clinicians used older models after the newer models emerged. Furthermore, because the studies came from different countries, some with multiple countries in the same study, the estimate was not 100% precise—for instance, the first model was approved in Europe in 2001, and in the United States in 2002. 73 Thus, these data are estimates, yet clearly show a trend and may be important to consider as newer models are developed. 74
Second, another notable finding was the significant association between higher BMI and successful placement, which mirrors a newer study that reveals that obese women had fewer complications with the Essure procedure compared to laparoscopic tubal ligation, 75 which may suggest that women be counseled differently on sterilization options. The current authors cannot state with certainty, however, that selection bias did not confound these data. For example, physicians may choose Essure preferentially in heavier patients because these physicians view such patients as worse laparoscopic tubal candidates; or physicians may preferentially counsel multiparous women toward Essure (because of increased ease in cervical entry) and those women often have higher BMI and are potentially less likely to have fertility-compromising uterine anomalies.
Third, several anesthetic approaches were analyzed—including no anesthesia use—yet only local anesthesia was significant. The effect, however, was not strong. Thus, the findings indicate that researchers should use more standardized and comprehensive reporting of variables in Essure studies to increase sample sizes to improve knowledge of variable associations that may moderate procedure efficacy—not only for successful bilateral microinsert placement but also with respect to other components of the hysteroscopic procedure.
Small sample sizes also restricted the ability to examine some potentially clinically useful variables. For example, clinically, the current authors know that hormonal contraception may be a significant predictor, because this kind of contraception alters the endometrial lining. 76 Even with small sample sizes for hormonal contraceptive use, (1) the confidence interval was on the cusp of including 0; (2) p=0.08; and (3) the df were only 13—all of which could indicate that the variable was close to significance. Thus, the current authors recommend that future studies include information on variables that were found to be close to significant (i.e., hormonal contraception). Furthermore, small sample sizes limited the current review study to bivariate analyses. Larger sample sizes would allow for covariate analyses that can show interaction effects between variables. For example, one could analyze the association between device model and practitioner experience, or between stage of the menstrual cycle and use of hormonal contraception.
The data collection process directed attention to another issue—the inconsistency in studies in what is defined and reported as a successful attempt. For example, some studies omitted failed attempts in their success rates.15,20,32 The current analysis included these attempts because the current authors believe that these calculations reflect a general patient population better that physicians treat on a daily basis. It is recommended that researchers be cognizant of overall patient populations when calculating placement rates, so patients can be given the most accurate information. Another consideration surrounding the issue of patient populations is that some studies in this analysis reflect general patient populations, whereas other analyses excluded patients for having certain characteristics that may influence placement rates, such as history of pelvic inflammatory disease. Thus, the current analysis cannot account for this type of selection bias in—or the overall quality of—the contributing studies.
Publication bias can be a significant problem in meta-analyses, which generally refers to a tendency to publish results that are significant, of higher quality, or from larger, well-funded studies. Thus, excluding unpublished work could have been a limitation. However, published studies have been peer-reviewed, and moreover, as shown in the Results section, several analyses were run that did not detect publication bias.
Conclusions
The current authors consider microinsert placement to be an important issue. Not only is failed Essure placement a frustrating experience for both patient and provider, it can also lead to repeat procedure attempts; unintended or ectopic pregnancy; perforation of the Fallopian tube, uterus, or other internal organs; or the need for subsequent medical interventions, 2 which increase health risks for women and costs for patients and the health care industry. Expanded knowledge about variables that can predict successful Essure procedures not only has the potential to increase placement rates for future Essure procedures, but may also inform practitioners better who are counseling patients.
Footnotes
Acknowledgments
The authors extend thanks to Lawrence D. Cohn, PhD, in the department of psychology of The University of Texas at El Paso, for his complementary statistical advice.
Federal support for this study was provided by the Eunice Kennedy Shriver National Institute of Child Health & Human Development (NICHD) as follows: Dr. Berenson, under a mid-career investigator award in patient-oriented research (K24HD043659). Dr. Leyser-Whalen, as a former NRSA postdoctoral fellow under an institutional training grant (T32HD055163; Berenson, PI). The content is solely the responsibility of the authors and does not necessarily represent the official views of the NICHD or the National Institutes of Health.
Disclosure Statement
The authors report no conflicts of interest.