




Abstract
Abstract
Objective:
The aim of this study was to examine the cut-off value of parameters related to menopause in women recruited through the Sao Paulo Epidemiologic Sleep Study.
Materials and Methods:
A household survey sample of 397 women was submitted to biochemical analysis after overnight fasting for determination of follicle-stimulating hormone (FSH), luteinizing hormone (LH), and estradiol levels. Volunteers were randomly selected to represent the population of São Paulo according to gender, age, and socioeconomic status. The cut-off values were determined from the receiver operating characteristic curve and by determining the accuracy, sensitivity, specificity, positive predictive value, and negative predictive value of the parameters.
Results:
FSH, LH, and age provided >90% accuracy for defining the menopause group. Classification of menopause according to FSH level provided the highest level of accuracy (97.0%) based on a cut-off value of 21 mIU/mL as a classifier.
Conclusions:
The cut-off value for FSH alone was able to distinguish with higher efficiency premenopause and postmenopause groups. FSH levels provided greater accuracy in the diagnosis of natural menopause, compared to the other parameters. (J GYNECOL SURG 33:236)
This study was registered with ClinicalTrials.gov (NCT00596713).
Introduction
M
Decrease of circulating concentration of estradiol is an immediate consequence of the onset of menopause. Estrogen hormones are related to the preparation of the uterus for reproduction and the determination of secondary sexual characteristics. The onset of menopausal symptoms is directly related to the gradual decrease of estradiol and progesterone, and consequently, increases of follicle-stimulating hormone (FSH) and luteinizing hormone (LH).2,3 The main consequences caused by menopause include higher risks for cardiovascular diseases, 4 obstructive sleep apnea syndrome, 5 and osteoporosis. 6 The age of onset menopause can be considered an important episode in a female's health, regardless whether menopause is caused naturally or by surgical intervention.
Levels of FSH and LH are the main parameters routinely considered in the diagnosis of menopause. Smoking, use of oral contraceptives, poor economic status, number of menstrual cycles, and family history of early menopause have been associated with earlier onset of natural menopause.7,8 The ovarian follicular consumption characteristic of the last decade of the fertile period is associated with increased FSH levels. 9 Baseline LH levels remain stable during the lifetime window of fertility and tend to increase after age 50.10,11 The goal of the present study was to evaluate accuracy of FSH and LH levels for diagnosing menopause. In addition, age and estradiol were proposed as additional parameters for assessment.
Currently, the clinical criteria used for the diagnosis of menopause are based on LH and FSH levels associated with characterization of amenorrhea for at least 12 months.12,13 This study was conducted to verify the critical levels of LH, FSH, estradiol, and age-related onset of menopause. This study was proposed to define a unique criterion that can identify women in pre- and postmenopause accurately.
Materials and Methods
Subjects
The Sao Paulo Epidemiologic Sleep study (EPISONO) was designed to evaluate parameters related to overall sleep disorders among adults in São Paulo, Brazil. 5 Volunteers were randomly selected from their households through a probabilistic three-stage cluster sampling approach to represent the population of São Paulo according to gender, age (20–80 years), and socioeconomic status. Analyses were conducted on data weighted to correct for unequal probabilities of selection into the sample. The complex survey design took into account the age, gender, and socioeconomic status of the sample members adjusted to the distribution of the target population in the city of São Paulo in 2007 (projection from the 2000 census).
The complete design and sampling methods have been described previously. 14 In the first stage, to ensure the representations of different levels of wealth, 96 districts (from the 1500 districts in which the city is divided for census purposes) were proportionally selected from the four homogenous socioeconomic macro-regions of São Paulo. Slums and shantytowns were excluded due to high criminal activity. Households were selected if they were permanently occupied private homes.
In the second stage, the selection of a given household was made by randomly picking the first home and subsequently skipping a specified number, calculated by dividing the total number of homes by a fixed number, to select 11 households in each sector. Each apartment in an apartment building was considered a household, and counting was carried out from the upper floor to the lower floor.
Finally, in the third stage of sampling, all eligible residents of each chosen household were ranged from the youngest to the oldest, and a subject was selected by means of 96 preestablished random tables, which had the rank number to be chosen for each of the 11 households, from the 96 selected districts. Substitutes were chosen from the next home, following the same random selection criteria described above. In addition, individuals were not included in the following instances: three unsuccessful attempts to contact the target individual; total refusal to participate; obstruction by a family member; or inability to participate for a specified reason.
Pregnant women were not included in the study. Figure 1 shows the flow diagram of study identification, selection, and exclusion criteria.

Flowchart regarding the criteria for selecting patients for the study.
Initially, 1101 volunteers were recruited; however 59 individuals refused to participate in the study (5.4%). The refusal group did not differ significantly from the final sample group, regarding age, gender, socioeconomic status, or subjective sleep quality 14 ; therefore, the prevalence estimates could be assumed to be free from selection bias. 5 All participants who agreed to participate in the study were considered in the current sample.
Compliance with ethical standards
All procedures performed in studies involving human participants were in accordance with the ethical standards of the institutional and/or national research committee and with the 1964 Helsinki declaration and its later amendments or comparable ethical standards.
The study was approved by the ethical committee at the Universidade Federal de São Paulo (CEP #0593/06) and was registered with ClinicalTrials.gov (NCT00596713). All of the volunteers read and signed the informed consent forms.
Clinical diagnostics
Regarding gynecologic status, the sample was represented by women identified in the premenopausal, perimenopausal, and postmenopausal stages. This classification was based on their responses to the gynecologic questionnaire and on the hormone measurements, evaluated on the morning after polysomnography. The gynecologic questionnaire included questions about menstrual cycles, premenstrual complaints, use of hormonal contraceptives, dysmenorrhea, menopause, hot flashes, and hormonal therapy.
Women diagnosed in the premenopausal stage were defined as in an ongoing menstrual cycle and in one of the following categories: follicular phase; the first 12 days of the menstrual cycle; periovulatory; near the fourteenth day of the menstrual cycle with an LH concentration of ∼50 mIU/mL; luteal phase; or the second half of the menstrual cycle. Anovulatory was defined as women experiencing amenorrhea with FSH and LH concentrations of <30 mIU/mL or hormone contraceptive use. Women in menopausal transition (perimenopausal) were described as those who had irregular menstrual cycles within the 12 months, concentrations of FSH and LH of >30 mIU/mL, and a concentration of 17β-estradiol <30 ng/mL. The postmenopausal group was defined as women who had either experienced amenorrhea for >12 months or had FSH and LH concentrations >30 mIU/mL. These classifications were determined according to the Stages of Reproductive Aging Workshop. 12
More than 1000 volunteers were recruited (N = 1042), and the sample was composed of 574 women (55.1%). Eighty-seven women undergoing hormone contraceptive use and 25 women in menopause caused by removal of the ovaries (surgical menopause) were previously excluded from the analysis. In addition, 24 women were excluded for missing values, 19 were undergoing hormone therapy, 16 had an undetermined stage, and 6 were taking isoflavone compounds. Thus, this current study was based on 397 women. The final sample was submitted to reanalysis for age and levels of estradiol, FSH, and LH. In this study, no women had amenorrhea due to gynecologic problems.
From the total of 574 women included in the study, as noted above, the final sample consisted of 397 women after the exclusions. Figure 1 shows the flow diagram of study identification, selection, and exclusion. Women were classified into the following groups: 238 premenopause and 159 postmenopause. Table 1 shows the demographic distribution of the sample in each group of women mentioned above.
Data are reported as means ± standard error of mean or frequency percentage.
BMI, body mass index; FSH, follicle-stimulating hormone; LH, luteinizing hormone.
General physical measurements were taken immediately before the subjects were prepared for the polysomnography hook-up, following recommended procedures and utilizing precise instruments; the measurements were taken by trained technicians. Body mass index was calculated as weight in kg divided by the square of height in meters (kg/m2).
Blood analysis for the outcomes (FSH and LH)
Blood was collected in the morning for hormone analysis after overnight fasting. The tubes were centrifuged at 3500 rpm for 10 minutes. The blood analysis included the following tests: FSH; LH; and 17β-estradiol (ADVIA Centaur®/Siemens Healthcare Diagnostics, Inc.). The hormone concentrations were obtained via acrinidinum ester chemiluminescence. 15 The details of within-assay and between-assay sensitivity of all the biochemical parameters have been described previously. 14
Statistical analysis
The receiver operating characteristic (ROC) curve is a plot of the sensitivity of a test versus its false–positive rate for all possible cut-off points. An ROC curve was used to determine the optimal cut-off point for age, FSH, and LH as classifiers of natural menopause. Higher values of area under the curve (AUC) suggest that the variable is closely related as the potential biomarker by a cut-off value in a clinical test. The parameter used to identify the best cut-off point was based on a judgment of accuracy provided by the measure. When there was the same value of accuracy, it was used as the sensitivity parameter as a criterion of choice.
Values of accuracy, sensitivity, specificity, positive predictive value (PPV), and negative predictive value (NPV) were determined per Krag and colleagues. 16 The significance level was set at p < 0.05.
Results
Table 2 shows the results of the ROC curve. Results indicated that FSH levels had the largest AUC for the clinical diagnosis of natural menopause (0.978 ± 0.008; asymptotic significance <0.001; 95% confidence interval [CI]: 0.96–0.99). Age had a higher AUC, compared to other factors (0.975 ± 0.006; asymptotic significance <0.001; 95% CI: 0.96–0.99). LH values had a lower AUC, compared with the other factors analyzed (0.922 ± 0.014; asymptotic significance <0.001; 95% CI: 0.90–0.95). Estradiol levels showed the lowest AUC, compared to other factors (0.065 ± 0.006; asymptotic significance <0.001; 95% CI: 0.04–0.09). Figure 2 depicts the factors evaluated in the ROC curve. Interpretation of estradiol levels was different from other variables analyzed in this study due to the inverse relationship with the outcome. The reduction in serum estradiol concentration is characteristic of menopause.

Receiver operating characteristics (ROC) curve analysis comparing age, follicle-stimulating hormone (FSH), luteinizing hormone (LH), and estradiol as classifiers for clinical diagnosis of menopause.
AUC, area under the curve; ROC, receiver operating characteristic; FSH, follicle-stimulating hormone; LH, luteinizing hormone; SEM, standard error of the mean; CI, confidence interval.
Figure 3 shows the curve of classification accuracy in women according to age (Fig. 3A), FSH (Fig. 3B), LH (Fig. 3C), and estradiol (Figure 3D). The optimal cut-off values for age, estradiol, FSH, and LH were 50 years, 24 ng/dL, 21 mIU/mL, and 17 mIU/mL, respectively. Any other cut-off values promote the formation of more false–positive or false–negative cases and consequently decrease accuracy in the classification of women.
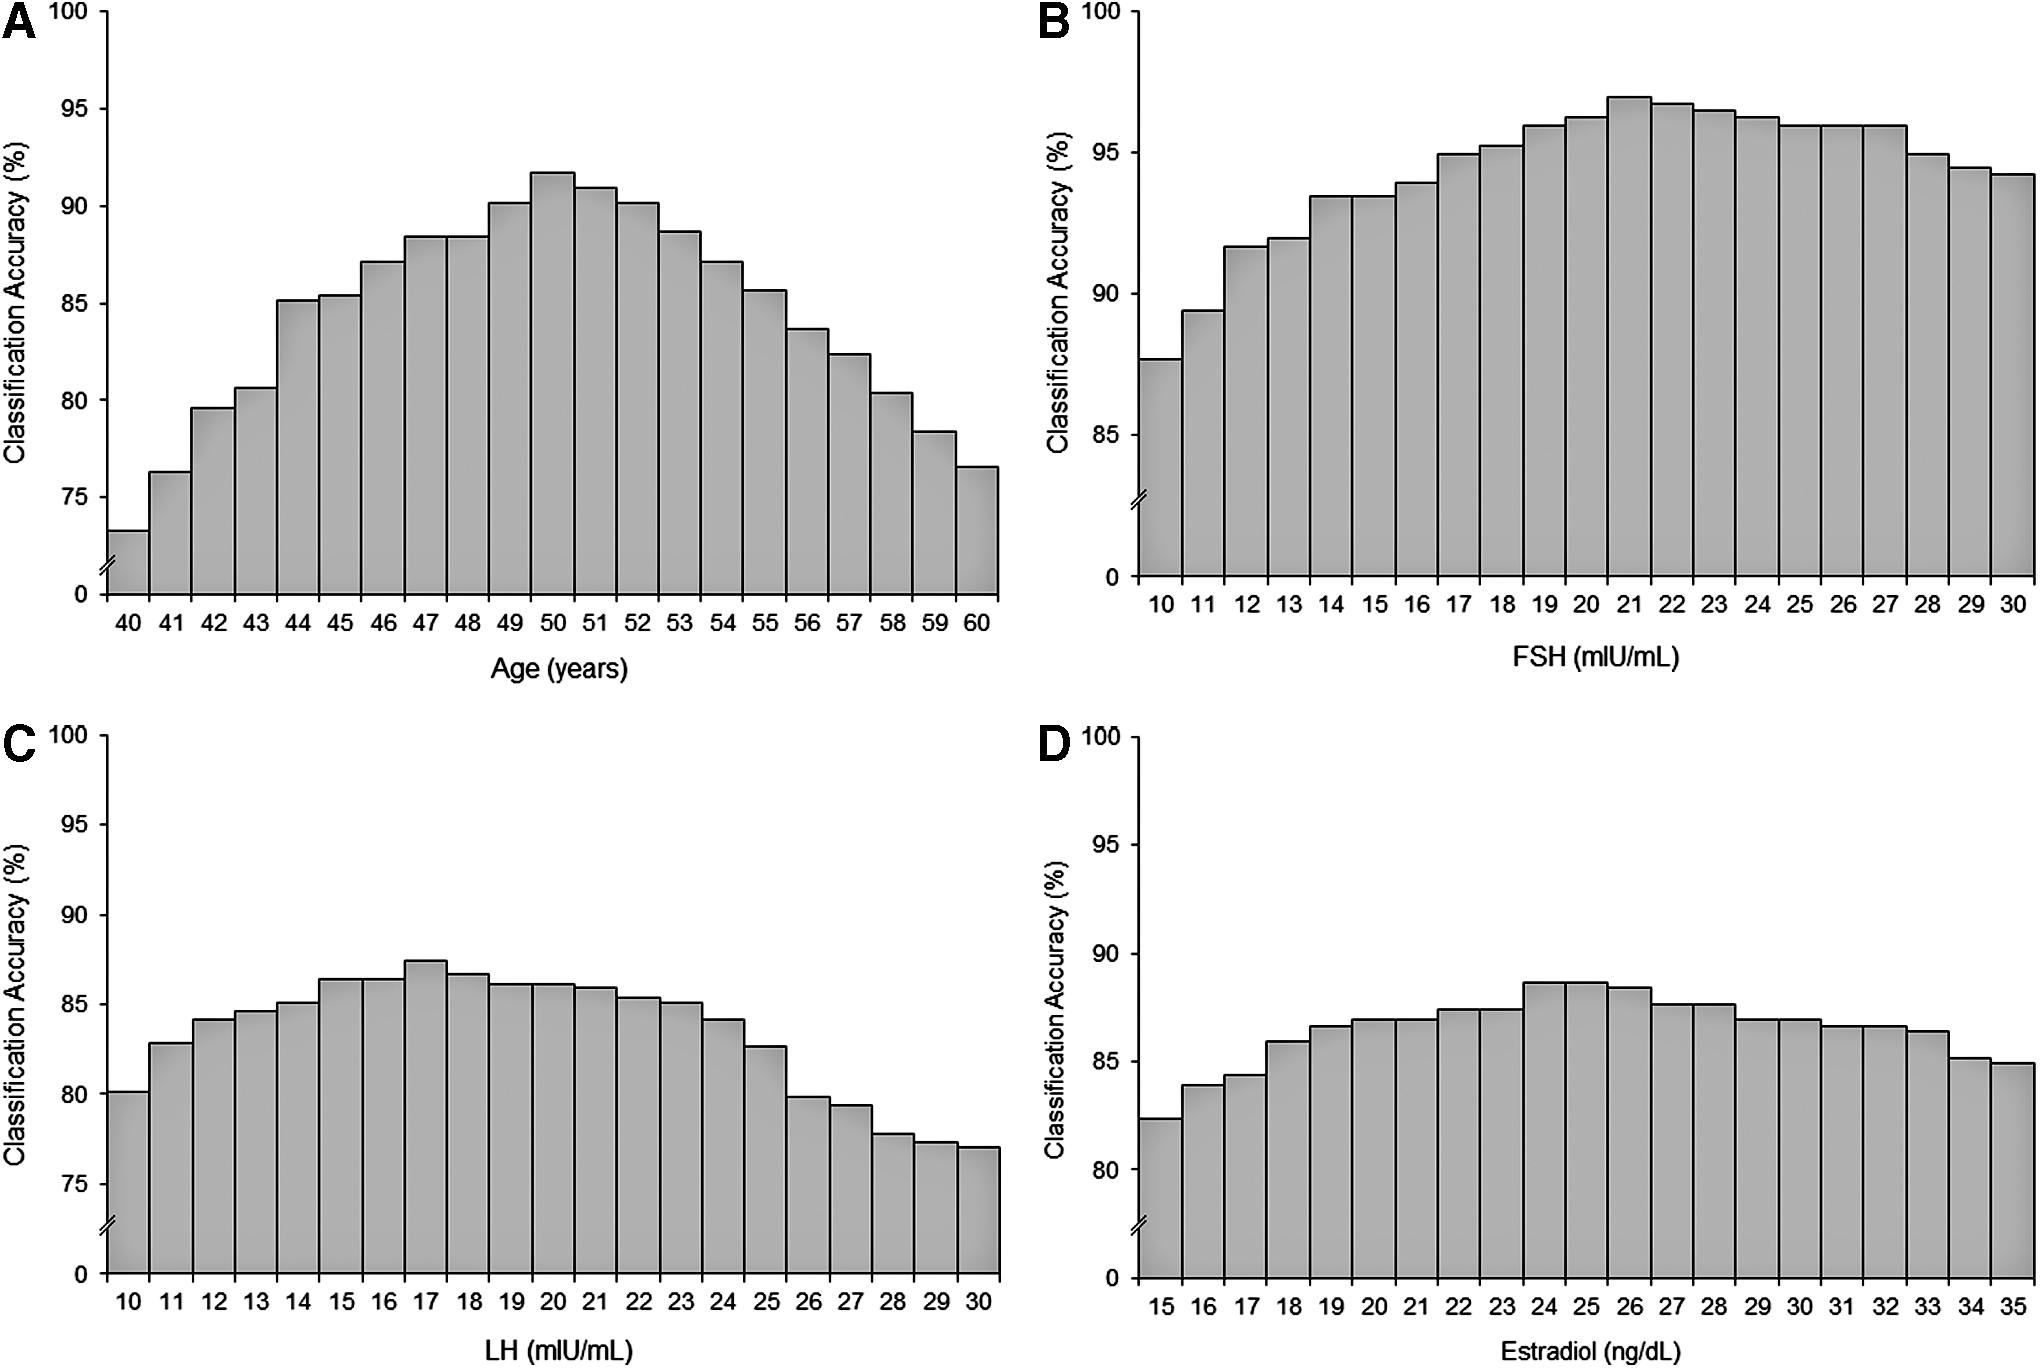
Curves of accuracy for the classification of menopausal women according to:
Complementary statistical parameters of sensitivity, specificity, PPV and NPV provided according to the cut-off values are shown in Table 3. The parameters analyzed in the study showed a similar pattern to the normal distribution. Values below the optimal cut-off have an increased amount of false–positives, as women diagnosed to be premenopausal are classified in the postmenopausal group and vice-versa. The greater the number of individuals classified as false–negative or false–positive, the smaller the accuracy afforded by the cut-off value.
Data are reported as means ± standard error of the mean.
FSH, follicle-stimulating hormone; LH, luteinizing hormone; PPV, positive predictive value; NPV, negative predictive value.
The optimal cut-off value for FSH resulted in good reliability values for sensitivity (96.8%), specificity (97.1%), PPV (95.6%), and NPV (97.9%). The cut-off point was able to identify 233 individuals in the premenopausal group and 152 in the postmenopausal group. The model also resulted in 7 individuals identified as false–negative and 5 individuals as false–positive.
The optimal value of age resulted in 93.2% sensitivity, 90.8% specificity, 85.5% PPV, and 95.8% NPV. The age determination in the cut-off value provided identification of 228 individuals in the premenopausal group and 136 women with a clinical diagnosis of menopause. Results also indicated the presence of 23 false–negative and 10 false–positive cases.
Critical LH levels in the diagnosis of menopause showed 81.1% sensitivity, 92.3% specificity, 89.3% PPV, and 86.1% NPV. This variable was less efficient in identifying groups, as 205 women were classified as being in the premenopausal stage and 142 women in the menopausal stage. Seventeen false–negative and 33 false–positive cases were noted.
The cut-off value concerning estradiol levels allowed 90.0% sensitivity, 86.5% specificity, 84.9% PPV, and 91.2% NPV. This variable was the least efficient in identifying groups, as 217 women were classified as being in the premenopausal stage and 135 women in the menopausal stage. Twenty-four false–negative and 21 false–positive cases occurred.
FSH levels showed the highest percentage of accuracy (96.4%), followed by age (92.6%), LH levels (89.1%), and estradiol (88.6%). The associations among the factors investigated in this study did not promote greater precision than that afforded by the FSH levels. Figure 4 shows serum concentrations of estradiol, FSH, and LH categorized into decades of life, from 20 to 80 years of age.
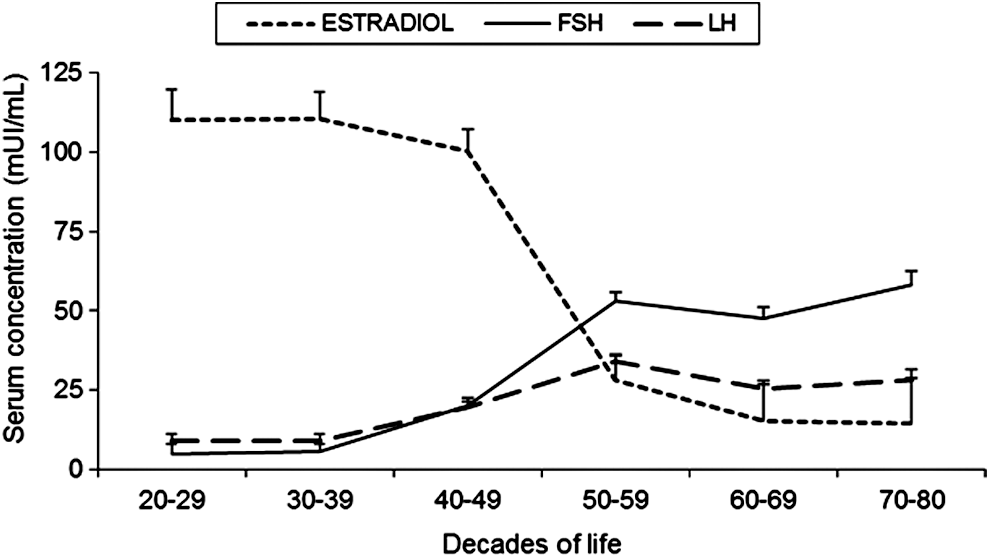
Follicle-stimulating hormone (FSH), luteinizing hormone (LH), and estradiol levels categorized into decades of life.
Discussion
The findings of the present study showed that, when the FSH level is used as an independent criterion, it might promote greater accuracy for classification of menopausal status. Currently, the indicators used for the clinical diagnosis of menopause are FSH and LH levels associated with amenorrhea >12 months. However, the percentage accuracy of the present study showed that the FSH levels alone were the best factor to be used for menopause diagnosis. The reference value for FSH levels was 21 mIU/mL to diagnosis of natural menopause. Other values resulted in larger rates of false–positives and false–negatives. Previous studies also identified a lower cut-off value for FSH of 22.3 mIU/mL for menopause in a Korean sample. 17 Although the main study assessed the epidemiology of sleep disorders, in this present study, there was no bias in the selection of volunteers because a blinded sample for the presence of sleep disorders was randomized and representative of the city of São Paulo.
Currently, several studies used the criterion based on FSH levels with a variation from 20 to 40 mIU/mL associated with amenorrhea >12 months.18,19 This emphasizes the need to implement a methodology with high accuracy and low cost for the diagnosis of menopause. The current study's results corroborate its initial hypothesis and highlight the importance of lower values than those currently used in clinical practice for the diagnosis of menopause (30 mIU/mL).12,20–22 This demonstrates the effectiveness of FSH levels in the diagnosis of menopause. The diagnosis of this stage allows the use of hormonal or alternative therapies in the early treatment of undesirable symptoms of menopause. 23
Age showed a significant role in the prediction of menopause, representing a success rate of 91.7%. Despite this high success rate, the mean age of menopause varies between countries. Average age of menopause ranges from 47 to 52 years have been observed in Southeast Asian countries and in the United States.24,25 Studies indicate that some variables—such as obesity, 25 tobacco, 26 socioeconomic status, 27 regular physical activity, 28 general health, and lifestyle 29 —are factors potentially associated to variations of age at menopause. LH levels showed less influence on the diagnosis of menopause. A previous study showed that the cut-off value for LH levels should be lower than the threshold of FSH. 17 The criteria combination of two or more factors evaluated resulted in an accuracy rate always below the maximum reached by one of them.
Studies from researchers in the present research group demonstrated that obstructive sleep apnea syndrome presents with a 29% prevalence in women, and the main factors associated with the sleep disorder were menopause, Mallampati airway classification, and waist circumference.5,30 The main hypothesis was that sleep-related breathing disorders resulted from menopause due to gradual reduction of progesterone, which, in premenopausal women, was able to increase the ventilatory drive and action of the dilator muscles of the upper airways.31,32
FSH levels are the most effective factor in the clinical evaluation of menopause. Results showed that FSH level was more efficient with respect to accuracy, sensitivity, and NPV for identifying the menopausal stage. The association of FSH with age and/or LH caused a lower accuracy for identifying women with menopause. Combined factors produced lower accuracy for identification of menopause, because the criteria used should be considered according to both factors.
Some studies are limited by using only the inclusion criterion of amenorrhea for at least 12 months to define postmenopause. 33 However, it should be considered that increase of FSH levels might also be a potential indicator of ovarian failure. A recent study used the association of FSH levels with the minimum period of amenorrhea for 2 years for the definition of menopause in women who were evaluated. 22 These examples show that there is a lack of standardization of the criteria for diagnosis of menopause in studies, and this has implications for their results. The development of a large multicenter study would help to identify a global criterion for menopause, with a representative sample of the world population.
There were some limitations in this present study in relation to extrapolating the results to the world population. This article is a result of a secondary analysis of the EPISONO, whose main outcome was to identify the prevalence of sleep disorders in the city of São Paulo. In future studies, the current authors suggest using the same analysis methodology in a large epidemiologic study designed with the exclusive objective of identifying the cut-off values for FSH, LH, and age. In addition there should be inclusion of a larger sample of volunteers in the age range between 45 and 55, to provide increased statistical power in the definition of cut-off values. The present study did not assess the association between smoking and onset of menopause, given that the form of data collection did not allow the identification of ex-smokers and time of last use of nicotine. Despite these limitations, this study contributes to the understanding of menopause and highlights the importance of cut-off values for age, estradiol, FSH, and LH in the diagnosis of menopause.
Conclusions
The present study found that FSH levels associated with patients' present amenorrhea for at least 12 months was able to be used to identify women in natural menopause, with 97.0% accuracy. Results showed that an FSH level higher than 21 mIU/mL was the strongest independent predictor of the onset of menopause. The evidence found indicates that FSH level can be lower than the clinical criterion currently used. The main clinical implication of this study is that the use of this criterion alone has a better accuracy rate for diagnosis of menopause.
Footnotes
Acknowledgments
The authors thank all the patients who took part in the study.
This study was funded by the Associação Fundo de Incentivo à Pesquisa (AFIP), Coordenação de Aperfeiçoamento de Pessoal de Nível Superior (CAPES), Conselho Nacional de Desenvolvimento Científico e Tecnológico (CNPq), and São Paulo Research Foundation (FAPESP) (#2013/14945-7 to DNP). H.H., L.R.B., and M.L.A. are recipients of CNPq fellowships. The funding agencies had no role in design, preparation, review, or approval of this study.
Author Disclosure Statement
The authors declare that they have no conflicts of interest.