




Abstract
Objective:
The goal of this research was to evaluate trends in gynecologic surgical reimbursement and to determine the factors affecting compensation.
Materials and Methods:
Procedure codes representing a comprehensive list of gynecologic surgical procedures were used to calculate the mean annual reimbursements from 2012 to 2017. Medicare compensation trends for all gynecologic procedures and trends for hysterectomies were evaluated with and without adjustment for inflation, using data from the Bureau of Labor and Statistics. The impact of the constituent components of physician billing was evaluated using linear regression.
Results:
Overall gynecologic surgical billing was flat with an insignificant increase of $12–$18 (2.5%–4.0%) during the study period. While the conversion factor increased significantly (5.2%) over time, the other major inputs to billing were flat. The most important determinant of compensation was the work relative value unit (wRVU). Using a regression model, a 1-point increase in the wRVU increased billing by $36.87. Laparoscopic hysterectomy reimbursement decreased significantly over time (p = 0.001). The mean reimbursement for laparoscopic hysterectomies dropped by 14.2% after changes to the relative value assignment were adjusted for these procedures.
Conclusions:
Gynecologic surgical reimbursement has been essentially flat over time. Reimbursement for laparoscopic hysterectomy has declined over time significantly. This inequity will only be magnified as hysterectomies shift to minimally invasive techniques. The most-effective method to maintain or improve overall gynecologic surgical compensation is to increase the assigned relative value unit for high-volume procedures such as hysterectomy.
Introduction
Doctors are under constant pressure to justify their earnings. Although this is not a new phenomenon, growing health care costs have resulted in the implementation of standards for productivity. While practice settings and business models vary widely, gynecologic surgeons need to understand the process to advocate for themselves better.
Gynecologic procedures have been under-reimbursed since the inception of the current payment system. 1 Implemented in 1992, the Resource-Based Relative Value Scale (RBRVS) assigns a numerical value that represents both the complexity of the procedure and time required to perform the task. Known as a relative value unit (RVU), this value covers the work done preoperatively, intraoperatively, and postoperatively.2–4 In 1997, Goff et al. evaluated current procedural terminology (CPTTM) codes comparing the RVUs for comparable gender-specific procedures. This study demonstrated that gynecologic procedures were valued 37% lower in comparison to male-specific procedures. 5 Although some improvements have been made, a more recent analysis showed that a 26.7% differential remains. 6
This study evaluated the temporal trends of gynecologic surgery billing and this article describes the interplay between the components used to calculate the billable values. Then, there is a discussion on the implications of the study findings for future advocacy efforts and the need for policy changes.
Materials and Methods
After receiving an exemption from the University Hospitals of Cleveland institutional review board, an observational study was conducted. It was designed to evaluate trends in gynecologic surgery billing by Medicare from 2012 to 2017. Changes to the calculation of the conversion factor (CF) and Geographic Practice Cost Index (GPCI) made evaluation prior to 2012 impossible. In addition, the 2015 CF has 2 values (denoted as A and B) due to Medicare Access and the Children's Health Insurance Program Reauthorization Act. 7 Private insurance rates can vary widely and were not included in this study and the prior literature.5,6 The Centers for Medicare and Medicaid Services (CMS) publishes a list of CPT codes and their associated RVU worth annually in a National Physician Fee Schedule. 8 Values for work RVU (wRVU), GPCI, and CF were abstracted from this source for the years of interest.
The Society of Gynecologic Oncology periodically publishes a list of commonly used codes. The most-recent edition was used to create a comprehensive list of 122 gynecologic surgeries. 9 This list of surgeries (Appendix A1), which includes procedures commonly performed by generalist obstetrician–gynecologist, gynecologic oncologist, and female pelvic reconstructive surgeons, was used to calculate the overall billing amounts. A second list containing all hysterectomy codes (Appendix A2) was used for the hysterectomy billing analysis.
Each CPT code comes with RVUs assigned to 3 categories: (1) work; (2) practice expense; and (3) malpractice. For most physicians, the work RVU (wRVU) is the most important value, as this is the measure used in productivity targets. To turn the wRVU into an actual payment requires 2 additional factors. The first is the GPCI, which controls for regional-practice cost differences. The GPCI has a minimum value of 1 and rises based on cost-of-living surveys from 7 proxy occupations (e.g., engineering, nursing etc.).
10
More than half (56%) of all locations have a GPCI of 111. For the following analyses, the lowest-GPCI states are represented by Ohio (OH). San Francisco (SF) and Manhattan (in New York City; NYC) were chosen as high cost-of-living proxy locations for the west and east coasts, respectively. The final component is the conversion factor (CF), which turns the final number into a dollar value. The following formula is then used to calculate billing:
The mean bill for all gynecologic surgeries was then calculated for each year. The analyses assumed an equal procedure frequency to provide a simplified estimate of potential income that avoided complex fluctuations in pay that could have been caused by differing frequencies of procedures by location or between years. Available data would introduce unacceptable bias due to the limited procedure-specific frequency data. The same billing analyses were repeated for the hysterectomy codes alone. Hysterectomies were broken into four surgical modalities: (1) open; (2) vaginal; (3) laparoscopic (“straight stick” and robotic); and (4) laparoscopic radical. Laparoscopic radical hysterectomies, like open radical hysterectomies, were not subject to billing adjustments placed on laparoscopic hysterectomies and were analyzed separately. Each hysterectomy code was used once for calculation of mean billing. Given that inflation can erode value over time, the effects of inflation on billing were adjusted to assess for changes in purchasing power, using data from the Bureau of Labor and Statistics. 12
Spearman's rank-order correlations were used to compare relationships among variables. When relevant, partial correlations were conducted to determine the relationships among variables when controlling for the effect of another variable. Comparisons among continuous variables were conducted using independent t-tests or t-tests for related samples. Any comparisons of 3 or more groups were conducted using 1-way analyses of variance, followed by post-hoc tests with Bonferroni corrections for multiple comparisons. Analysis of categorical data was conducted using χ 2 tests. Multiple linear regressions were used to examine the effects of individual variables on billing. Simple linear regression was used to analyze effects of procedure-weight hysterectomy billing. All analyses were 2-tailed and a p-value ≤0.05 was considered significant.
Results
Billing for all gynecologic surgeries by location and changes over time
Differences in billing among locations for all common gynecologic surgeries were evaluated. Mean billing did not differ significantly among OH ($433.22 ± $306.83), SF ($466.28 ± $330.30), or NYC ($457.26 ± $323.80); p = 0.056.
Trends in billing and its determinants were then assessed over time. Mean billing (r = 0.01; p = 0.435) for gynecologic surgeries did not change significantly from 2012 to 2017. To control for the effects of inflation decreasing the value of a dollar over time, the purchasing power (i.e., billing value reduced by inflation) was calculated. Despite a significant amount of inflation (r = −0.18; p < 0.001) during the study period, purchasing power (r = 0.02; p = 0.385) did not decrease significantly. The determinants of billing were then assessed. GPCI (r = −0.01; p = 0.506), and wRVU (r = −0.01; p = 0.548) did not change significantly. The conversion factor (r = 0.72; p < 0.001) increased reliably over time. The same trends were then evaluated for the individual locations. GPCI increased reliably over time for SF (r = 0.73; p < 0.001), but decreased for Manhattan (NYC) significantly (r = −0.90; p < 0.001). Billing did not change over time for SF (r = 0.02; p = 0.496), OH (r = 0.02; p = 0.586), or NYC (r = 0.01; p = 0.737). See Figure 1. Purchasing power did not change over time for SF (r = 0.02; p = 0.515), OH (r = 0.02; p = 0.574), or NYC (r = 0.02; p = 0.702).

Mean billing per locale as a function of year for all gynecologic surgeries. The mean billed amount for all gynecologic surgeries by year.
Billing predictors for all gynecologic surgeries
The value of the wRVU was associated positively with billing across all locations and individually for OH, SF, and NYC. GPCI was associated positively with locales when they were combined but this relationship was not significant for individual locales. The conversion factor, year, and annual inflation were not associated with billing significantly (Table 1).
Correlations Between Billing and Predictors as a Function of Locale for All Gynecologic Surgeries
Indicates a statistically significant difference.
RVU, relative value unit; GPCI, Geographic Practice Cost Index.
Multiple linear regression was used to examine the effects of individual variables on billing. For every 1-point increase in wRVU, a $36.87 increase in billing was predicted (p < 0.001); for every 1-point increase in the CF, a $12.89 increase was predicted (p < 0.001); and for every 0.001-point increase in GPCI, a $0.43 increase was predicted (p < 0.001).
Examined separately by locale, multiple linear regression was again used to examine the effects of individual variables on billing. For every 1-point increase in wRVU, billing was predicted to increase by $38.01 for SF (p < 0.001), $35.31 for OH (p < 0.001), and $37.27 for NYC (p < 0.001). For every 1-point increase in the CF, a $13.43 increase in billing was predicted for SF (p < 0.001), $12.35 for OH (p < 0.001), and $13.28 for NYC (p < 0.001). Every 0.001-point increase in GPCI resulted in a nonsignificant $0.38 increase in billing predicted for SF (p = 0.115) but a significant $1.33 increase was predicted for NYC (p < 0.001).
Hysterectomy billing by location
An analysis comparing the billing of all hysterectomy codes at 3 different locations (OH, SF, and NYC) was conducted between 2012 and 2017, which indicated a significant difference among these locations (p = 0.018). Billing in OH was significantly lower than billing in SF (p = 0.019). There was no difference in billing between OH and NYC (p = 0.138) or between NYC and SF (p = 0.999).
Hysterectomy billing by surgical approach
The effect of surgical modality (open, vaginal, and laparoscopic) was assessed. The mean billing amounts, collapsed across all locations, were compared for the entire study timeperiod. A significant difference in billing was found among the modalities (p < 0.001). Open hysterectomies were billed at a significantly higher rate than vaginal or laparoscopic approaches (p < .001). Vaginal billing was significantly greater than laparoscopic billing (p < 0.001). Laparoscopic radical hysterectomies were billed at a significantly higher level than the other three modalities (p < 0.001).
Billing for open hysterectomies did not differ by locale (p = 0.418). However, billing, did differ for vaginal hysterectomies by locale (p = 0.015), such that billing in SF was greater than in OH (p = 0.015). Billing for laparoscopic hysterectomies did not differ across locale (p = 0.057). As shown in Figure 2, billing for radical hysterectomies differed by locale (p < 0.001), such that billing in OH was lower than either SF (p < 0.001) or NYC (p = 0.002).
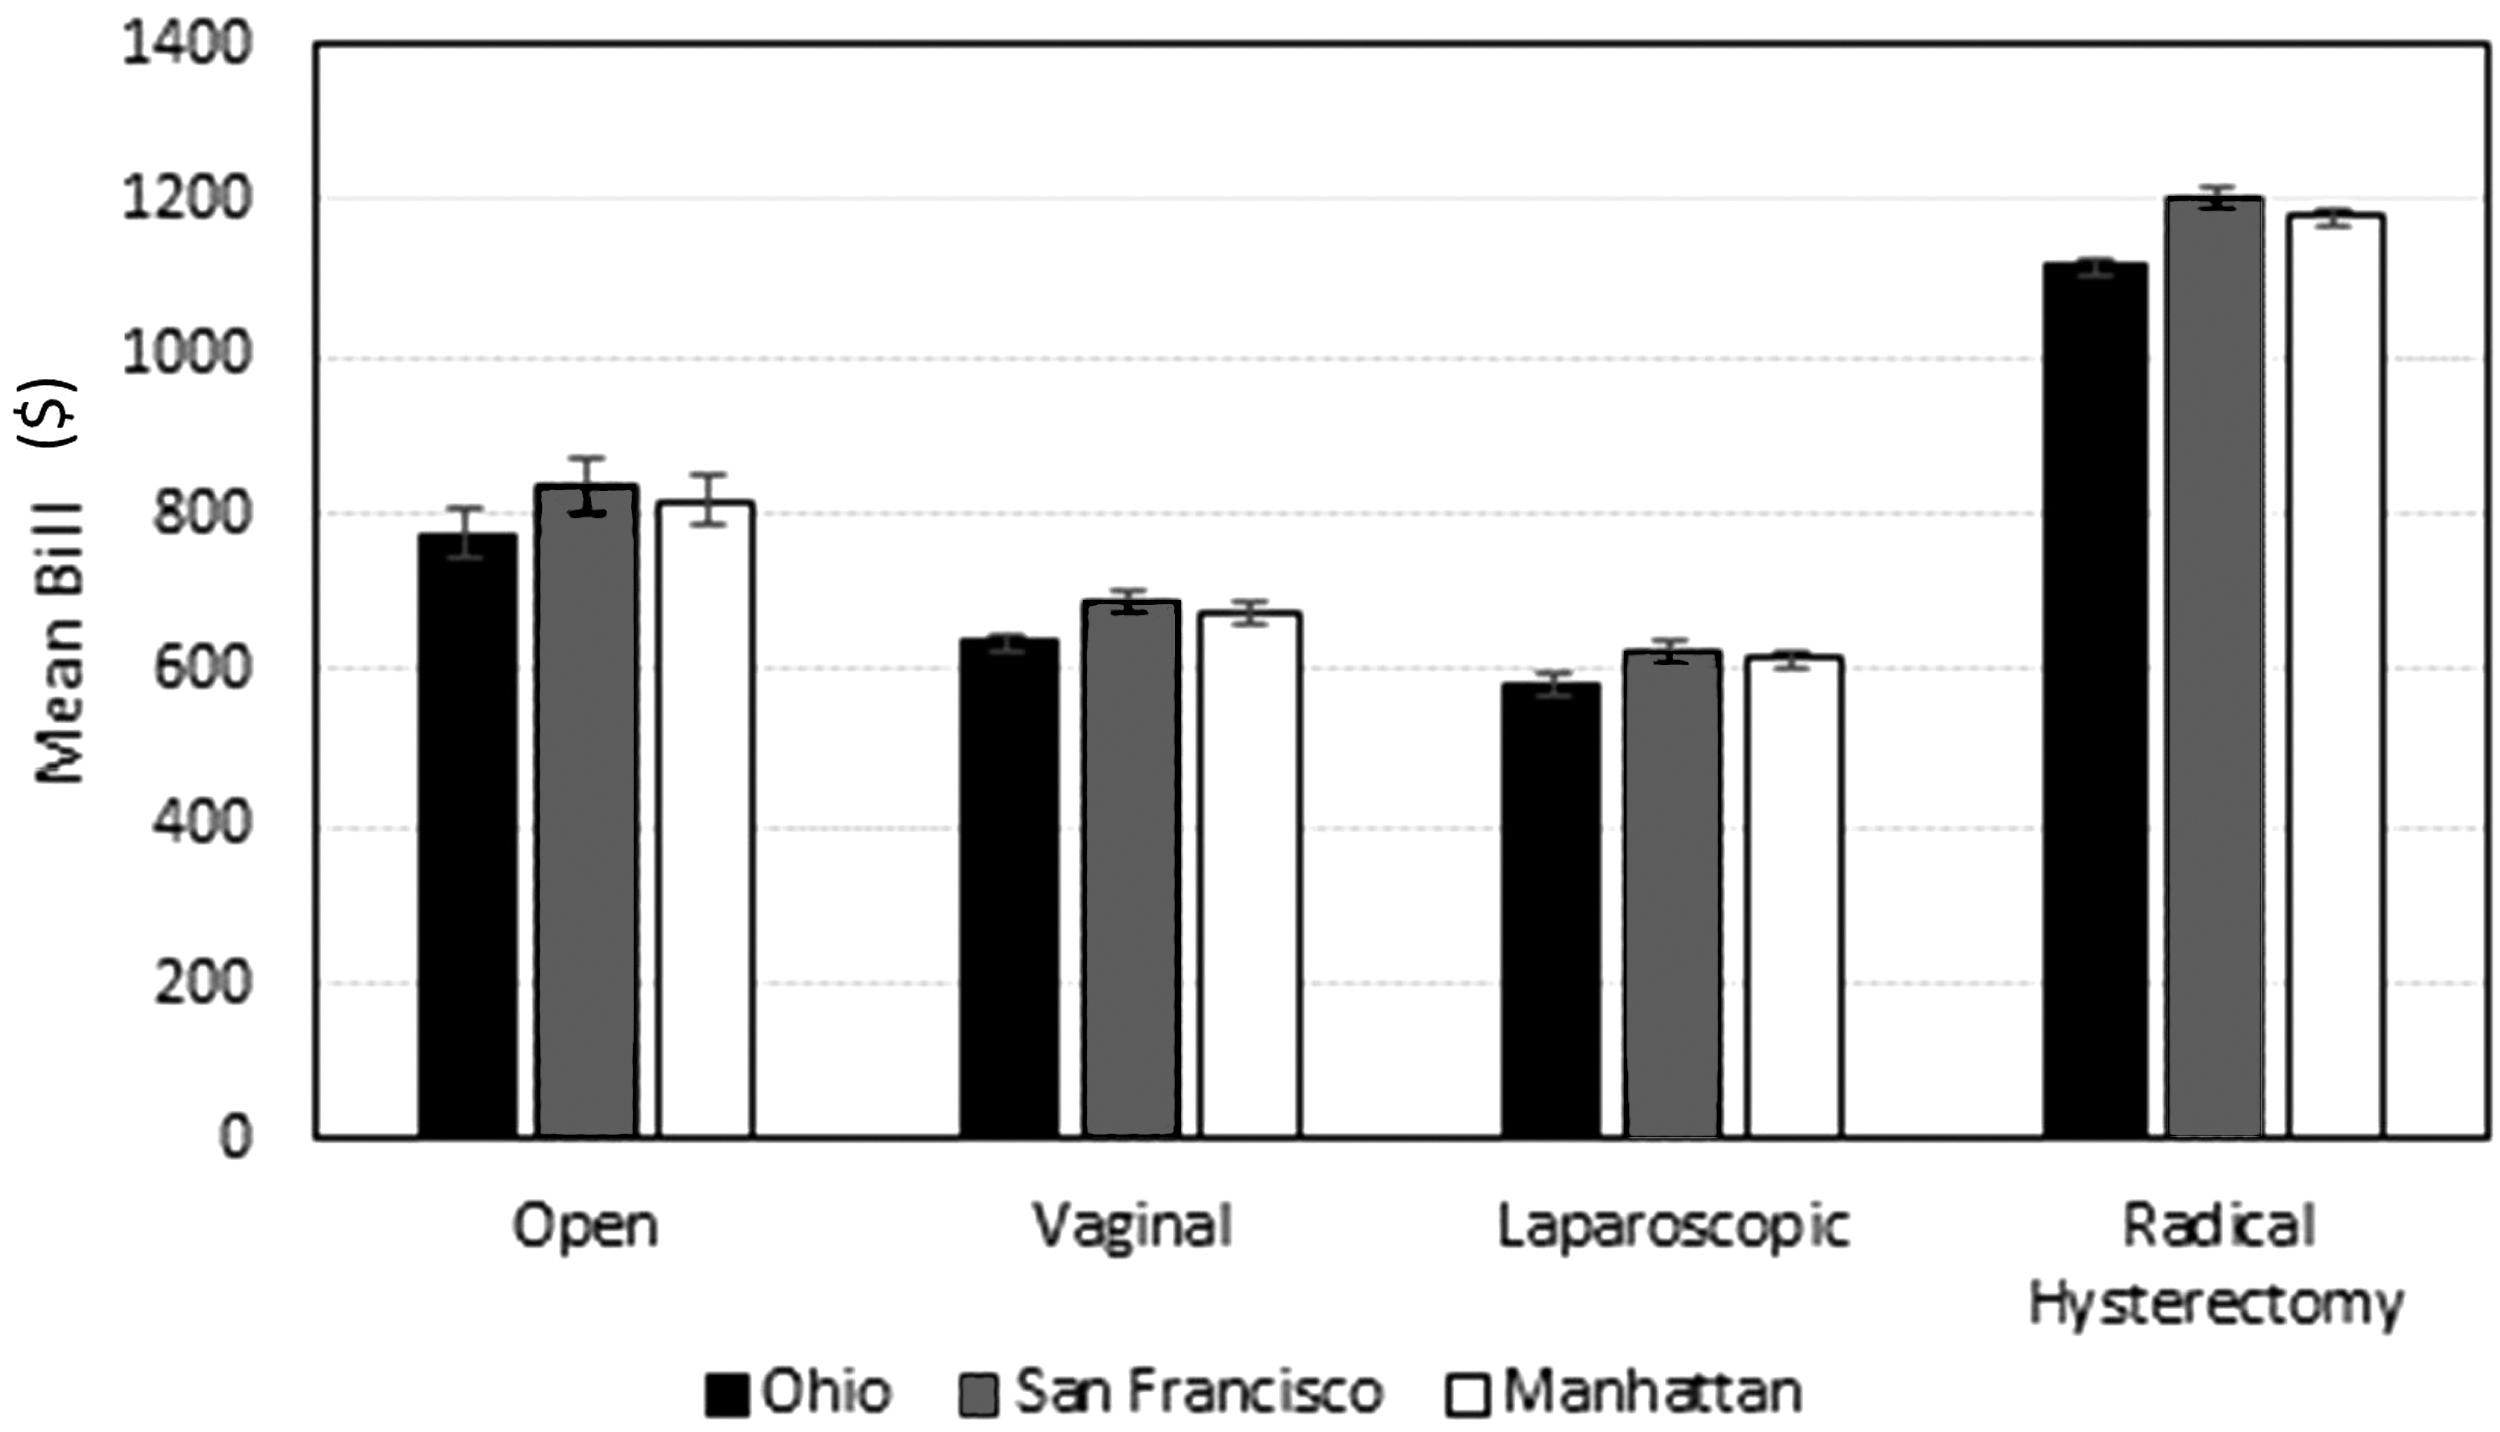
Mean billing by hysterectomy type as a function of location. Mean billing for each surgical modality over the entire analyzed timeperiod (2012–2017). Error bars indicate standard error of the mean.
Hysterectomy billing as a function of time
When examined as a group, there was no significant change in billing between 2012 and 2017 (p = 0.891). This relationship remained nonsignificant when examined for separate locales (all p ≥ 0.993). Billing also did not change over time for open (p = 0.999) and vaginal hysterectomies (p = 0.608), and for laparoscopic radical hysterectomies (p = 0.336) but did differ for laparoscopic hysterectomies (p = 0.001). Billing for laparoscopic hysterectomies was greater at year 2014 than in 2015a, 2015b, 2016, or 2017 (p = 0.018, 0.025, 0.019, 0.022, respectively; Fig. 3; Table 2). The mean reimbursement for laparoscopic hysterectomies decreased by 14.2% from 2014 to 2015.
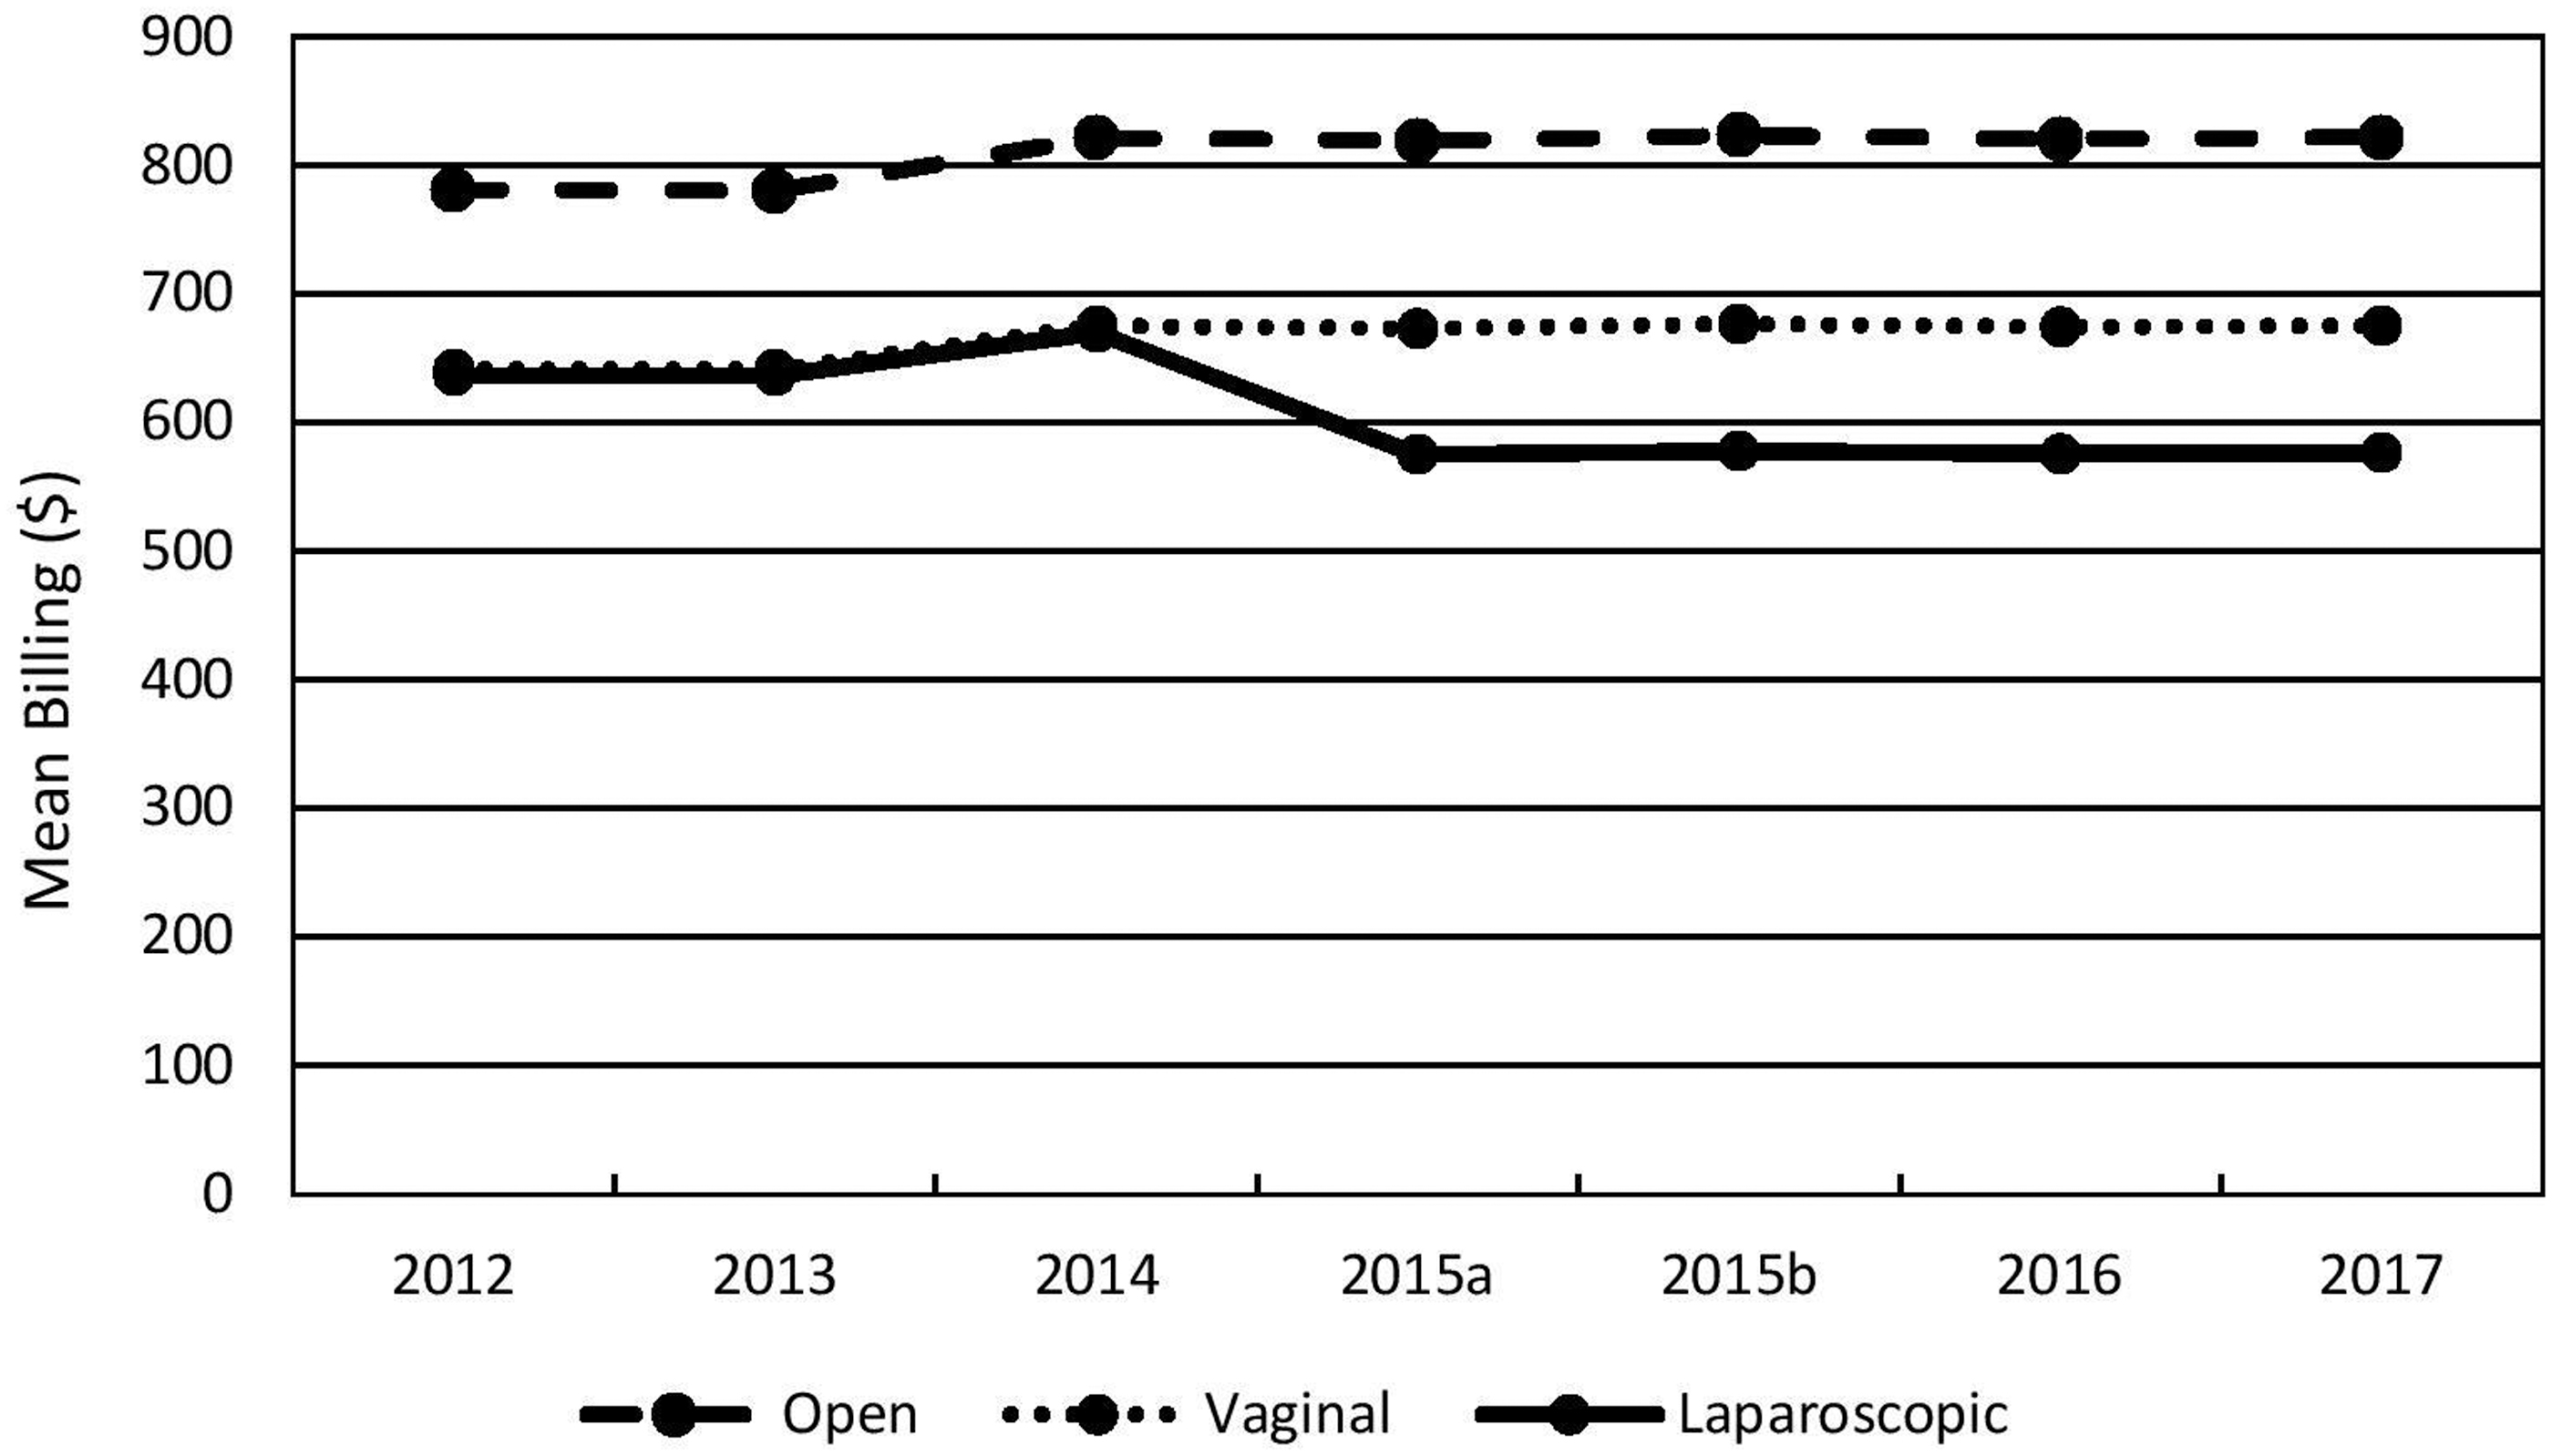
Mean billing for hysterectomy type as a function of time. Mean hysterectomy billing by surgical modality. Laparoscopic radical hysterectomy not shown for clarity.
Mean Billing for Hysterectomy Type as a Function of Time
Note: 2015 has 2 values (denoted as A and B) due to Medicare Access and the Children's Health Insurance Program Reauthorization Act.
Hysterectomy billing predictors
Collapsed across locales, billing was positively correlated with wRVU and GPCI but not with the conversion factor or year. However, when locations were examined separately, only wRVU was associated with billing significantly (Table 3). Multiple linear regression was used to examine the effects of individual variables on billing. For every 1-point increase in wRVU and in CF, increases in billing of $36.93 and $20.00, respectively, were predicted (p < 0.001). For every 0.001-point increase in GPCI, a $0.67 increase was predicted (p < 0.001).
Correlations Between Hysterectomy Billing and Billing Characteristics as a Function of Locale
Indicates a statistically significant difference.
RVU, relative value unit; GPCI, Geographic Practice Cost Index.
Examined separately by locale, for every 1-point increase in wRVU, billing was predicted to increase by $38.08 for SF, $35.38 for OH, and $37.33 for NYC (p < 0.001). For every 1-point increase in the CF, a $20.86 increase in billing was predicted for SF, $19.16 for OH, and $20.67 for NYC (p < 0.001). For every 0.001-point increase in GPCI, a nonsignificant $0.59 increase in billing was predicted for SF (p = 0.057), but a significant $0.75 point increase in billing was predicted for Manhattan (NYC; p < 0.001).
Discussion
The current study's findings indicated that, while mean gynecologic surgical billing was stable for both the entire code list and the hysterectomy-only list, there was a significant drop in billing for laparoscopic hysterectomy.
Gynecologic surgical billing was stable over the study period. While the CF significantly increased (5.2%) over time, wRVU and GPCI remained flat. The net result of this was an insignificant increase in mean billing of ∼ $12–$18 (2.5%–4.0%) depending on location. These minimal gains were eroded further by inflation leaving surgical billing essentially flat during the 6-year study period.
This finding was reinforced by the analysis of the relative contribution of each component to the final billing. Reliable relationships were found with billing for wRVU and GPCI but not for the conversion factor. wRVU was correlated positively with billing in all instances while GPCI only influenced billing significantly when looked at across all locations. As shown in the regression model, every 1-point increase in wRVU significantly increased billing by $36.87. Additionally, the reality is that the wRVU of procedures increased or decreased by multiple points over time, but the GPCI did not move by more than 0.01 and often by much less. This substantially limited the GPCI's ability to alter the billed amount. Thus, the changes occurring in billing were primarily due to shifts in wRVUs. Given that the mean wRVU was unchanged over time, it followed that overall billing remained flat during the study period. It is critical that gynecologists understand this relationship and participate in lobbying efforts as well as relevant surveys from the American Medical Association/Specialty Society RVS Update Committee (RUC) that help make changes to wRVUs.
Interestingly, billing in high cost-of-living SF and NYC were not significantly different from that of OH in the analysis of all gynecologic surgeries. One reason for this similarity between high- and low-cost locations is that the GPCI cannot fall below 1 by law. This has the effect of raising low-cost states' billing relative to those whose GPCI is >1. When all codes are accounted for, the mean bill in SF and NYC was only $33.54 (7.4%) and $24 (5.1%) more than OH, respectively. This geographical adjustment is not likely to make up for the different costs of living. For example, the estimated cost of groceries is 34% higher and housing is 564% higher in Manhattan, NYC, versus Cleveland, OH. 13 While examining the overall trend helped to understand the overall picture, a subset of codes was analyzed to limit effects of wRVU variability and procedure frequency.
Hysterectomy codes were chosen for analysis, given that, as a group, they are the most common gynecologic procedures and their wRVU values are relatively homogeneous. Hysterectomies, unlike the full procedure list, were billed differently by location. OH hysterectomy billing was significantly lower than SF but was the same as NYC. This was driven by higher billing for laparoscopic radical hysterectomies in both locations, but SF also had greater billing for vaginal procedures. Collectively, these findings do show some difference in billing by location, but the effect of GPCI on billing is so small that even the highest GPCI locations only showed a distinction in selected situations. While it is encouraging that physicians receive significant adjustments—at least for hysterectomies—the fact remains that the amount is likely not equal to the higher cost of living.
Perhaps the most clinically important finding of this study is that laparoscopic hysterectomy billing was significantly less than for all other surgical modalities. While laparoscopic hysterectomies were always billed at a lower rate relative to other surgical approaches in the current study, the differential significantly increased over time. In 2012, the mean billing difference between open and laparoscopic hysterectomies was $143.91(20.3%). By 2017, the difference increased to $244.94 (35.0%). This is primarily the result of a significant drop in the wRVU for laparoscopic hysterectomies from 2014 to 2015. For example, the wRVU for total laparoscopic hysterectomy (58570) dropped by 17.2%. While the decrease in wRVU for laparoscopic hysterectomies is of concern on its own, this is taking place in the context of a general shift away from open surgery. Laparoscopic hysterectomies are now the most common surgical modality, which means that an ever-greater share of the surgeries performed will be subject to the lower rates outlined in this current study.14,15 Best clinical practice recommends the use of minimally invasive procedures rather than abdominal hysterectomy.16,17 While gynecologists will continue to provide as many patients as possible with the known benefits of a minimally invasive approach, the current payment structure is set up to disincentivize this behavior.
This is the first study to the current authors' knowledge to model gynecologic surgical reimbursement. The strength of the model was bolstered by the comprehensive list of procedures included in the analysis. Additionally, this study provides important information regarding the interplay of wRVU, GPCI, and CF that can be used to inform how gynecologists negotiate reimbursement as a group. Specifically, the drop in reimbursement for laparoscopic hysterectomy, which has become the dominant surgical modality, is a clear area that requires continued advocacy. As of 2020, hysterectomy wRVUs are unchanged from 2017, which shows the continued relevance of the model used in the current study. The major weakness of the model was that, due to the nature of the dataset, it was not possible to control for relative frequency of each procedure. This was mitigated by the hysterectomy analysis, which, due to its high wRVU value and large share of all gynecologic procedures, plays an outsized role in total reimbursement. The model was also limited to 3 locations. However, 56% of all locations have a GPCI value of 1 and were therefore represented. 11 Additionally, by showing that a high GPCI area such as NYC does not have increased reimbursements, intermediate GPCI areas clearly do not as well.
Conclusions
While the number-one consideration of any practicing physician is delivering the best possible care, it is critical that physicians understand individually—and perhaps even more importantly as a group—how productivity is measured. This study showed the importance of wRVU and the need to align financial incentives with best patient practice. Lobbying efforts by gynecologists should be focused on maintaining or increasing the wRVU. Particular attention should be directed at increasing the wRVU of laparoscopic hysterectomies to correct for the drop shown in this study. While this study did not show a significant decrease in overall hysterectomy billing, current trends toward laparoscopic from open hysterectomy suggest billing will eventually be affected.
Footnotes
Author Disclosure Statement
Drs. Nakayama and Shahin serve on advisory boards and as speakers on topics unrelated to the subject covered in this article. Dr. Shahin is the co-chair of Health Policy and Socio-Economics Committee for the Society of Gynecologic Oncology. No financial conflicts exist for the other authors.
Funding Information
There was no funding for this research to disclose.