
Abstract
Abstract
Brothers Michael D., Brandon K. Doan, Michael F. Zupan, Al L. Wile, Randall L. Wilber, and William C. Byrnes. Hematological and physiological adaptations following 46 weeks of moderate-altitude residence. High Alt. Med. Biol. 199–208, 2010.—Although acclimatization to moderate altitude (MA) is thought to be unnecessary or to require minimal adaptation, retrospective data from the U.S. Air Force Academy (USAFA), a military college located at 2210 m, suggested otherwise. To further examine the utility of USAFA as a model for MA acclimatization, a longitudinal experimental design was prospectively utilized to determine the magnitude and time course of selected hematological and performance parameters following 46 weeks at this unique MA setting. Incoming USAFA male freshmen (n = 55) were divided into experimental groups based on prior residence at sea level (SL) or MA. Hematological and performance parameters were repeatedly assessed during their entire first year at MA. Hematological data consisted of a complete blood count (CBC) with reticulocyte parameters, as well as determination of serum levels of ferritin, erythropoietin, and soluble transferrin receptor (sTfR). Performance testing included aerobic (1.5-mile run) and physical (push-ups, sit-ups, pull-ups, and standing long jump) fitness tests, maximal aerobic capacity, and running economy. Significant (p < 0.05; main effect) hematological differences between SL and MA subjects were observed for the majority of the study. MA subjects had a significantly higher hemoglobin concentration ([Hb], +5.5%), hematocrit (+2.8%), and serum ferritin (+59.0%) and significantly lower sTfR (-11.4%) values than their SL peers. Although both serum ferritin and sTfR demonstrated a significant altitude group × time interaction, [Hb] and hematocrit did not. A significant main effect of altitude without interaction was also observed for performance parameters, with SL subjects having a significantly lower V
Introduction
The studies performed at MA usually consist of “training camps” (Ashenden et al., 1999, 2000; Bailey et al., 1998; Brugniaux et al., 2006a, 2006b; Buskirk et al., 1967; Dehnert et al., 2002; Faulkner et al., 1967; Friedmann et al., 2005; Gore et al., 1998, 2001; Green et al., 2000; Ingjer and Myhre, 1992; Klausen et al., 1991; Levine and Stray-Gundersen, 1997; Mairbaurl et al., 1986; Saunders et al., 2004; Schmitt et al., 2006; Stray-Gunderson et al., 2001; Wehrlin et al., 2006), and many studies have lacked a control group, making it difficult to determine whether the changes reported were solely a result of the hypobaric hypoxic environment or were influenced by the structured training environment and “camp effect” (Faulkner et al., 1967; Friedmann et al., 2005; Ingjer and Myhre, 1992; Klausen et al., 1991). Additionally, many of these “altitude camp” studies have utilized a live high–train low (LHTL) protocol that may not reflect the same physiological adaptations as chronic residence at MA (Ashenden et al., 1999, 2000; Brugniaux et al., 2006a, 2006b; Chapman et al., 1998; Dehnert et al., 2002; Gore et al., 2001; Hahn et al., 2001; Levine and Stray-Gundersen, 1997; Saunders et al., 2004; Schmitt et al., 2006; Stray-Gunderson et al., 2001; Wehrlin et al., 2006).
A recent retrospective study of physical fitness and hematological parameters of cadets at USAFA (2210 m) by our group demonstrated significant differences in a 1.5-mile aerobic fitness test (AFT) run between freshman cadets who were residents of either SL (less than ∼150 m) or MA (greater than 1500 m) prior to arrival at USAFA. This difference in AFT between SL and MA cadets persisted after 1.5, 3, and 7 months of MA residence, but was not evident by month 15 and at all measured time points thereafter (Brothers et al., 2007). Unfortunately, the available retrospective blood data did not provide a clear picture of the duration required for hematological adaptation or enable correlation between hematological changes and AFT, but did demonstrate a significant 1.5 g·dL−1 (+10%) gain in Hb in former SL residents after long-term MA exposure (∼30 months).
The purpose of this study was to prospectively examine the USAFA model for examining the adaptations following long-term exposure (46 weeks) to MA among prior SL and MA subjects residing at MA. Based on previous retrospective findings, we hypothesized that significant physiological and hematological differences would exist between SL and MA subjects for 28+ weeks, but these differences would dissipate prior to 1 yr of chronic MA exposure.
Materials and Methods
Subjects
Fifty-five male freshman students at USAFA, 18 to 25 years of age, were recruited for this study. Subjects were divided based on their previous altitude exposure into either a MA (n = 18) or SL (n = 37) cohort. All SL subjects resided at or below ∼300 m (1000 ft); MA subjects resided at or above 1500 m (∼5000 ft) for 2 or more years prior to arrival and admissions processing at USAFA. Pre-USAFA elevation was verified using the subject's home mailing address and a Department of the Interior U.S. Geological Survey government Internet site <http://geonames.usgs.gov>.
The student area of USAFA is located at 2210 m, and details concerning USAFA admission and the unique, well-controlled environment (chronic altitude exposure, diet, physical training) as a result of the rigorous and regimented 4-yr military academy program have been previously described (Brothers et al., 2007). Investigators explained both orally and in writing the procedures, risks, and benefits of the experiment, and all subjects provided their informed written consent to a protocol approved by the USAFA Institutional Review Board. Physical characteristics of the subjects are given in in Table 1.
USAFA, U.S. Air Force Academy; SL, sea level; MA, moderate altitude.
Significant difference between MA and SL (p < 0.001).
Experimental design and procedures
All USAFA freshmen completed a thorough medical history and physical examination prior to admission to USAFA and were closely monitored by medical personnel during in-processing and the first 6 weeks at USAFA while they endured basic cadet training (BCT). Additionally, each subject completed a medical history questionnaire to ensure that no medical conditions existed that would preclude their participation in this study. Each subject also signed a Health Insurance Portability and Accountability Act (HIPAA) form authorizing the release of personal medical and physical fitness data for use in the study.
Hematological changes were longitudinally tracked for the entire freshman year (+46 weeks) at USAFA. Owing to USAFA restrictions, we were not allowed to recruit subjects until the completion of USAFA BCT (first 6 weeks at USAFA); as a result, our first prospective blood draw occurred after 8 weeks of chronic MA exposure. However, we had access to the CBC with reticulocyte panel that was part of in-processing at USAFA and occurred on day 4. In addition to the +4-day and +8-week blood draw, subjects also reported to the hematology lab at weeks 15, 23, 30, 37, and 46 (roughly every 7 to 9 weeks, based on USAFA cadet schedule). All subjects completed each blood draw within a 2- to 4-day time period. Care was taken to schedule the majority of the blood draws in the morning (7 to 11
For all blood-draw appointments, subjects were instructed to report hydrated to the USAFA medical facility, and appointments were scheduled between academic classes to minimize potential shifts in plasma volume as a result of dehydration, prior exercise, posture, or temperature. Each subject was seated, and whole blood was collected from an antecubital vein by venipuncture in vacutainer tubes containing a salt of potassium EDTA; each sample was analyzed by the USAFA Hospital hematology lab. Blood samples were first analyzed using a Beckman–Coulter Gen-S2 automated hematological analyzer (Beckman–Coulter, Miami, FL, USA) for a CBC with reticulocyte panel (to include white blood cell and red blood cell (RBC) count, [Hb], hematocrit (Hct), mean corpuscular volume (MCV), mean corpuscular hemoglobin (MCH), and mean corpuscular hemoglobin concentration (MCHC), among other parameters, such as high light scatter (an index of reticulocyte maturity based on RNA content used by Beckman–Coulter), number, and percent). This sample was then centrifuged, and the serum was harvested and immediately frozen at −30°C for future serum EPO and sTfR analysis (weeks 8 to 37). Human EPO was estimated utilizing a commercial sandwich ELISA kit (Quantikine IVD Erythropoietin ELISA, R&D Systems, Inc., Minneapolis, MN, USA), and sTfR was estimated using a sandwich ELISA assay developed at Craft Technologies, Inc., according to Erhardt et al., 2004. Additionally, a second vial of blood was sent to Armstrong Laboratory at Brooks-City Base, Texas, and serum ferritin levels were analyzed using a Beckman–Coulter Access Immunoassay (paramagnetic particle chemiluminescent immunoassay; Beckman–Coulter, Miami, FL, USA).
Although no hematological data could be gathered during BCT (the first 6 weeks at USAFA), each subject's initial (day 4) blood data were retrospectively analyzed. This initial blood draw occurred during a single day, was conducted by the USAFA medical staff, consisted of the same CBC analysis with reticulocyte parameters listed above, and was processed on the same Beckman–Coulter hematological analyzer. However, no serum ferritin, EPO, or sTfR data were obtained during this initial blood draw.
Any subject with a serum ferritin value less than 20 ng·mL−1 during any prospective blood draw was identified as possibly being iron-depleted (Chatard et al., 1999). Given that subjects with iron-depletion nonanemia, iron-deficient nonanemia, or iron-deficient anemia would confound the results of this study, additional hematological parameters were specifically examined for subjects with a serum ferritin less than 20 ng·mL−1 to determine if these subjects had iron-deficient anemia (Chatard et al., 1999). These parameters and the nonanemic standards utilized included RBC (>4.3 × 10⁶·μL−1), [Hb] (>14.0 g·dL−1), Hct (>42%), MCV (>81.0 fL), MCH (>26.8 pg), and MCHC (>32.0 g·dL−1). If more than one of these parameters were lower than our nonanemic standards, we classified these subjects as having a compromised erythropoietic function owing to iron-deficient anemia, and their data were not included in the study.
In addition to the seven longitudinal blood-draw appointments, each subject completed eight separate fitness tests as part of the study. Subjects completed six USAFA-mandated fitness tests and two maximal graded exercise stress tests (GXTs) administered over the course of their first-year at USAFA. The USAFA-mandated fitness tests were conducted 3 times during the year and involved the administration of an aerobic fitness test (AFT) and a physical fitness test (PFT). The AFT consisted of a timed 1.5-mile run, and the PFT consisted of push-ups, pull-ups, sit-ups, and a standing long jump. The initial AFT and PFT were completed 6 weeks after first arriving at USAFA at the end of BCT. The second AFT/PFT occurred at +12 weeks, and the third and final AFT/PFT was administered at +30 weeks after arrival at USAFA. Details of the USAFA AFT/PFT protocols and scoring standards have been previously described (Brothers et al., 2007).
Because of limited access to the cadets during BCT and the fact that numerous studies have examined short-term differences and adaptations in V
All tests were conducted at an altitude of 2210 m with an average barometric pressure and temperature of 590.9 mmHg and 25.8°C, respectively. In addition, a fan set at high was used to enhance heat dissipation throughout each test. Only GXT tests that satisfied at least two of the following three criteria were retained for statistical analysis: (1) identification of a plateau in V
During each GXT, oxygen consumption was measured breath by breath and averaged over 20-sec intervals through computer-assisted (Spectra software version 12-1A, Boulder, CO, USA, and Cardiosoft version 4.2, Houston, TX, USA) indirect calorimetry using a Vmax Spectra metabolic cart (SensorMedics Corporation, Yorba Linda, CA, USA). Before each test, the oxygen and carbon dioxide analyzers underwent a 2-point calibration, per manufacturer's recommendation, using a primary standard within the physiologic range (16% O2 and 4% CO2) and a 26% O2 (nitrogen balance) secondary standard. The mass flow sensor was calibrated with a 3-L syringe using 5 distinct flow rates within the physiologic range, per manufacturer's recommendations. Gas and flow sensor calibration was verified after every GXT to ensure that the system had remained within manufacturer's specifications; during the rare occasion (less than 2% of all tests) that postcalibration failed, the subjects were retested within 1 to 2 weeks.
Prior to each GXT, subjects were fitted with a heart rate monitor (Polar USA Inc., Stamford, CT, USA) and pulse oximeter (N-595 with adhesive Max-Fast forehead sensor, Nellcor, St. Louis, MO, USA). Heart rate and an estimation of arterial saturation (Sp
The GXT protocol was kept identical within subjects for both (+17 and +42 weeks) V
Statistical analysis
Data are reported as the group mean ± SD unless otherwise noted. Mean values for fitness tests (AFT and PFT) and GXT data were compared using a 2-factor (altitude group × time), repeated measures ANOVA for subjects that completed all fitness test sessions. Hematological parameters were compared using 2-factor (altitude group × time), repeated measures ANOVAs for subjects that completed all hematological sessions over the entire first year (+46 weeks) at USAFA. A Tukey least significant difference test was used when necessary when a significant interaction existed. A probability level of 0.05 was established a priori to define statistical significance, and based on the previous altitude-related findings at USAFA between SL and MA freshmen (Brothers et al., 2007), 1-tailed statistical tests were used for key hematological ([Hb], Hct, and reticulocyte parameters) and aerobic performance (AFT results and V
Results
As a result of the limited recruitment time (∼2 weeks) following the completion of BCT and a smaller recruitment population, our MA subject population was incomplete (n = 3, only 2 of whom completed the study) during the +8-week blood draw; thus, this time point could not be used in the repeated measures analysis. But the +8-week SL data are still presented to help better describe the pattern of change over time. Of the 55 male subjects initially recruited for the study, 45 subjects (16 MA, 29 SL) completed the remaining 5 hematological appointments, 49 subjects (16 MA, 33 SL) completed all 3 AFT and 3 PFT sessions, and 45 subjects (15 MA, 30 SL) completed both GXT sessions. In total, 44 subjects (15 MA, 29 SL) completed all data-collection sessions (3 AFT/PFTs, 2 GXTs, and 6 blood draws). Reasons for subject attrition included subject withdrawal from the study prior to completion (4), one or more missed appointments (4), dismissal from USAFA for medical or other reasons (3), or an injury that prevented completion of the second GXT (1). Although 18 subjects in total (15 SL and 3 MA subjects) were identified as possibly being iron depleted based on a serum ferritin value less than 20 ng·mL−1 during one or more blood draw, only one subject was determined to have iron-deficient anemia, and his data were excluded from the results.
All subjects met at least two of the three criteria for a valid GXT; of the 92 GXTs, 91 tests resulted in an RER that exceeded 1.10, 92 tests resulted in the subjects achieving ± 10% of age-predicted maximum heart rate; and during 58 tests, subjects produced a clear plateau in V
Hematological analysis
A significant (p < 0.05; main effect) difference between SL and MA subjects existed in [Hb], Hct, serum ferritin, and sTfR values over the entire first year at USAFA. Subjects from MA had a significantly (p < 0.05) higher mean [Hb] (+0.4 g·dL−1, 2.2%) compared with their SL counterparts (Fig. 1). The difference in [Hb] at the first prospective blood draw between SL and MA subjects was approximately 0.85 g·dL−1 (5.5%), but by the final blood draw this difference was only 0.34 g·dL−1 (2.1%). A similar trend existed for Hct, with MA Hct values significantly (p < 0.05) higher over the entire year (+0.9%) than for SL subjects (Fig. 1). In addition, MA subjects displayed significantly (p < 0.001) higher serum ferritin values (+22.7 ng·mL−1, 58.8%), and significantly lower sTfR values (-0.54 mg·mL−1, 11.4%) over the course of the year (Fig. 1). There was no significant difference in EPO between SL and MA subjects for the time points examined (data not shown).
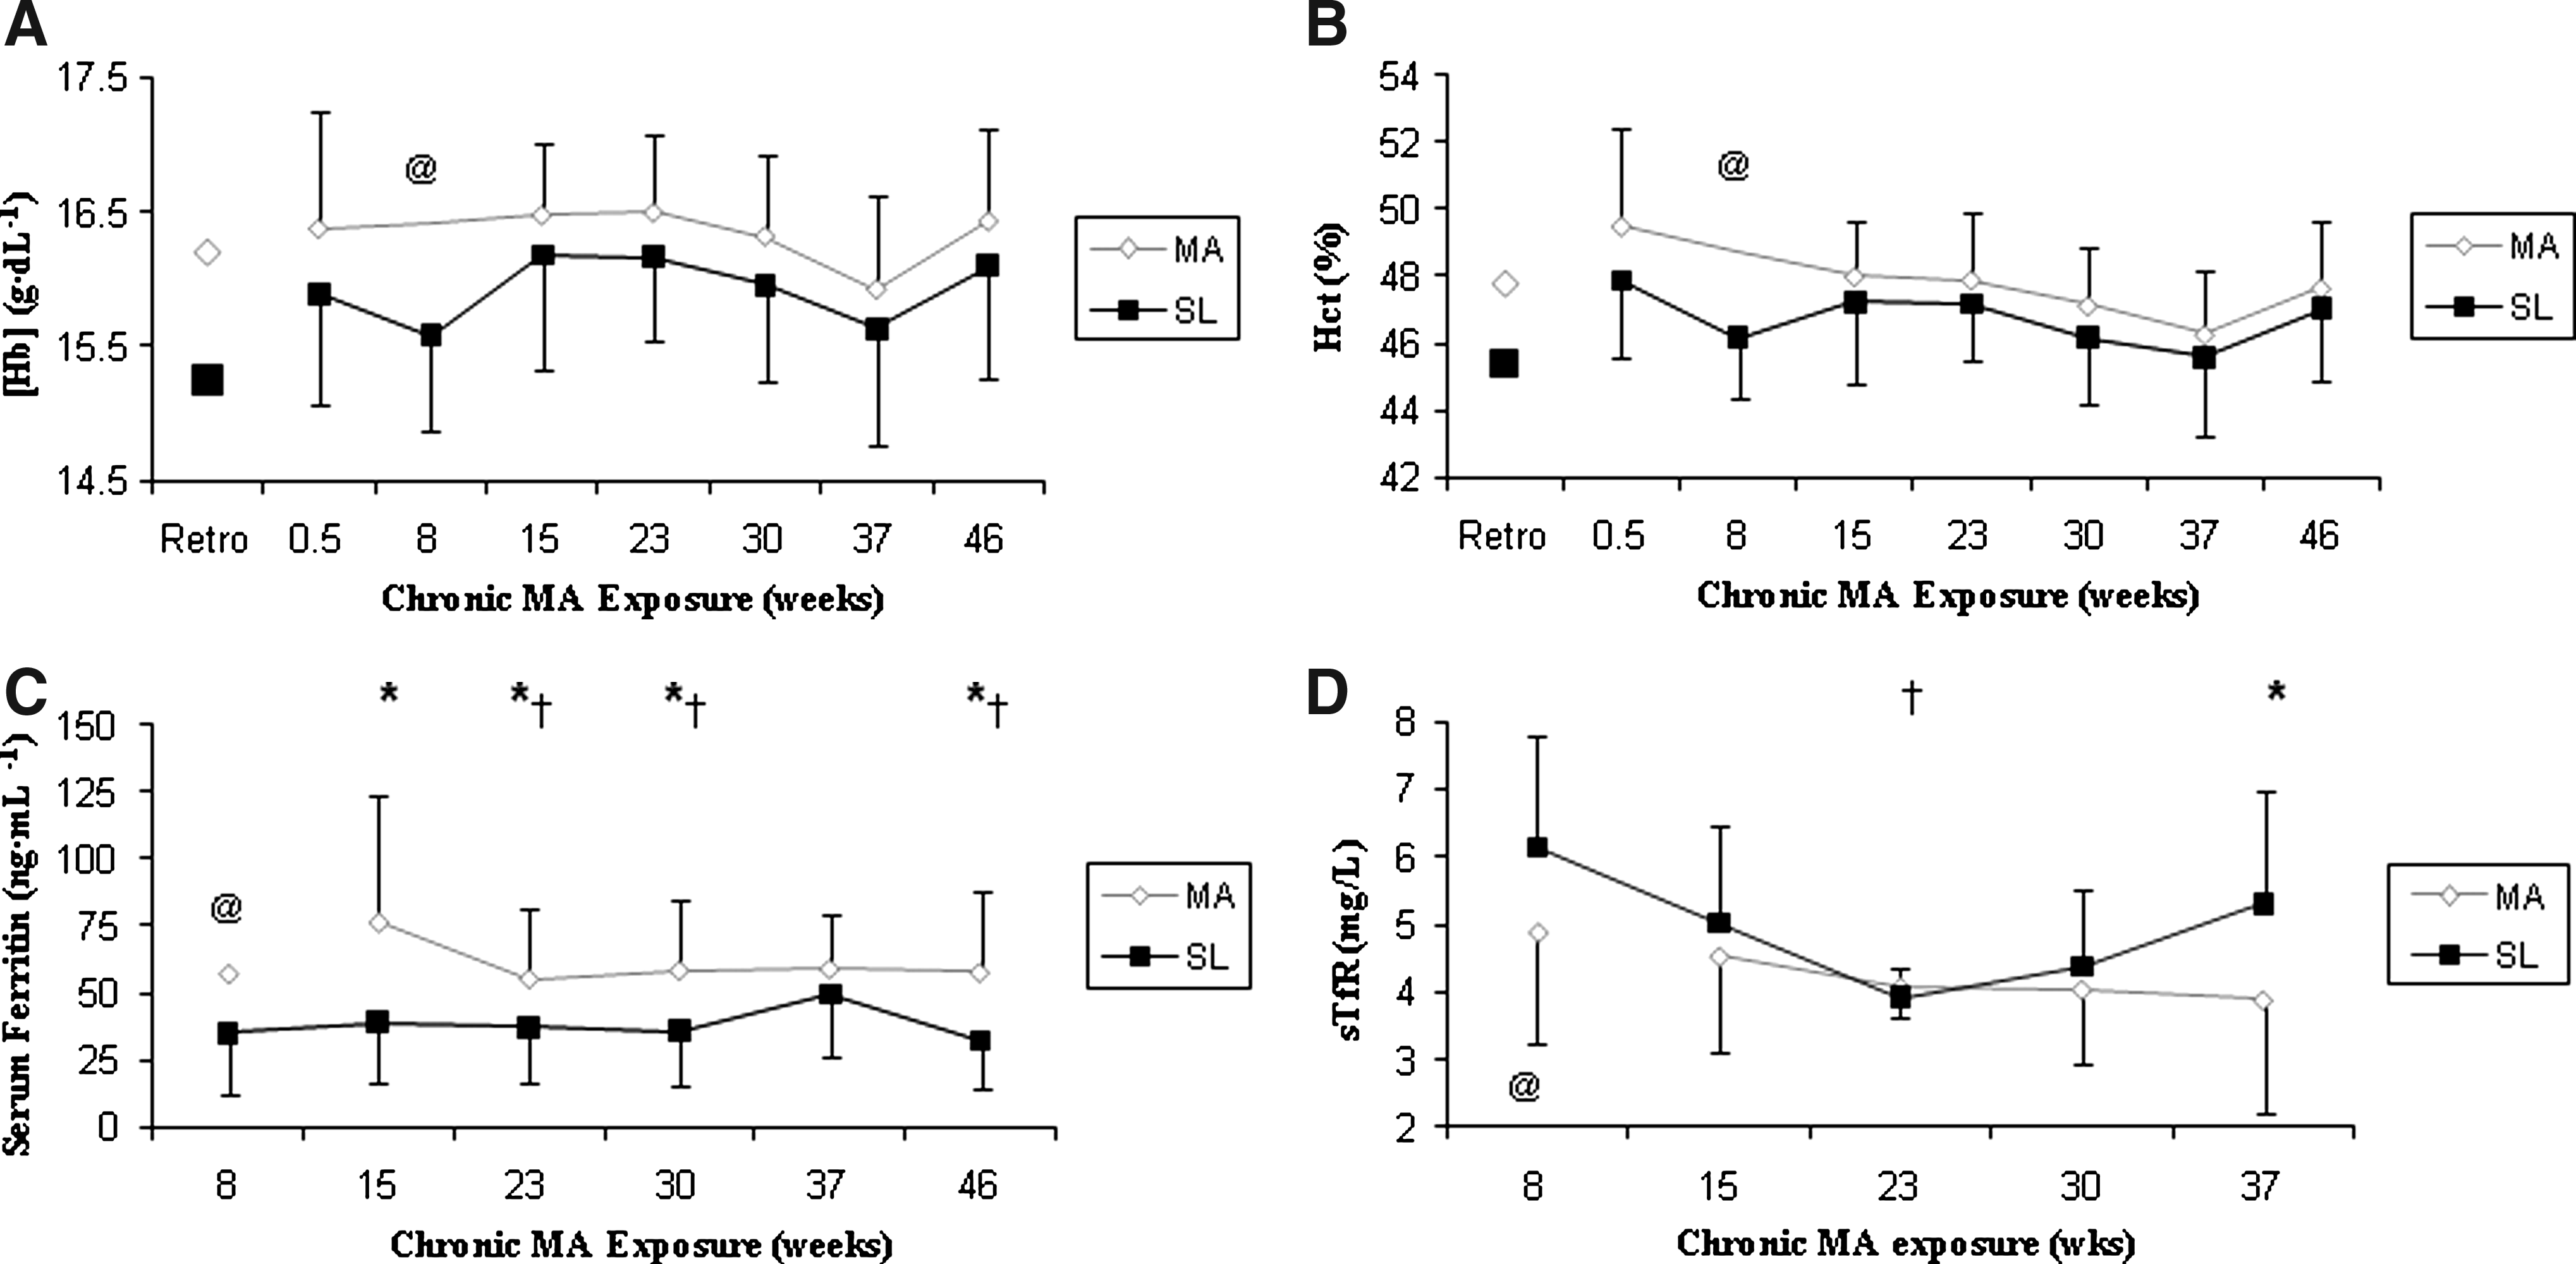
Hematological variables with respect to time of male freshman subjects from either moderate altitude (MA) or sea level (SL) exposed chronically to 2210 m at the U.S. Air Force Academy (USAFA). A significant main effect was observed between altitude groups (P < 0.05) and over time (P < 0.02) in
Although no significant interaction was found in either [Hb] or Hct, a significant (p < 0.05) altitude group × time interaction was found in serum ferritin and sTfR values. Post hoc analysis demonstrated that serum ferritin values were significantly (p < 0.05) higher initially (+15-week value, the first time point available for repeated measures analysis), and MA subjects had significantly (p < 0.05) higher values at every time point examined with the exception of the +37-week blood draw (p = 0.085; Fig. 1). Post hoc analysis also demonstrated that SL subject sTfR values were significantly elevated compared with MA controls at week 37 only (Fig. 1).
A significant (p < 0.01) main effect of time was found in nearly all hematological variables over the course of the entire year. [Hb] showed a gradual increase from acute hypoxia (day 4) to +23 weeks before dropping significantly (p < 0.01) at week 37 and then rebounding at +46 weeks, and Hct displayed a gradual decline until week 37 and then increased significantly (p < 0.01) from the previous two values (Fig. 1). The sTfR values significantly decreased with time to week 23 (p < 0.05) and then increased again following winter break. [Hb], Hct, serum ferritin, and sTfR values of SL and MA subjects with respect to time are displayed in Fig. 1.
Aerobic and physical performance
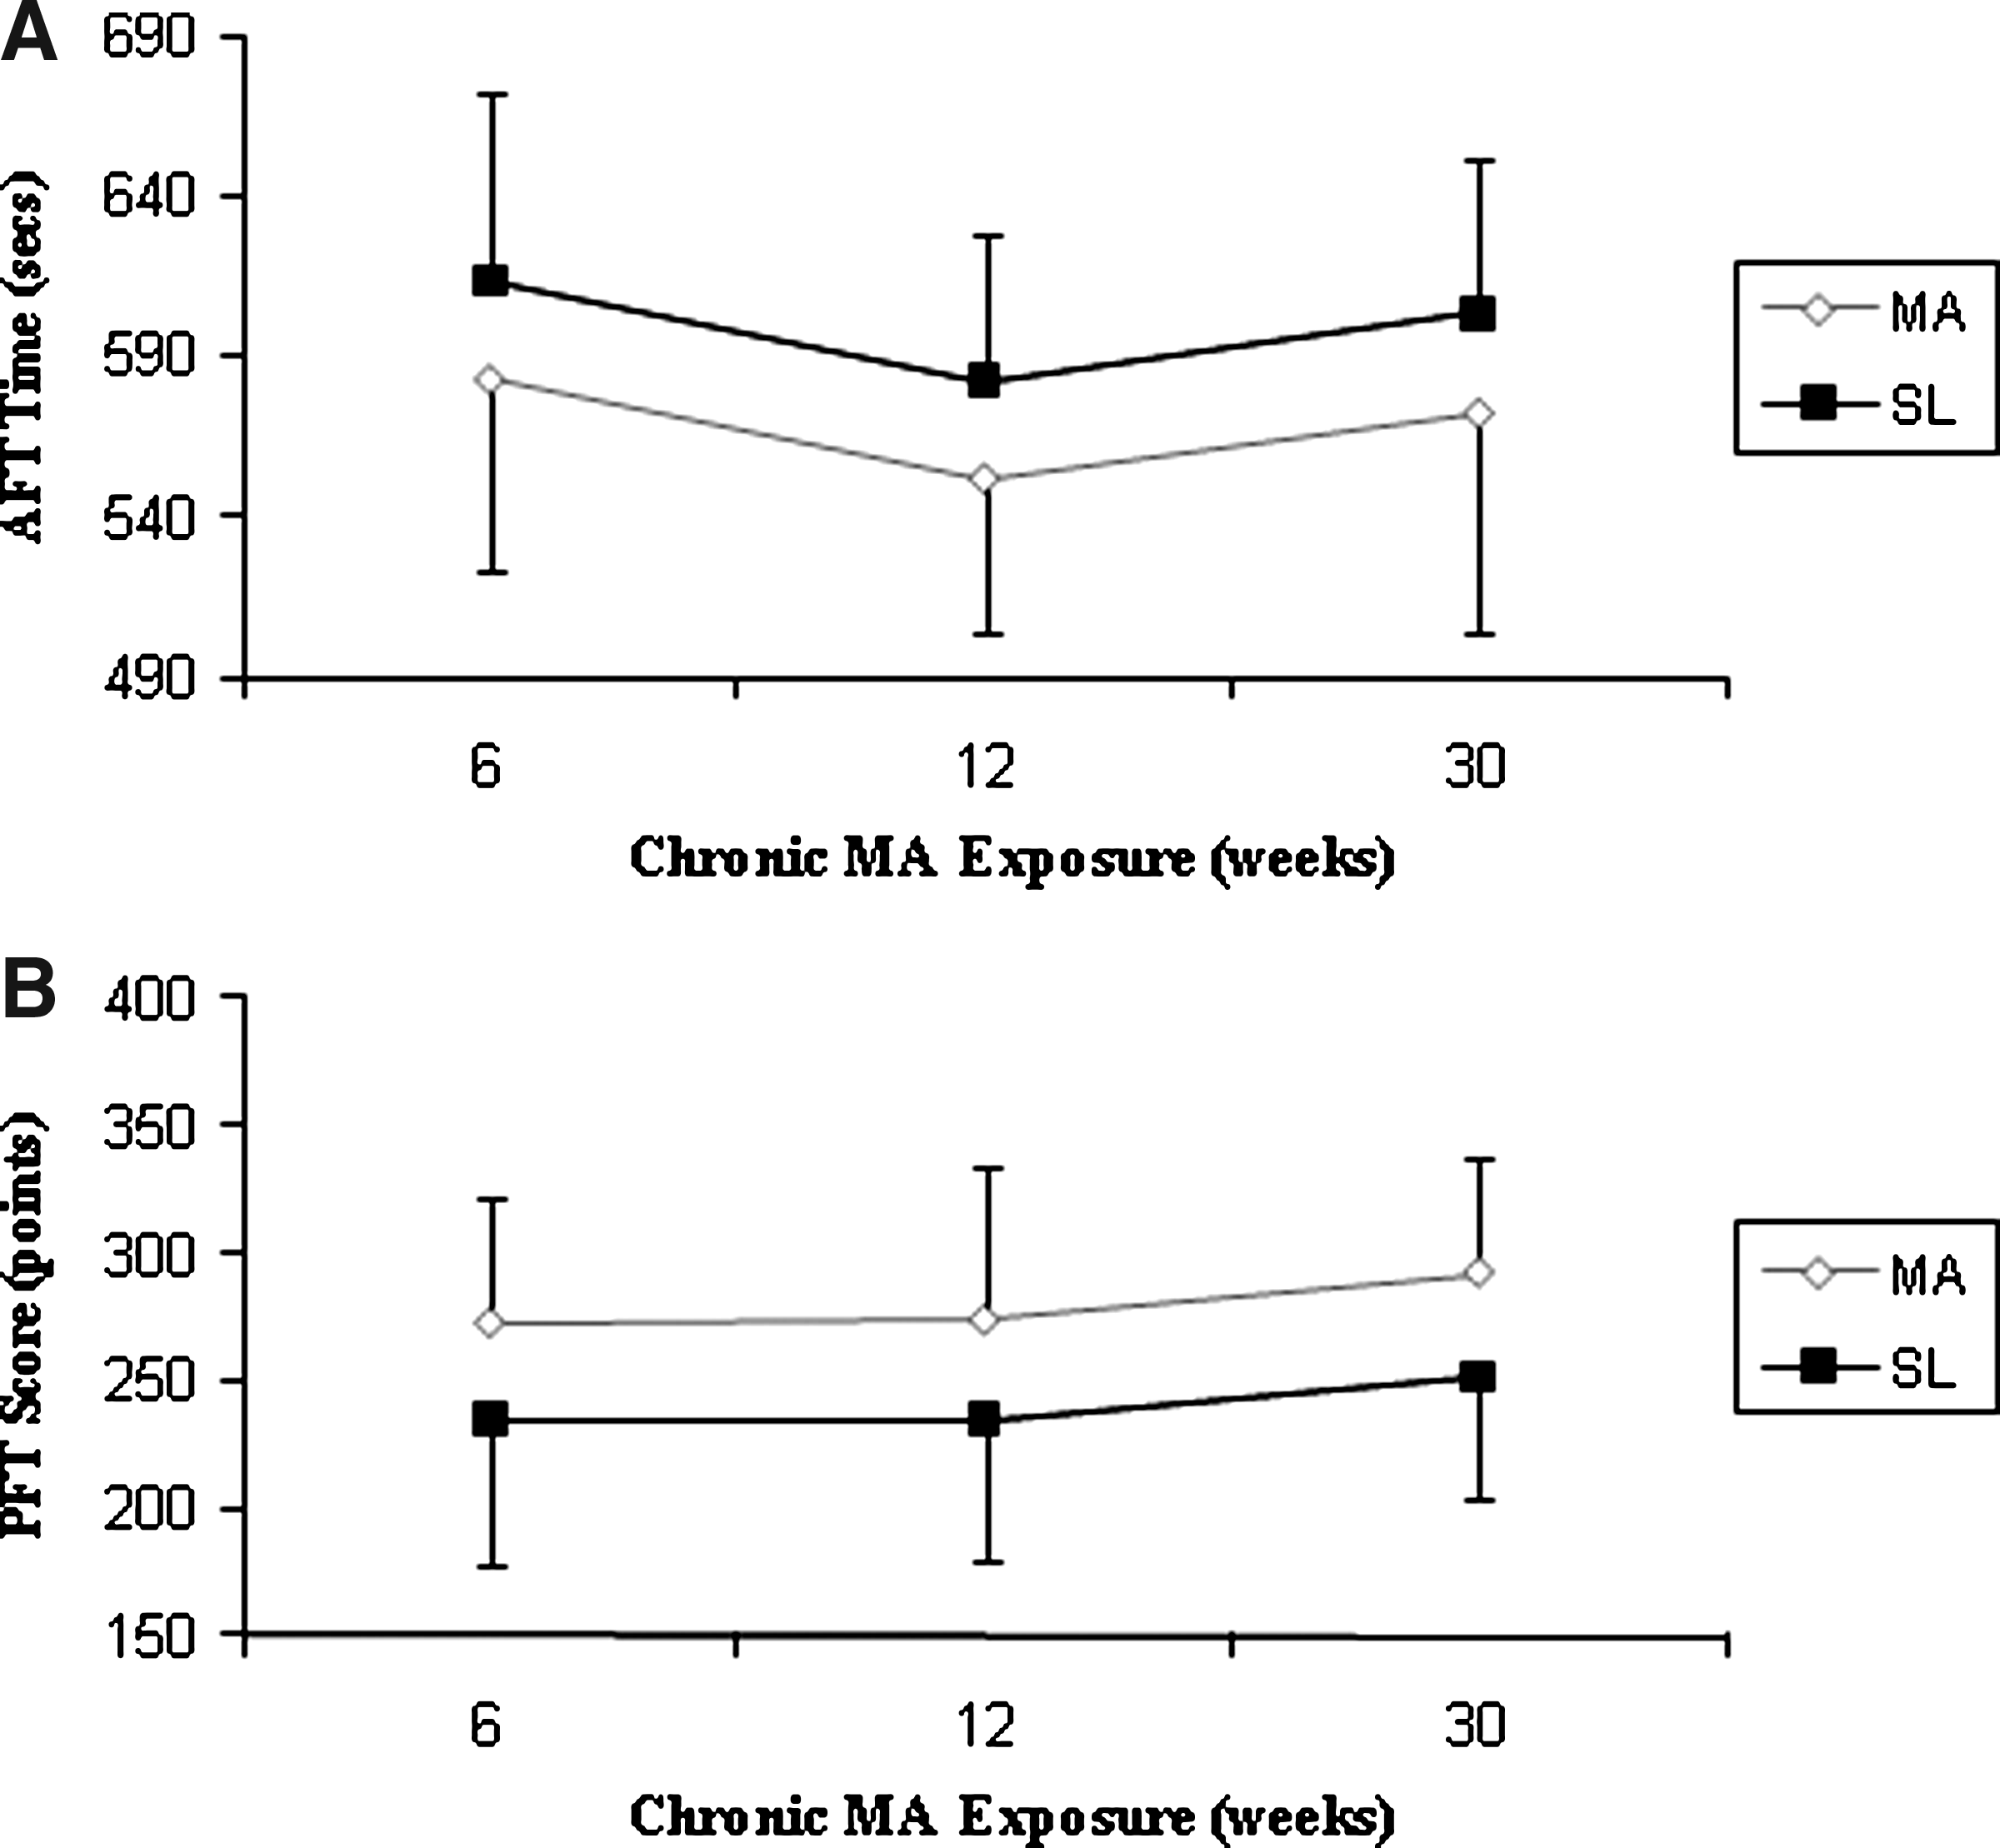
When aerobic performance of the SL and MA subjects was analyzed using the 1.5- mile AFT run, a significant (p = 0.024) main effect was found in AFT run time, with MA subjects completing the 1.5-mile run 31.0 sec (5.4%) faster than SL subjects on average (Fig. 2), which resulted in a significantly (p < 0.05) higher (i.e., better) AFT score (380.3 vs. 346.4 points, 9.8%; data not shown) for MA freshmen compared to their SL counterparts. A significant (p = 0.012) main effect also existed between altitude groups in the PFT, with MA subjects scoring 38.7 points (+16.1%) higher (i.e., better) than their SL counterparts (Fig. 2). Additionally, there was a significant (p < 0.01) main effect of time for both AFT and PFT results, with SL and MA subjects running the week-12 AFT significantly (p < 0.001) faster than either the week-6 or week-30 AFT; the week-30 PFT score was also significantly (p < 0.005) higher than either the week-6 or week-12 PFT score for both SL and MA subjects. There were no significant interactions in either AFT or PFT results. Longitudinal results of the AFT run and PFT score with respect to time are shown in Fig. 2.
Physiological responses
Repeated measures analysis demonstrated that a significant (p = 0.011) main effect for the altitude group occurred in normalized V

Values are means ± SD. MA, moderate altitude; SL, sea level; GXT, graded exercise stress test; HR, heart rate; Sp
Significantly different from MA (p < 0.05).
Significantly different from semester-1 GXT (p < 0.05).
Subjects from MA also had superior running economy compared with the SL subjects. When running velocity was standardized across all subjects (subject's normalized V
A significant (p < 0.05) altitude group × time interaction occurred in submaximal RPE. SL subjects perceived the submaximal portion of the GXT as being significantly (p = 0.031) easier (7.0%) during the second-semester (+42 weeks) test versus the MA subjects, who perceived the submaximal stage to be 4.0% harder (Table 2). Subjects from MA also displayed a significantly (p = 0.001) higher (+1%) resting Sp
Finally, several GXT parameters displayed a significant (p < 0.05) main effect of time: Sp
Discussion
The purpose of this study was to prospectively evaluate long-term MA acclimatization using the unique USAFA model by longitudinally examining the differences in hematological and physiological parameters between former SL and MA residents exposed to MA (2210 m) for nearly 1 yr. Although acclimatization to MA is typically thought to require minimal adaptation and occur rapidly (i.e., 4 to 6 weeks), the results of a retrospective study we performed at this location using a similar approach suggested that acclimatization to this altitude required more than 7 months. The results of this study support our hypothesis, and a significant new finding of this study is that, in a physically active population, hematological (based on [Hb]) and physiological acclimatization to MA requires a much longer duration on average than previously thought.
Erythropoiesis and hematological acclimatization to MA
Although it appears that much (∼70%) of the [Hb] difference between former SL and MA subjects is ameliorated after 15 weeks, the remaining difference in [Hb] was statistically significant (p < 0.05) for the rest of the year (with no significant interaction). It is possible that the continued significant difference in [Hb] between SL and MA subjects after + 15 weeks is the result of a longer duration than previously thought for polycythemia, and the gradual expansion of plasma volume back to preacute hemoconcentration levels. Although no one has examined the full duration for hematological acclimatization to MA, other studies have demonstrated that the decrease in plasma volume owing to altitude-related hemoconcentration can take 4 or more months to return to prealtitude values at higher (4000 + m) elevations (Reynafarje et al., 1959).
Without assessing total hemoglobin mass (THM), it is impossible to accurately determine the degree of erythropoiesis that occurred. Since changes in [Hb] and Hct can be altered by plasma volume shifts, it is difficult to calculate the theoretical improvement in oxygen-carrying capacity among our SL subjects. Theoretically, shifts in plasma volume could account for all the changes we observed. However, our retrospective analysis of former SL cadets at USAFA (n = 1000+) found a 1.5 g·dL−1 (+10%; p < 0.01) increase in [Hb] on average after long-term (2.5 yr) exposure, but no difference (p > 0.05) between SL and MA cadets after 17, 23, or 30 months at USAFA (Brothers et al., 2007). Therefore, if the changes in [Hb] observed in these two studies are solely a result of a plasma volume shift, these appear to be permanent, which seems unlikely. Additionally, significant (p < 0.05) elevations in the index of reticulocyte fraction (IRF, +8%) were found acutely in the retrospective study (Brothers et al., 2007), and current SL subjects' IRF on day 4 was similarly elevated (+11.0%) compared with that of the MA subjects, which neared significance (p = 0.071) versus our MA group. Our SL subjects' serum ferritin values were also significantly lower, and sTfR values were elevated for the majority of the year compared with their MA classmates, despite all subjects consuming very similar USAFA diets. This suggests that SL subjects were utilizing significantly more iron for erythropoiesis. It is more likely that early increases in [Hb] were owing to plasma volume (PV) shifts, whereas erythropoiesis and corresponding PV increases accounted for the long-term changes. We did see a drop in hematological values among all subjects immediately after a mandatory 3-day weekend of intense military and physical training (8 to 12 h/day at the end of week 36). We suspect that the significant drop in [Hb] and Hct was the result of PV expansion owing to this intense 3-day bout of physical training.
Additional support for the idea that our SL subjects increased their THM can be found among cross-sectional comparisons of trained and untrained individuals residing at either SL or 2600 m, which have found significant differences in [Hb], Hct, and THM between altitude conditions (Boning et al., 2001; Schmidt et al., 2002). Despite our study utilizing a slightly lower elevation than these studies, the altitude-related differences that are reported are very similar to the differences observed in SL and MA cadets at USAFA.
Although the significant main effect for the altitude group with no significant interaction over time that we found in [Hb] over 46 weeks at 2210 m may be viewed skeptically, a study performed by Reynafarje and colleagues (1959) supports our findings; they found a continued increase in red cell and total blood volume among SL residents exposed to 4900 m during one entire year. At the completion of the study, the former SL subjects had still not obtained the same blood volume as native residents, forcing these authors to conclude that 1 yr was insufficient time for complete hematological acclimatization. Unfortunately, this is the only other long-term longitudinal study that we are aware of that has examined SL residents at altitude for this length of time. While we might assume that hematological adaptation would occur rapidly at MA, this may not be the case, and hematological acclimatization to MA may be prolonged owing to the fact that the stimulus is less robust than it would be at a higher altitude.
Physiological acclimatization and physical performance
The sea-level subjects' aerobic and physical-fitness performance was negatively affected at this altitude compared with their MA classmates, and based on the current and previous findings, the effect of MA may require up to 15 months for complete physiological acclimatization. Our retrospective study at USAFA found that significant altitude-related differences in the 1.5-mile AFT run persisted through the entire freshmen year (1.5, 3, and 7 months), but former SL and MA cadets' AFT results were no longer different at month 15 and thereafter, suggesting that acclimatization required between 7 and 15 months (Brothers et al., 2007). The current subjects' AFT results support our previous findings; SL subjects ran the 1.5- mile AFT significantly slower (+5%), which resulted in significantly lower (i.e., worse) AFT scores (-10%) over the entire first year. This finding was surprising, given the extremely homogeneous nature of the USAFA cadet population resulting from the rigorous athletic and physical-fitness requirements that must be met by cadet candidates prior to being accepted by USAFA (Brothers et al., 2007). The altitude-related differences between former SL and MA subjects were also apparent in V
Despite apparent hematological adaptations, SL subjects' maximal aerobic capacity and running economy were still significantly reduced compared to their MA counterparts. This is not the first study that has demonstrated altitude-related differences in GXT results following long-term altitude exposure. Niu and colleagues (1995) cross-sectionally compared the maximal aerobic capacity of 175 SL residents and altitude natives who were exposed to 3680 m for 7, 15, and 27 months. Significant differences were found between SL and altitude natives in V
The subjects in our current study displayed the same cyclic trend in the AFT as found in our retrospective study (Brothers et al., 2007), with the spring-semester fitness test, which occurs in late January, being significantly slower (+3.8%) than the fall test occurring in September. This change cannot be caused by reduced aerobic fitness during the second-semester test, as we hypothesized in our retrospective study (Brothers et al., 2007), because there was no change in V
Finally, PFT scores were significantly higher the entire first year among our MA subjects compared with the SL subjects. This finding supports our retrospective results, which found PFT scores to be significantly higher among MA cadets over the first 3 yr at USAFA compared with SL cadets (Brothers et al., 2007). Although the individual PFT events (push-ups, sit-ups, pull-ups, and standing long jump) are anaerobic in nature, the circuitlike PFT may result in the test having a significant aerobic component, which could partially explain the differences observed in this study during a cadet's first year at USAFA. However, it is possible that incomplete recovery or differences in economy between SL and MA subjects may play a more prominent role in these altitude-related differences, because our SL subjects' economy was still significantly worse than that of their MA counterparts after +46 weeks at USAFA. Unfortunately, the current study did not provide any additional insight into the reasons for these differences, and future research in this area is warranted.
Conclusions
Although it is generally believed that acclimatization to MA occurs rather rapidly, the scientific support backing this statement is sparse. USAFA seems to offer a good model for long-term MA adaptation, and the results of this study support the findings of our retrospective study, which suggested that 7 to 15 months may be necessary for complete acclimatization to MA. Significant hematological differences between former SL and MA subjects persisted the entire year, as did aerobic performance in the 1.5-mile AFT run and maximal aerobic capacity. These results suggest that complete acclimatization to 2210 m by former SL residents may require lengthy physiological adaptations since both hematological and physical performance differences persisted between groups. Further research at this uniquely well controlled MA setting is warranted.
Footnotes
Acknowledgments
We thank Mr. Scott Dunbar at Beckman-Coulter for reagent. We thank Lts. Zachary Garrett and Courtney Hemmert, Niki Bannister, Luisa Sullivan, and Benton Westergaard for their assistance in the GXT data collection. Additionally, we would like to thank Dr. (Lt. Col.) Mel Fotinos, Lt. Col. William Barnes, Mrs. Nadine Alexander, T. Sgt. Gregory Stapleton, S. Sgt. Christine Ramler, S. Sgt. Justin Mallon, S. Sgt. Nicole Ehrorn, S. Sgt. George Diaz, S. Sgt. Anne Kramer, S. Sgt. Mary
This research was partially funded by a grant from the Air Force Research Laboratory.
Disclosures
The views expressed are those of the authors and do not reflect the official policy or position of the United States Air Force, the Department of Defense, or the U.S. Government. The authors have no conflicts of interest or financial ties to disclose.