
Abstract
Abstract
Boos, Christopher J., Pete Hodkinson, Adrian Mellor, Nicholas P. Green, and David R. Woods. High Alt. Med. Biol. 13:105–111.—This study investigated, for the first time, the effects of simulated high altitude, following acute hypobaric hypoxia (HH), on simultaneous assessment of large artery stiffness and endothelial function and its inter-relationship to left ventricular (LV) diastolic function, pulmonary artery systolic pressure (PASP), and estimated PA vascular resistance (PVR). Ten healthy subjects were studied at baseline pre and following acute HH to 4800 m for a total of 180 minutes. Assessments of LV diastolic function, mitral inflow, estimated LV filling pressure (E/e’), PVR, and PASP were undertaken using transthoracic echocardiography. Simultaneous assessments of arterial stiffness index (SI), systemic vascular resistance (SVR), vascular tone, and endothelial function (reflective index [RI]) were performed using pulse contour analysis of the digital arterial waveform. Acute hypoxia led to a fall in SpO2 (98.1±0.7 vs. 71.8±7.1%; p=0.0002), SVR (1589.1±191.2 vs. 1187.8±248.7; p=0.004), and RI (50.8±10.3 vs. 33.0±6.5%; p=0.0008) with an increase in PASP (24.3±2.2 to 35.0±5.3 mmHg; p=0.0001) and estimated PVR (116.40±19.0 vs. 144.6±21.5; p<0.001). There was no rise in either SI (p=0.13), mitral early annular early e’ filling velocity or E/e’. There was a significant inverse correlation between SpO2 and PASP (r=−0.77; p<0.0001), PVR (r=−0.57; p=0.008) and between the fall in SpO2 and change (Δ) in RI (baseline vs. 150 min, r=−0.52; p<0.001). There was a modest inverse correlation between ΔRI (lower ΔRI=worsening endothelial function) and ΔPAP (r=−0.55; p=0.10) and a strong inverse correlation between ΔRI and ΔPVR (r=−0.89; p=0.0007). Acute hypobaric hypoxia does not significantly alter large artery stiffness or cause overt LV diastolic function. However, the degree of hypoxia influences both the systemic endothelial and pulmonary vascular responses. This noted association is intriguing and requires further investigation.
Introduction
Endothelial activation and even dysfunction has been observed in both the systemic and PA circulation following hypoxia in healthy controls (Goerre et al., 1995; Johnson et al., 2002) and among individuals prone to HA pulmonary oedema (HAPE) (Berger et al., 2005; Scherrer et al., 2010). The endothelium is also a principle regulator of arterial stiffness (Wilkinson et al., 2002; Boos et al., 2007). There have been very few studies that have investigated the effects of hypoxia on arterial stiffness and its relationship to endothelial function under hypoxic conditions and the findings have been inconsistent (Vedam et al., 2009; Chung et al., 2010; Rhodes et al., 2011). This has clinical implications as changes in arterial stiffness influence diastolic function and left ventricular (LV) filling (London et al., 2004; Chung CM et al., 2010; Erdogan et al., 2007). Variable changes in LV diastolic function (including no change in some studies) have been reported (Boussuges et al., 2000; Huez et al., 2005; Kjaergaard et al., 2006, Holloway et al., 2011) and in a single study the degree of LV diastolic dysfunction was linked to the rise in PASP (Alleman et al., 2005). However, the influence of arterial stiffness on LV filling and diastolic function has not reported following acute hypoxia in humans.
In this study, we sought to investigate, for the first time, the effects of simulated HA, following acute hypobaric hypoxia, on simultaneous assessment of arterial stiffness and endothelial function and its inter-relationship to LV diastolic function and PASP. We hypothesized that the increase in PASP would lead to reciprocal changes in endothelial function, arterial stiffness and LV diastolic function.
Methods
This was a prospective interventional study that included ten healthy British military servicemen aged 18-35 years. Confirmation of health status was undertaken via a detailed history and clinical examination by qualified general practitioner and further secondary assessment by an aviation-specialized occupational physician. All subjects were also required to be in sinus rhythm and have a normal baseline echocardiogram study. All subjects avoided any caffeine or stimulants as well as smoking for 12 hours prior to the first baseline measurements. The study was approved by the Ministry of Defence Research and Medical Ethics Committee.
Simulated altitude
Simulated HA was undertaken using a hypobaric chamber. Barometric pressure in the hypobaric chamber was reduced at a rate of 1219 m (4000 ft) per minute until a final simulated altitude equivalent to 4800m (15,748 ft). All volunteers continued to breathe ambient air throughout the exposure for a total duration of 3 hours at 4800 m. The temperature in the chamber was maintained at 22-24°C. The target altitude was held with constant cross-ventilation of the chamber such that the concentration of oxygen in the chamber remained at 20.9% throughout the study. After a total time of 180 minutes at 4800 m, the hypobaric chamber was recompressed to ground level at 1219 m per minute. All investigators within the chamber breathed enriched oxygen via a face mask for the duration of the study. HA related symptoms were assessed using the Lake Louis Scoring System (LLS) (Roach et al., 1993).
Physiological measurements
Simultaneous resting recordings of oxygen saturations (SpO2) and heart rate were performed using a Nellcor NP-20 pulse oximeter (Covidian, MA, USA). Blood pressure was measured using an automated blood pressure cuff with the subject sat upright for >10 minutes at rest (Omron MX2; Omron®, Ca, USA)
Assessments of arterial stiffness and vascular tone
Assessments of large artery stiffness, using the stiffness index (SI), and vascular tone, by reflectivity index (RI) were undertaken using pulse contour analysis of the digital volume pulse (DVP) measured from the index finger of the nondominant hand (Pulse Trace PCA2; CareFusion™, Basingstoke, Hants, UK (Millasseau et al., 2002; Boos et al., 2007). The DVP consists of two traveling pulse waves: the first represents an early systolic peak and relates to pressure waves transmitted along a direct path from the ventricle to the finger, where it generates a consequent measured change in blood volume and the second peak or point of inflection occurs a short time later and reflects pressure waves that have been reflected from along the aorta and larger arteries from major impedance sites in the lower body (FIG. 1). The reflectivity index (RI) is a measure of vascular tone in the small medium sized muscular arteries, in which the higher the RI, the higher the greater the vascular tone (figure 1) (Millasseau et al., 2002; Boos et al., 2007). Quantification of the changes in arterial RI (ΔRI) is a validated method of assessing endothelial function, whereby a lower ΔRI equates to worsening endothelial function as a less reactive vascular system (Chowienczyk et al., 1999; Wilkinson et al., 2002). The arterial SI is relates to the subjects height divided by the time difference between inflection points (the peak-to-peak time) (FIG.1). As arterial stiffness increases (higher SI) reflected waves will appear closer to the forward wave due to the increased pulse wave velocity (Millasseau et al., 2002; Boos et al., 2007). All pulse wave assessments were undertaken with the subjects fully relaxed and seated having rested for at least ten minutes in a temperature controlled environment (22-24°C). Pulse waveform analyses were performed 30 minutes prior to and at 45, 90, and 150 minutes after exposure to simulated HA.

Illustration of the methods used to calculate the arterial reflective index (RI) and stiffness index (SI).
Echocardiographic assessment
All echocardiographic assessments were undertaken using a portable Vivid Q echocardiogram machine (GE Healthcare™, Amersham, Bucks, UK) with a 1.5-3.6 MHz S4 transducer. An initial baseline echocardiogram was performed at 30 minutes prior to and at 150 minutes of simulated HA exposure at the same time as the first and final arterial wave form analysis. PASP was calculated as the sum of the right atrial pressure (assessed by inferior vena caval size and collapse with inspiration) and the right ventricular systolic pressure (assessed using continuous wave Doppler of the tricuspid valve). Cardiac output was assessed by quantification of the LV outflow tract (LVOT) dimension, the LVOT velocity time integral and simultaneous heart rate. The aortic systolic flow velocity integral (SVI), using pulse wave doppler profile of aortic blood flow from the apical five chamber view and the cross sectional area (CSA) of the LVOT was used to calculate the cardiac out put (SV=SVI×LVOT CSA). The systemic vascular resistance (SVR) was calculated as the mean arterial pressure×80 divided by the cardiac output (Johnson et al. 2001). The PA vascular resistance was estimated using the following equation PVR=80×([10×TRV/VTI RVOT] + 0.16) (dynes / sec / cm−5) where TRV was the maximal tricuspid regurgitation velocity and VTI RVOT was the velocity time integral of the right ventricular (RV) outflow tract velocity measured using pulsed wave doppler at the level of the pulmonary valve in the parasternal short axis view (Abbas et al., 2003; Bossone et al., 2005). The pulsed wave sample volume of the conventional doppler was placed at the tips of the mitral valve leaflets. The obtained variables included peak early transmitral flow velocity (E, cm/s), deceleration time (ms) of early diastolic transmitral filling and peak flow velocity (A, cm/s) of late diastolic transmitral filling, the isovolumetric relaxation time (in ms) and the E/A ratio (Paulus et al., 2007). Tissue doppler imaging (TDI) was used to calculate the early diastolic filling (e’) velocity of the basal lateral and basal septal mitral valve annulus which were measured separately (Paulus et al., 2007). TDI was also used to quantify the respective left ventricular isovolumic contraction (IVCT) and isovolumic relaxation times (IVRT). Estimation of LV filling pressure was undertaken from the ratio of mitral valve E (early filling) velocity divided by average e’ (Paulus et al. 2007).
Statistical analysis and power calculations
Data were analyzed using GraphPad InStat version 3.05 and with all graphical figures presented using GraphPad Prism version 4.00 for Windows (GraphPad Software, San Diego, CA, USA; www.graphpad.com). The Kolmogorov-Smirnov test was undertaken to assess normality of all continuous data. Paired continuous data comparisons were undertaken using the paired t test for normally distributed data and the Wilcoxen matched pairs test for nonparametric data, respectively. Time-dependent comparisons of ≥3 groups was performed with repeated measures ANOVA for normally distributed data, with the Tukey post test for all significant results. Repeated measures of nonparametric continuous data were performed using the Friedman test with posttest for all significant results. Correlation was assessed using Pearson and Spearman correlation coefficients for normal and nonparametric data respectively. A two tailed p value <0.05 was considered statistically significant for all comparisons.
Sample size calculations were performed using GraphPad StatMate version 2.00 for Windows (GraphPad Software). In a previous study of eight subjects Thomson et al demonstrated a 10% fall in augmentation index following acute hypoxia (Thomson et al., 2006). In another previous study, also of eight subjects, Blitzer et al demonstrated a significant increase in PA vascular resistance and fall in systemic vascular resistance (SVR) following acute hypoxia (Blitzer et al., 1996). Hence, based on this previous data coupled with our own previously published healthy population data (Boos et al., 2007) it was calculated that a sample size of 10 subjects would have a >80% power to detect a >8% change in arterial stiffness index as well as any significant changes in pulmonary artery vascular resistance and SVR with a two-tailed significance level of 0.05.
Results
The average age of included subjects was 29.7±3.0 years with 70% being male. They weighed 77.9±17.5kg, were 177.9±17.5 cm tall with an average body mass index and abdominal waist circumference of 25.7±3.4kg/m2 and 84.2±7.6cm, respectively. Acute hypobaric hypoxia lead to an increase in heart rate from 61.0±6.0 to 80.1±11.8 beats/minute (p=0.0001) and reduction in oxygen saturations from a baseline level of 98.1±0.7 to 71.8±7.1% (p=0.0002). Compared with baseline levels there was a significant increase in LLS scores (0 vs. 3.4; range 0–10; p=0.02).
There was no significant rise in arterial SI (p=0.13; Table 1). However, acute hypoxia led to a significant reduction in both arterial RI (p=0.0008) and the SVR (0.0004) with an associated fall in both systolic blood pressure (p=0.006) and mean arterial blood pressure (p=0.032) (Table 1 and Fig. 2). There was no association between arterial SI and estimated LV filling pressure (E/e’; p=0.83). However, SI correlated with mean arterial blood pressure (r=0.39; p=0.01). There was a positive correlation between RI and SVR (r=0.46; p=0.043), systolic blood pressure (r=0.46; p=0.003), mean arterial blood pressure (r=0.33; p=0.035) and pulse pressure (r=0.50; p=0.001) but not diastolic blood pressure (NS).
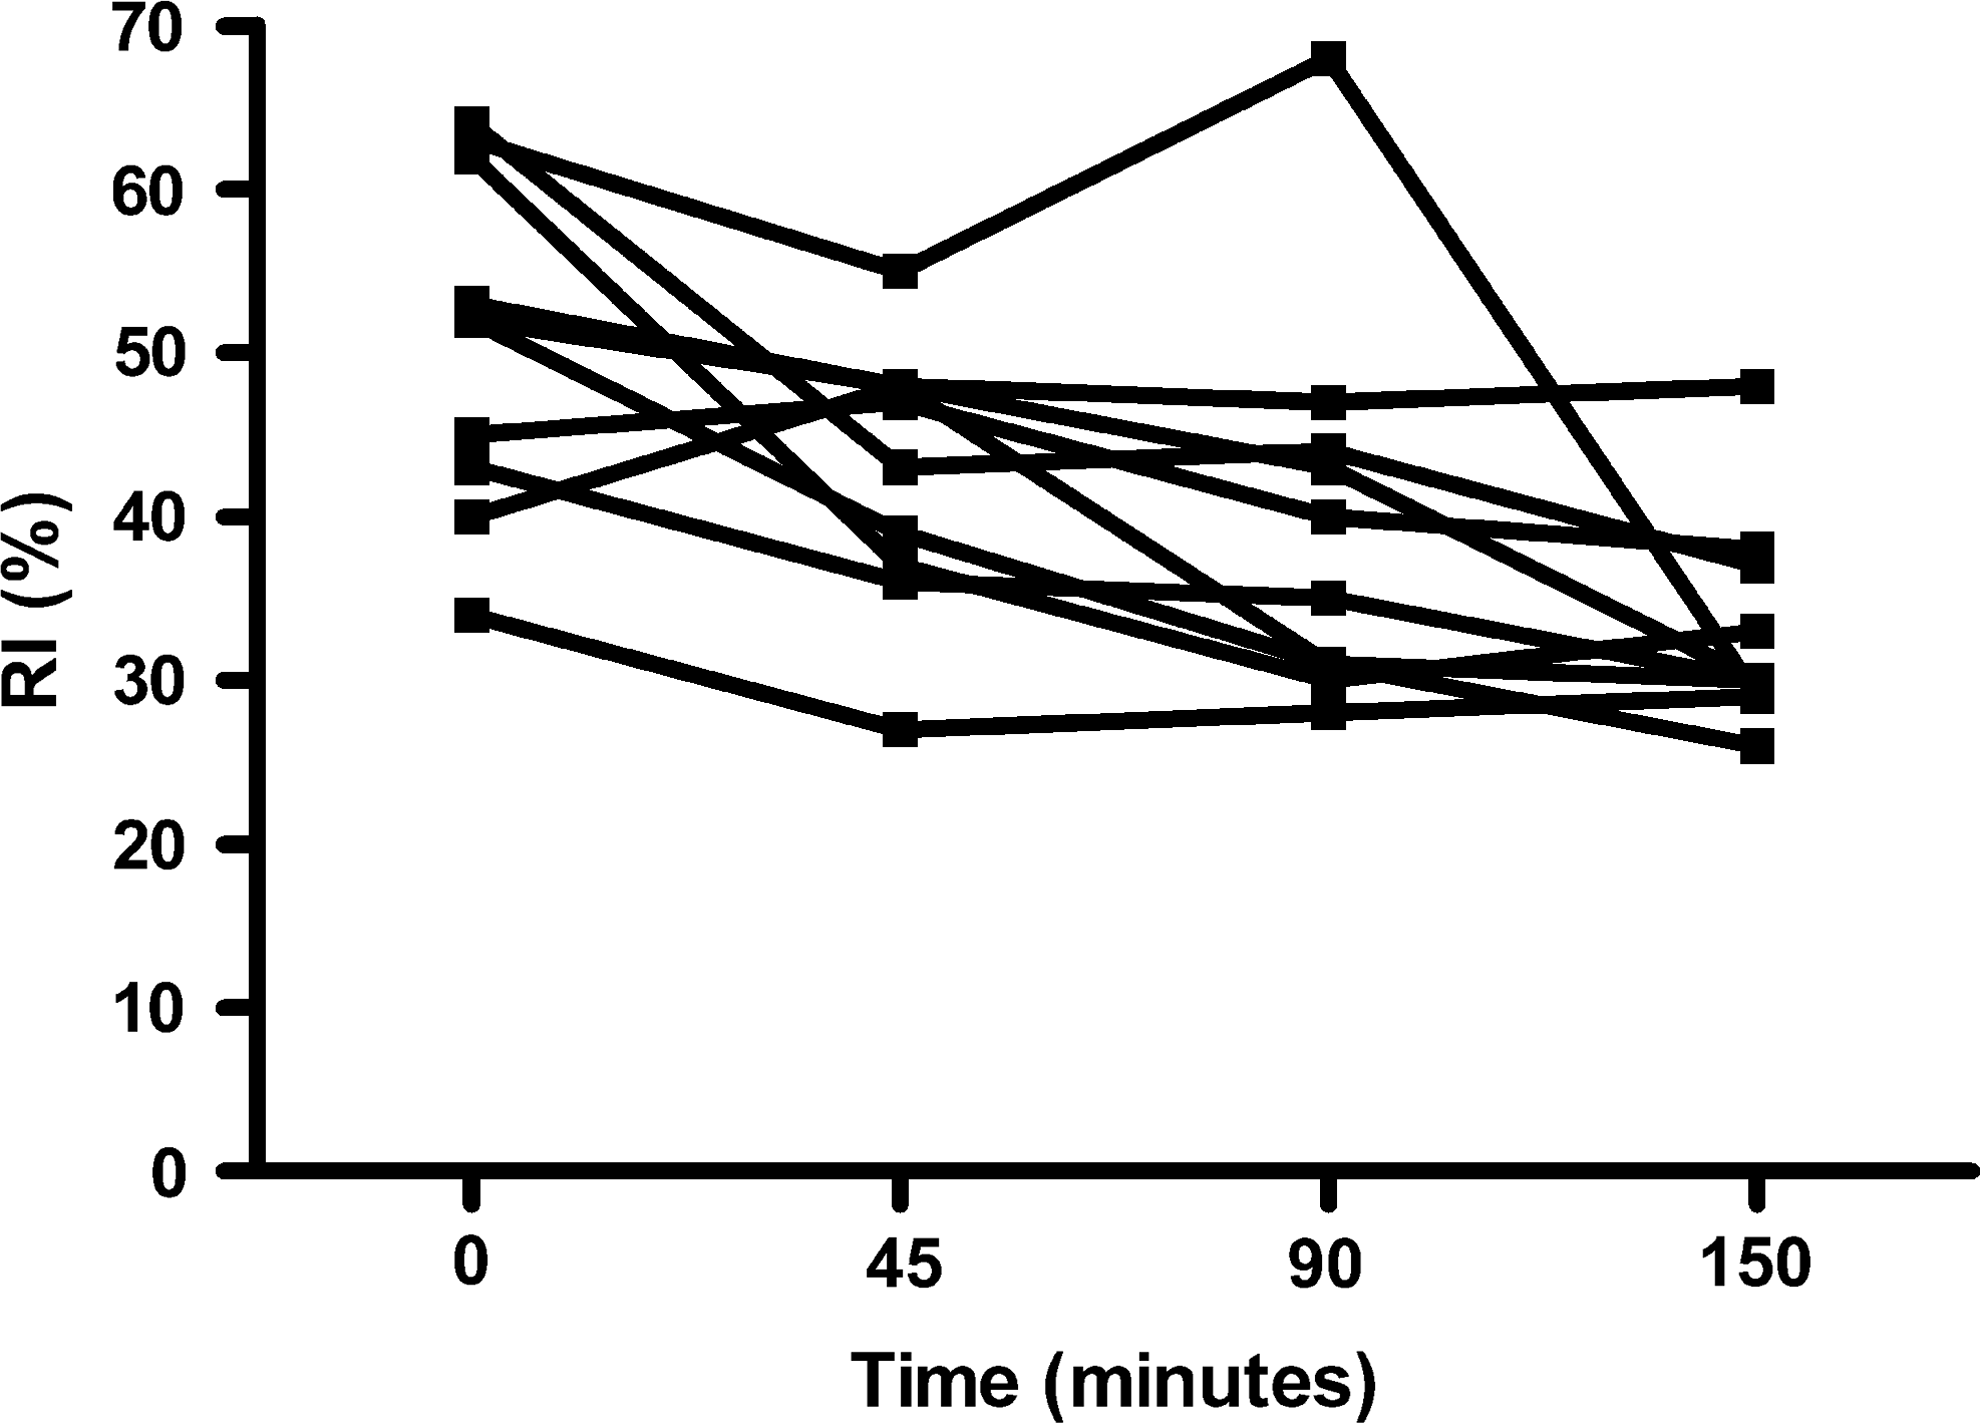
Changes in arterial reflective index (RI) following exposure to acute hypobaric hypoxia.
Significant difference (p<0.05) between baseline and 45 minutes; ††Significant difference baseline and 90 minutes; ††† Significant difference baseline and 150 minutes.
Acute hypoxia increased (baseline vs. 150 minutes) PASP (24.3±2.2 vs. 35.0±5.3 mmHg; p=0.0001) and estimated PVR (116.4±10.0 vs. 144.6±21.4; p<0.0001). Estimated LV filling pressure (E/e’) remained unchanged (p=0.78) (Table 1). There was no change in mitral early inflow (E) velocity (p=0.21) or average early e’ velocity (p=0.13) with hypoxia (Table 2). There was no correlation between arterial SI, RI or PASP and LV filling pressure (E/e’). There was a significant inverse correlation between SpO2 and PASP (r=−0.77; p<0.0001), PVR (r=−0.57; p=0.008) (Fig. 3) and between the degree of fall in SpO2 and change (Δ) in RI (r=−0.52; p<0.001). There was a modest inverse correlation between ΔRI and ΔPAP (r=−0.55; p=0.10) and a strong inverse correlation between ΔRI and ΔPVR (r=−0.89; p=0.0007) (Fig. 4).
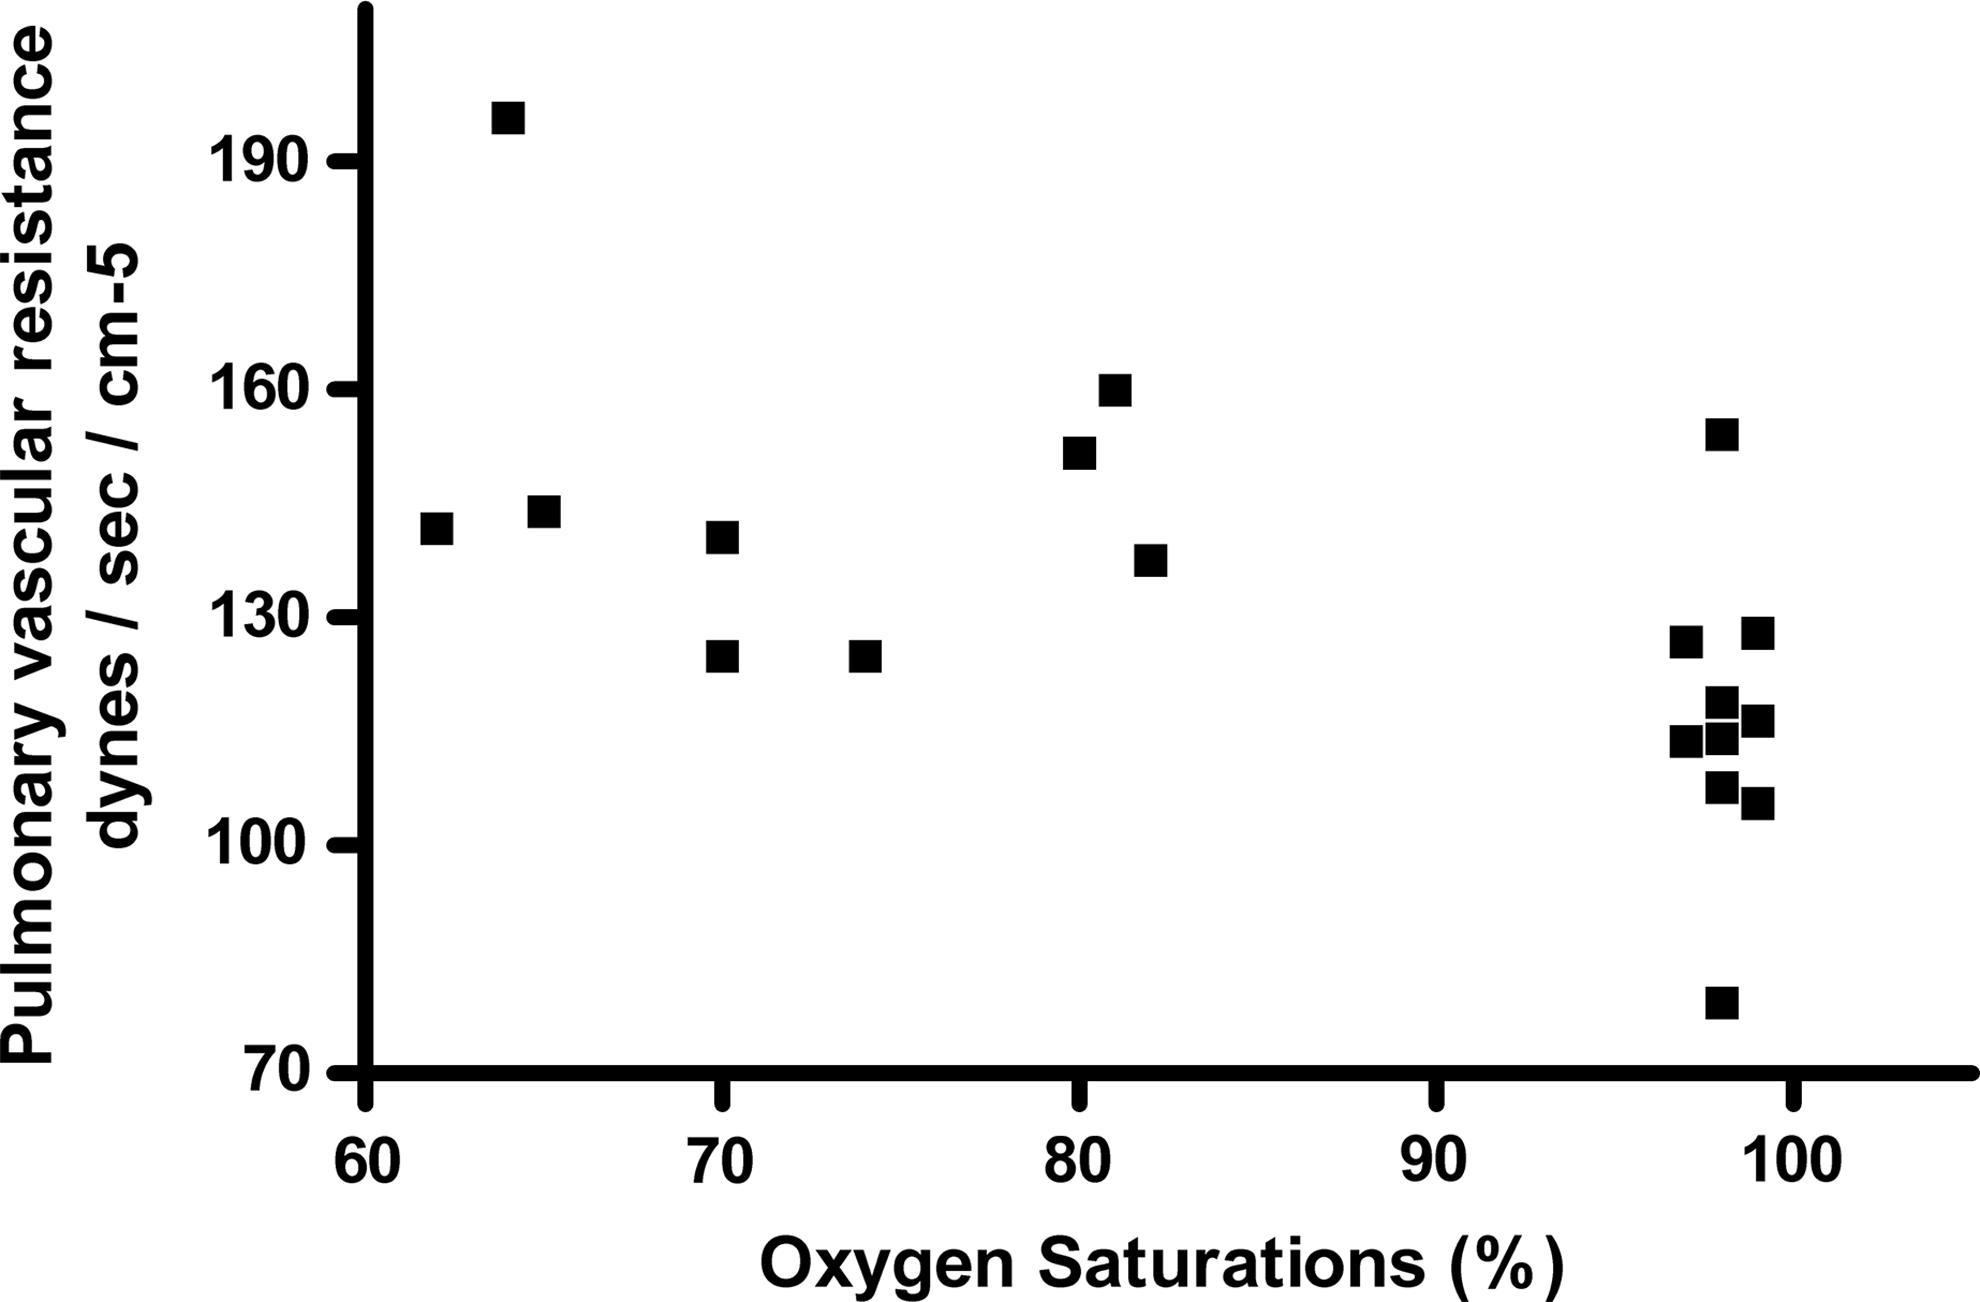
Relationship (correlation) between oxygen saturations and pulmonary vascular resistance index following acute hypobaric hypoxia.
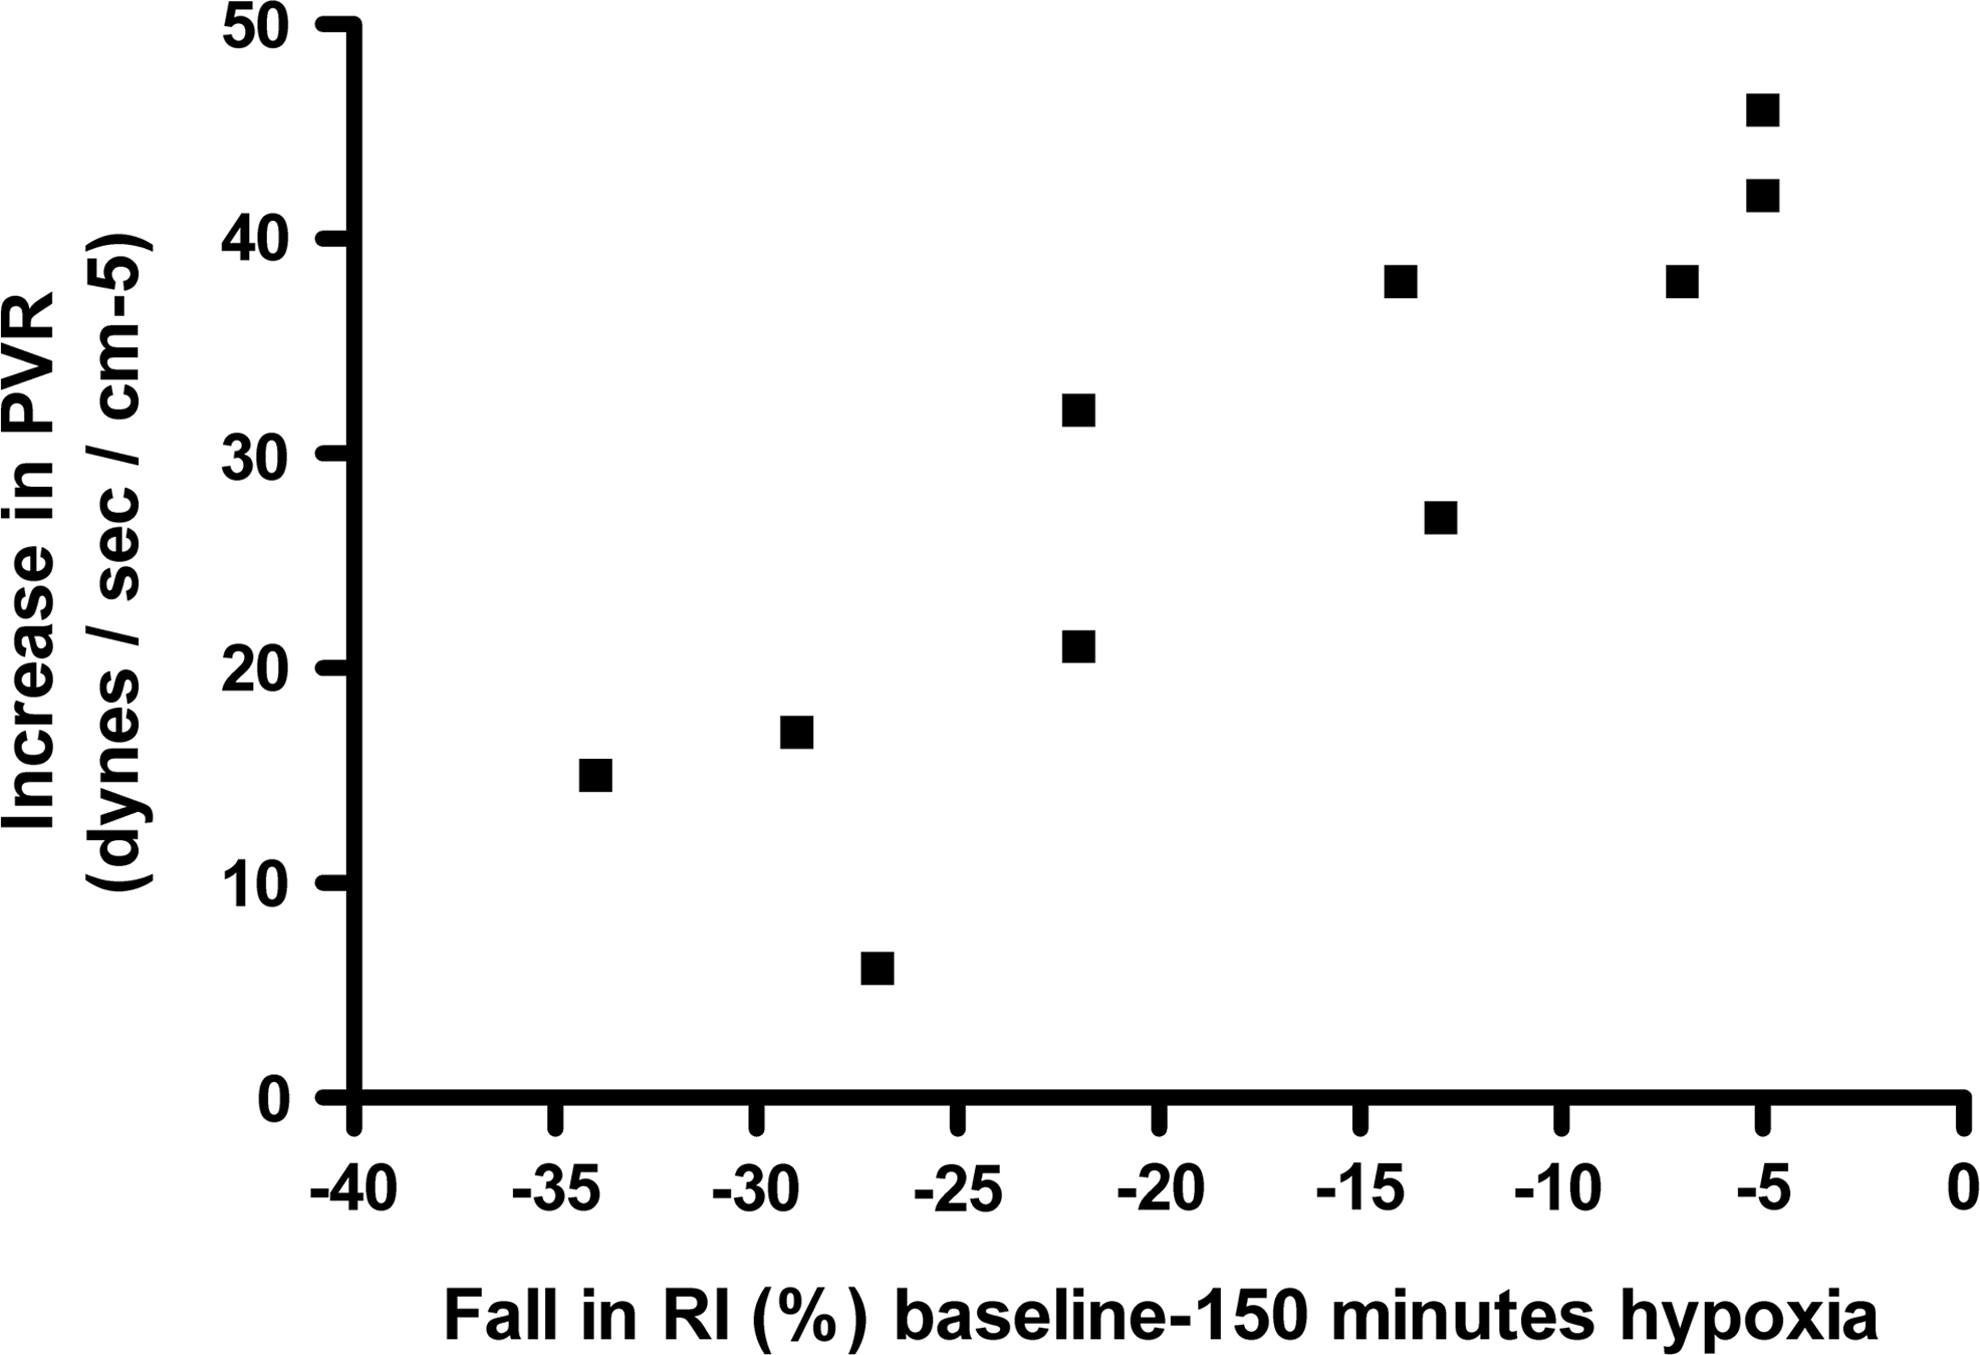
Relationship (correlation) between reducing fall in RI and pulmonary vascular resistance index.
Discussion
This is the first study to assess the effects of acute hypoxia on simultaneous assessment of large artery stiffness and endothelial function and its inter-relationship to LV diastolic function and PASP. Our results have shown that acute hypobaric hypoxia led to systemic vasodilatation of the smaller and intermediate sized muscular arteries, demonstrated by a fall in SVR, blood pressure and RI, without a change in large artery stiffness (SI). The only observed significant changes in diastolic indices were an increase in mitral valve inflow A velocity and an associated reduction in the E/A ratio without any changes in tissue doppler derived indices of left ventricular filling or in the estimated LV filling pressure (E/e’).
The moderate inverse correlation between ΔRI (marker of endothelial derived vasodilatation and function) and ΔPASP and the strong correlation between PA vascular resistance are novel findings in a healthy human acute HH study. Blitzer et al had previously shown that acute hypoxia (n=8; to oxygen saturations=84%) led to reciprocal changes in endothelial function (using arterial haemodynamic changes) and PASP, however the authors did not directly examine their correlation (Blitzer et al.1996). Berger et al. demonstrated an inverse correlation between endothelial function (flow mediated vasodilatation) and PASP among HAPE susceptible individuals (n=9) but not among healthy controls (n=9), following acute hypoxic exposure (to SpO2 75%) (Berger et al., 2005). In their study arterial stiffness, SVR and LV diastolic function were not assessed. Whilst the noted fall in SpO2 was accompanied by an increase in PASP their direct correlation was not reported (Berger et al. 2005). In the current study we observed a significant inverse correlation between arterial SpO2 and both PASP and PVR further validating the central role of hypoxia and its severity in influencing PA vascular responses. More recently, Jayet el al demonstrated a strong reciprocal relationship between flow-mediated dilation and PASP in the offspring of mothers with preeclampsia and living at high altitude (Jayet et al., 2010).
In our study changes in PASP and PVR led to a reciprocal impact on systemic vascular tone and endothelial function without overtly affecting arterial stiffness or diastolic function. Our data showed that the subjects who exhibited the lowest fall in RI, and thus a more blunted vasodilatory response to hypoxia, suggestive of worsening endothelial function, developed the greatest increase in PASP and estimated PVR resistance. Furthermore, this process was influenced by the severity of hypoxia and reducing SpO2 and may relate to reduced availability of endothelial-derived nitric oxide with worsening hypoxia. It has been previously shown that endothelium-derived nitric oxide contributes to systemic vasodilation and serves as a regulatory mechanism to attenuate pulmonary vasoconstriction during acute hypoxia in healthy humans (Blitzer et al., 1996). The results of the current study may have further clinical applications given the increasingly recognised relationship between worsening vascular endothelial function and susceptibility to HAPE (Scherrer., 2010; Berger et al., 2005). However, it must be emphasized that our study did not include known HAPE susceptible subjects.
There have been an increasing number of studies that have shown that even short-term exposure to hypoxia is associated with new abnormalities in diastolic function that were not present prior to the hypoxic stimulus (Boussuges et al., 2000; Huez et al., 2005; Kjaergaard et al., 2006; Holloway et al., 2011). However, these changes were generally very mild and noted mainly on pulsed wave mitral inflow only with a reduction in E velocity and an increase in A velocity and were not associated with an increase in estimated LV pressure or overt diastolic dysfunction. This led to the concept of compensated diastolic (dys)function in which minor alterations in mitral inflow as compensated for by enhanced atrial contraction (Alleman et al., 2004; Bernheim et al., 2007). This finding has been supported by the results of our present study. The mechanism for these minor changes are unknown and might relate to direct effects of hypoxia, upstream effects of pulmonary arterial vasoconstriction and possibly to changes in arterial stiffness. Increasing large artery stiffness increase afterload pressure on the LV and to hypertrophy which subsequently affects cardiac relaxation (Erdogan et al., 2007; Chung et al 2010).
The few studies that have assessed the relationship between hypoxia and large artery stiffness have reported inconsistent results. Thompson et al. (n=8) noted a significant fall in arterial stiffness, using augmentation index (−10.1±1.1%) and SVR without changes in blood pressure during 60 minutes of isocapnoeic normobaric hypoxia (Thomson et al., 2006). In their study the duration of hypoxia was much shorter (one hour), and the average peripheral SpO2 during hypoxia was much higher than in our study (82.6% vs. 71.8%). In another more recent study, Vedam et al. (n=12) noted that acute normobaric hypoxia (20 minutes; to an SpO2 of 80%) initially increased augmentation index and large artery stiffness with an associated rise in mean arterial pressure (Vedam et al., 2009). However, during hypoxic recovery there was actually a fall in augmentation index to a lower than baseline value. There were no observed changes in the heart rate adjusted time to pulse wave reflection suggesting that the hypoxia most likely led to changes in the muscular small arteries rather than centrally in the aorta (Vedam et al., 2009). This is supported by our current data. In a very recently published field study (n=17) to 4770 m, Rhodes et al. failed to demonstrate a consistent change in arterial SI with high altitude exposure, but did observe an initial significant fall in RI, as in our study. However, as with all of the above studies assessment of diastolic function and PAP were not performed (Rhodes et al., 2011).
Our data appears to suggest that hypoxia leads to differential haemodynamic effects along the arterial tree. This would partly explain the variable changes in reported blood pressure (increase, no change or even decrease) following acute hypoxia documented in previous studies (Blitzer et al., 1996; Johnson et al., 2002; Thomson et al., 2006; Naeje., 2010). However, the indices of blood pressure in acute hypoxia studies have been variably reported (e.g., only, MAP, or only systolic blood pressure and generally not pulse pressure). Blitzer et al. demonstrated a small decrease in MAP following acute hypoxic challenge in healthy controls (Blitzer et al., 1996). A similar finding was observed by Johnson et al. who noted a fall in MAP and an associated reduction in SVR (Johnson et al., 2001). In our study hypoxia led to a significant reduction in systolic blood pressure, mean arterial, pulse pressure and RI, reflecting the degree of systemic vasodilatation, yet increased pulmonary vasoconstriction, with an increase in cardiac output. These physiological changes would allow for greater blood supply to systemic organs in order to meet the metabolic demands of hypoxic tissues (Blitzer et al., 1996). It must be appreciated the mode (e.g., isopcapnoeic vs poililokapnoeic) and duration (minutes versus hours) of hypoxia and the sympathetic and ventilatory reponses will all influence the haemodynamic responses and in part explains the variation in the reported data (Naeje., 2010).
This study has several limitations which should be acknowledged. The sample size of the current study was relatively small. Nevertheless, our intervention sample size was larger than many of the previously reported acute hypoxia studies (Blitzer et al; Thomson et al., 2006) and our study was adequately powered for its principle aims. Moreover, the duration (3 hours) and severity of hypoxia was much greater than the two previously previous simulated HA arterial stiffness studies (Thomson et al., 2006; Vedam et al., 2009) with the added advantage that we used hypobaric hypoxia, compared with normobaric hypoxia. The PVR and MAP readings are estimated values derived from validation studies using echocardiography and cardiac catheterization (Abbas et al., 2003). The inclusion of a control group of patients, studied in the chamber over similar time duration, but without actual hypoxic exposure, would have been preferable. However, SI and left LV filling did not significantly change with hypoxia further validating our findings. A larger more detailed study of diastolic function with acute hypoxia is needed.
Conclusions
Acute hypobaric hypoxia does not significantly alter large artery stiffness or LV diastolic function. However, the degree of hypoxia influences both the systemic endothelial and pulmonary vascular responses. This noted association is intriguing and data from further studies investigating simultaneous pulmonary and systemic vascular responses would be helpful.
Footnotes
Acknowledgments
The authors would like to thank the Drummond Foundation for their support and the staff of the Centre of Aviation Medicine at RAF Henlow. The authors would also like to thank Dan Bradley at GE Healthcare® and Carefusion®.
Disclosures
The authors have no conflicts of interest or financial ties to disclose.