
Abstract
Abstract
Torres-Peralta, Rafael, José Losa-Reyna, Miriam González-Izal, Ismael Perez-Suarez, Jaime Calle-Herrero, Mikel Izquierdo, and José A.L. Calbet. Muscle activation during exercise in severe acute hypoxia: Role of absolute and relative intensity. High Alt Med Biol 15:472–482, 2014.—The aim of this study was to determine the influence of severe acute hypoxia on muscle activation during whole body dynamic exercise. Eleven young men performed four incremental cycle ergometer tests to exhaustion breathing normoxic (FI
Introduction
M
A clear decrement of median power frequency (MPF) is observed during repeated high-intensity dynamic muscle contractions when power output is also declining due to fatigue (Tesch et al., 1990; Izquierdo et al., 2011). However, MPF increases (vastus lateralis) or remains at the same level (vastus medialis) during 5 sec knee extension isometric contractions going from 10% to 90% of the MVC interspaced with 2 min recovery periods (Pincivero et al., 2001). During repeated dynamic muscle contractions at high intensities, a decline in MPF reflects muscle fatigue (Amann et al., 2006), particularly if power output is declining (Tesch et al. 1990; Izquierdo et al., 2011), while an elevated MPF (or MF) may be indicative of fatigue during prolonged exercise at a fixed power output when the intensity of exercise is low or moderate (Sarre and Lepers, 2005). Nevertheless, a reduction in MPF has been also reported during prolonged exercise to exhaustion (Hausswirth et al., 2000).
At a given absolute intensity, dynamic exercise is perceived as harder during exercise in severe hypoxia (i.e., FI
Part of the discrepancies between studies could be due to the different muscles and/or different muscle type of actions (i.e., isometric vs. dynamic), evaluated in each study, since it has been recently shown that muscle activation patterns during incremental exercise in normoxia show marked intra and between-muscle heterogeneity (Hug et al., 2004), as reflected by the tissue water spin-spin transverse relaxation time (T2) from 1H magnetic resonance imaging combined with local measures of exercise 31P chemical shift imaging (Cannon et al., 2013). It remains unknown if EMG amplitude or MPF are affected by changes in the relative intensity of exercise due to differences in oxygenation during dynamic muscle actions.
Therefore, the aim of this study was to determine the influence of severe acute hypoxia on thigh muscle activation, assessed with surface EMG, during dynamic exercise. We hypothesized that muscle activation would be higher during exercise in acute hypoxia with a muscle-specific pattern. Since severe hypoxia may reduce central motor output (Millet et al., 2012), we hypothesized also that at the same relative intensity muscle activation would be lower in severe hypoxia. To reduce EMG variability, two incremental exercise tests in normoxia were averaged and compared with the averages of two incremental exercise tests in severe hypoxia.
Methods
Subjects
Eleven physically active and healthy men [mean±SD: 21.2±2 years old, 71.7±9 kg body weight, 173.6±8 cm height, 16±5% body fat, 52.4±5 mL.kg−1.min−1 maximal oxygen consumption (V
General procedures
On the first visit to the laboratory, the body composition was determined by dual-energy x-ray absorptiometry (Hologic QDR-1500, Hologic Corp., software version 7.10, Waltham, MA) as described elsewhere (Calbet et al., 1998). Thereafter, subjects reported to the laboratory to become familiar with maximal exercise tests in normoxia and normobaric hypoxia (Altitrainer 200, SMTEC, Switzerland) on separate days. An average of 10 days later, subjects reported to the laboratory on 2 different test days, at least 1 week apart. In each test day, two sets of incremental cycle ergometer (Lode Excalibur Sport 925900, Groningen, The Netherlands) exercise tests to exhaustion, interspaced by a 90 min rest period, one in normoxia (inspired oxygen pressure, PI
Electromyography
Electrical muscle activation was monitored by means of surface electromyography (EMG). EMG signals were continuously recorded from four muscles of the left lower limb: rectus femoris (RF), vastus medialis (VM), vastus lateralis (VL), and biceps femoris (BF). Prior to the application of the EMG electrodes the skin surface was carefully shaved and wiped with alcohol to reduce skin impedance. Bipolar single differential electrodes were placed longitudinally on the muscles following the SENIAM recommendations (Merletti and Hermens, 2000) and taped to the skin to minimize movement artifacts. The reference electrode was placed on the skin over the acromion. The position of the electrodes was marked on the skin with indelible ink, and these references were used for precise electrode placement on repeated experiments. The EMG signals were acquired using a 16-channel recording system (Myomonitor IV, Delsys Inc., Boston, MA) at a sampling rate of 1000 Hz using rectangular-shaped (19.8 mm wide and 35 mm long) bipolar surface electrodes with 1 x 10 mm 99.9% Ag conductors, and an inter-conductor distance of 10 mm (DE-2.3 Delsys Inc.) and filtered with a high pass filter of 20 Hz and low pass filter of 450 Hz. The system has an input impedance of>1015Ω // 0.2pF, a common mode rejection ratio of>80 dB, signal-to-noise ratio<1.2 μV, and a pre-amplifier gain 1000 V/V±1%. Each pedal revolution was detected by using an electrogoniometer (Goniometer Biosignal Sensor S700 Joint Angle Shape Sensor; Delsys Inc.) fixed on the left knee and sampled at 500 Hz. EMG; joint movement were simultaneously recorded by a portable device (Myomonitor IV, Delsys Inc.) and wireless transmitted to a computer (EMGWorks Wireless application and EMGWorks Acquisition 3.7.1.3; Delsys, Inc.).
EMG recordings were later analyzed using a custom-made application (Matlab R2012b, MathWorks, Natick, MA). The EMG signals were full wave rectified and RMS calculated using a 25 ms rolling window. Burst onset and offset detection was determined using as a reference 20% of the maximal RMS activity of each burst (Baum and Li, 2003; Hug and Dorel, 2009), rather than using a mean threshold value from 15 consecutive bursts (Ozgunen et al., 2010). This approach yielded the same result as direct simple visual discrimination, with 100% detection of all bursts in the four muscles. The RMS recorded during the last min of a 2 min 80 W load (in normoxia) was used to normalize the rest of the RMS data. In addition, we calculated a total activity index per minute (TAI) defined as TAI=RMS x burst duration (ms) x pedaling rate (rpm), which is similar to the integrated EMG signal, but computing separately each burst and excluding the baseline EMG between burst. The TAI recorded during the last min of a 2 min 80 W load (in normoxia) was used to normalize the rest of the TAI values.
Mean (MF) and median (MPF) power spectrum frequencies were calculated using Fast Fourier Transform (FFT) (Solomonow et al., 1990). All variables were reported as the mean values of the pedal strokes recorded during the last minute of each load, or the fraction completed in the case of the last load.
Methodological considerations
Disagreements between previous studies could have been caused by the intrinsic variability of EMG recordings (Taylor and Bronks, 1995; Hug et al., 2004). For example, integrated EMG (iEMG) increases with increasing angular velocity during concentric contractions (Westing et al., 1991; Amiridis et al., 1996). Several normalization procedures have been used to reduce EMG variability. Normalization is achieved by comparing the root mean square (RMS) signal recorded during a given experimental condition to a reference RMS signal recorded during standardized reproducible conditions. This approach allows the comparison of RMS across muscles, time, and subjects (Albertus-Kajee et al., 2010). The most applied normalization method is achieved by dividing the RMS recorded during dynamic or static contractions by that obtained during a maximal voluntary contraction (MVC) under static conditions (isometric contraction) (Marsh and Martin, 1995; Hug and Dorel, 2009). This method of normalization is appropriate for static conditions, especially if performed at muscle length and joints angles close to those used in the reference contraction. However, this approach is less specific and less reproducible when the RMS obtained during an MVC is used to normalize dynamic contractions. An alternative procedure is to use RMS obtained during a reference dynamic condition as the normalizing value (Westing et al., 1991; Taylor and Bronks, 1995; Amiridis et al., 1996). Variability could be also reduced averaging some experiments performed under similar conditions, as usually done in O2 kinetics studies (Jones et al., 2012). However, this latter approach has not been applied in EMG research.
Statistical analysis
A Students t-test was used to determine if there was a test order effect between the two tests performed in similar conditions. Since there were no significant test order effects, or differences between the tests performed in the same conditions, the two normoxic exercise tests were averaged and the two hypoxic tests, as well. Thus, only one set of data was left to represent each condition (normoxia and hypoxia). Exercise tests were compared using a two-way ANOVA for repeated measures followed by pairwise comparisons with the Student's t-test adjusted for multiple comparisons with the Bonferroni-Holm correction. The impact of pedaling rate on burst duration was assessed with ANCOVA for repeated measures using pedaling rate as a covariate. P≤0.05 was considered significant. Analysis was performed using a commercially available software package (SPSS version 15.0, SPSS, Inc., Chicago, IL). Data are reported as means±standard deviation (SD), unless otherwise stated.
Results
Similar results were obtained in the two test performed in hypoxia (184±23 and 182±23 W, respectively, p=0.72) and normoxia (284±30 and 278±34 W, respectively, p=0.34). However, the tests in normoxia were slightly longer than in hypoxia (850±109 and 747±84 sec, p<0.05). No significant differences were observed in the V
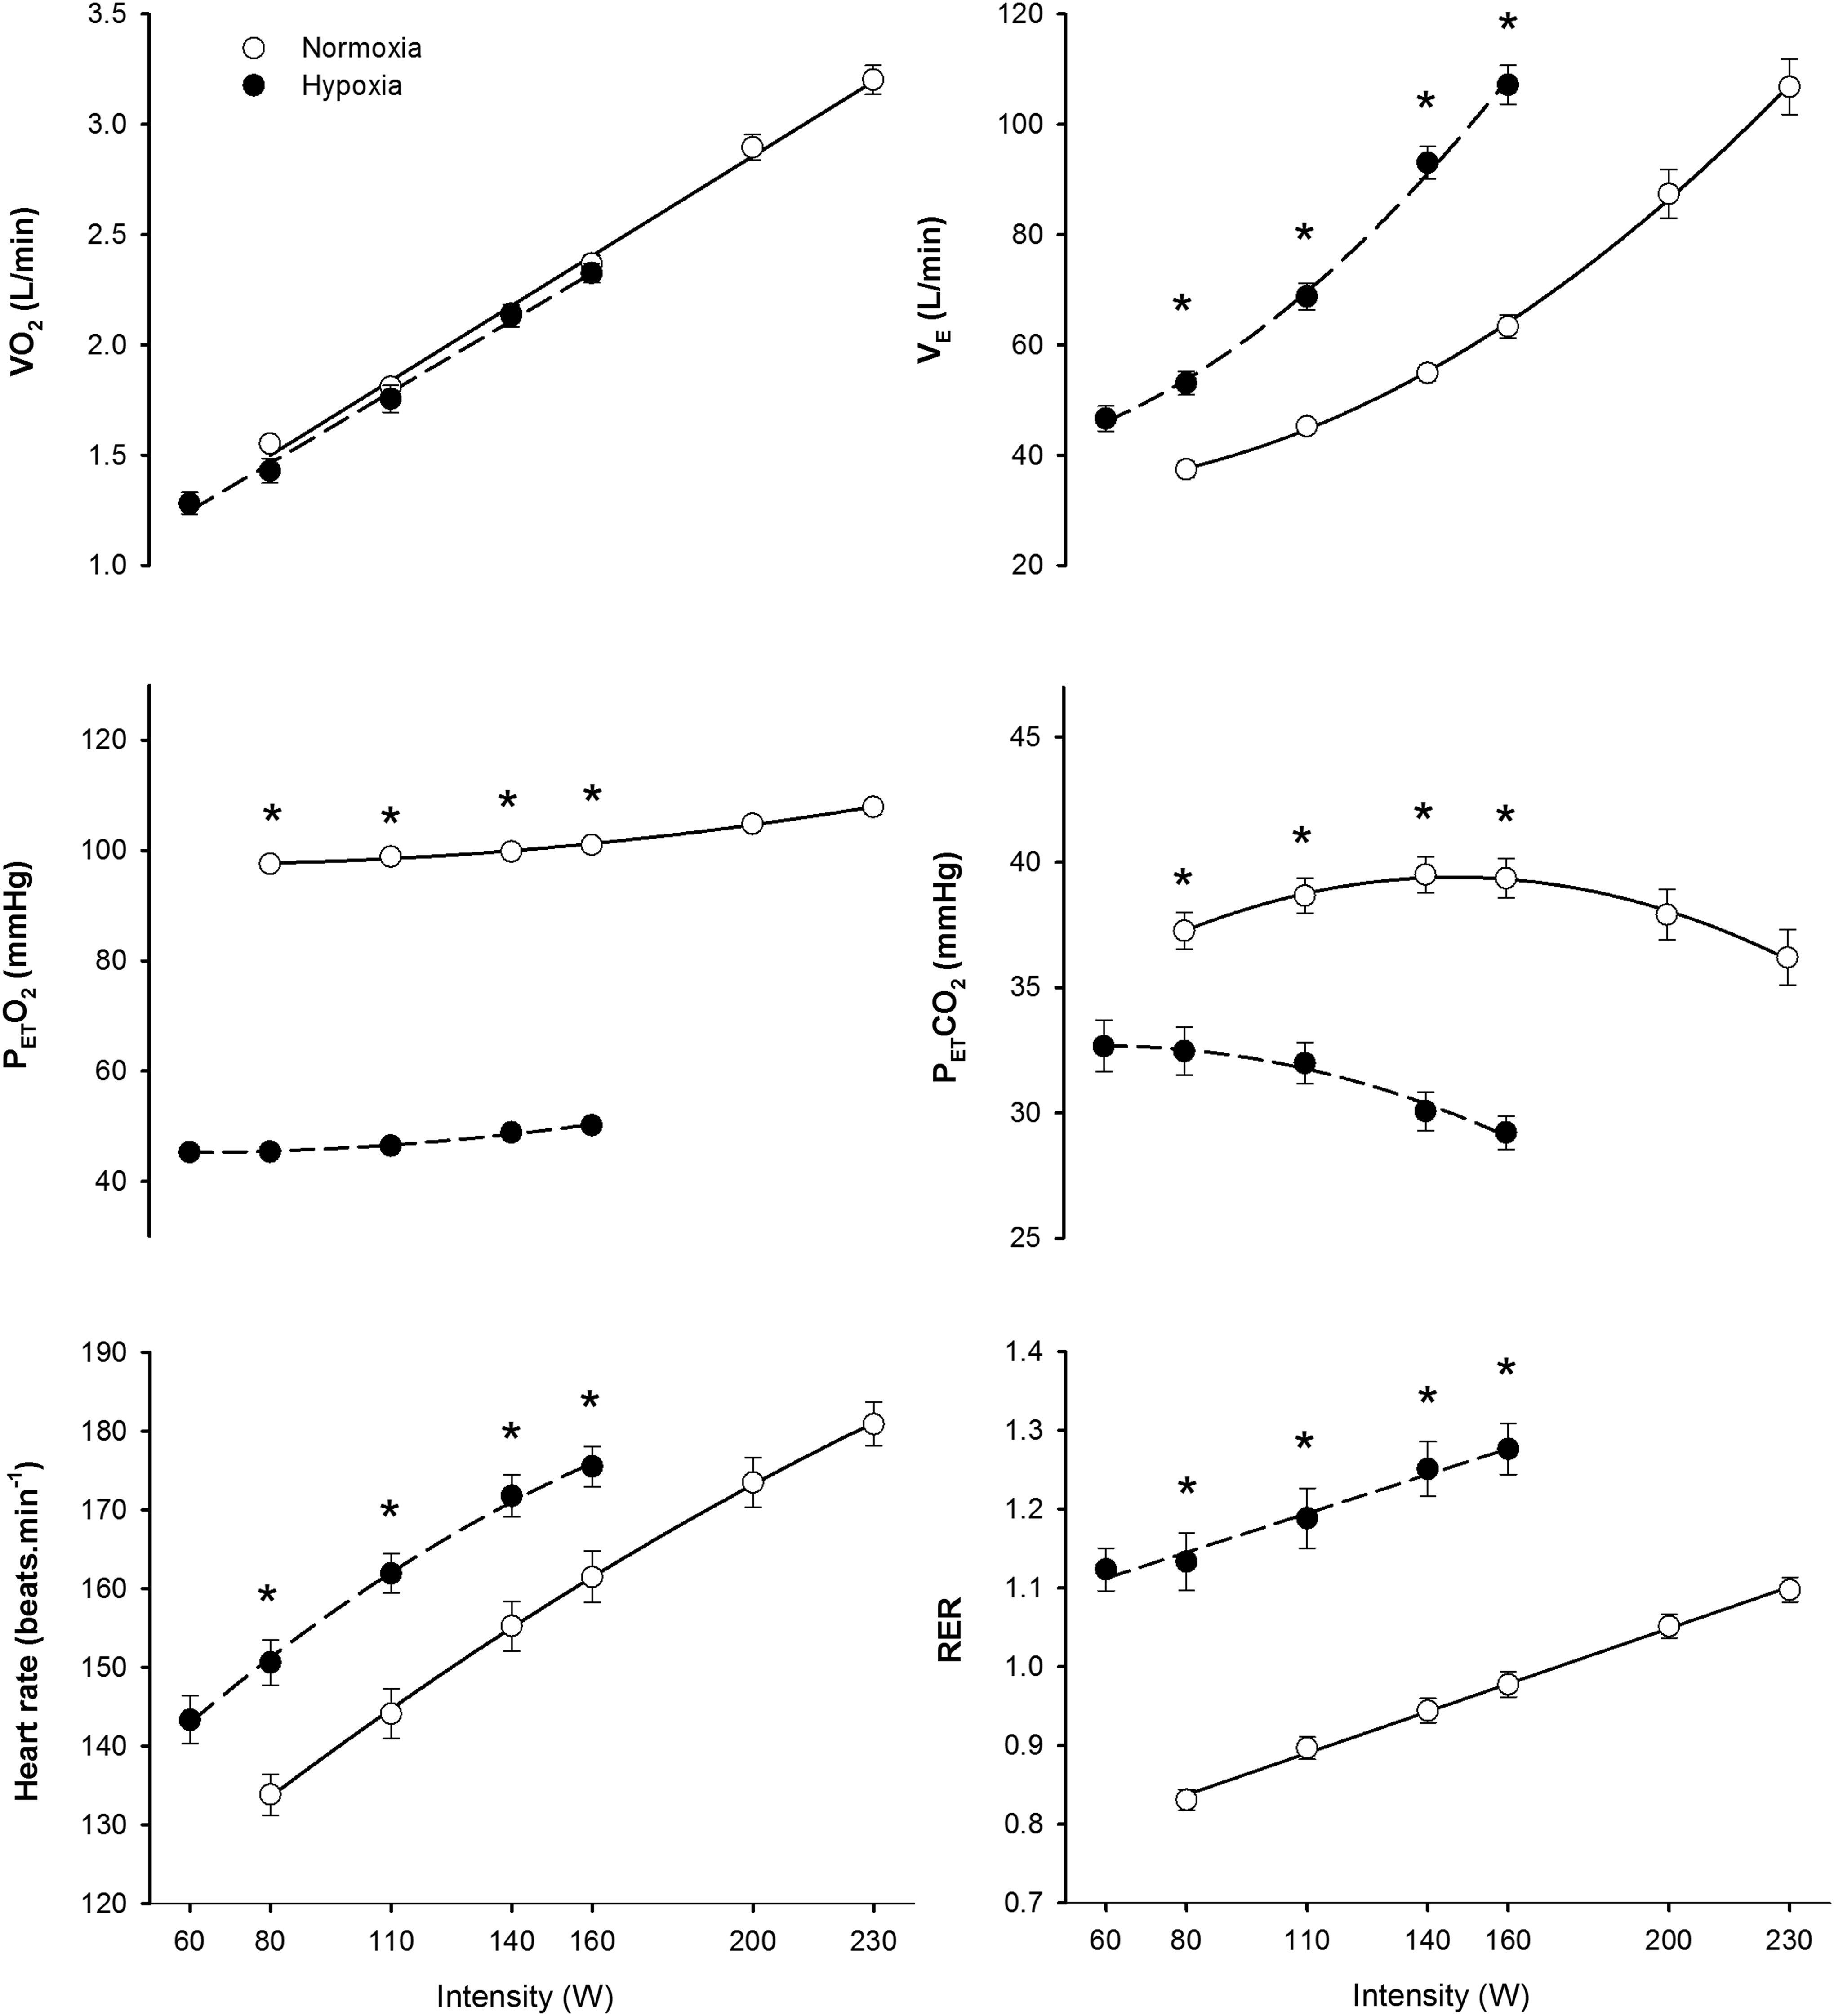
Ergospirometric variables during incremental exercise to exhaustion in normoxia (FI
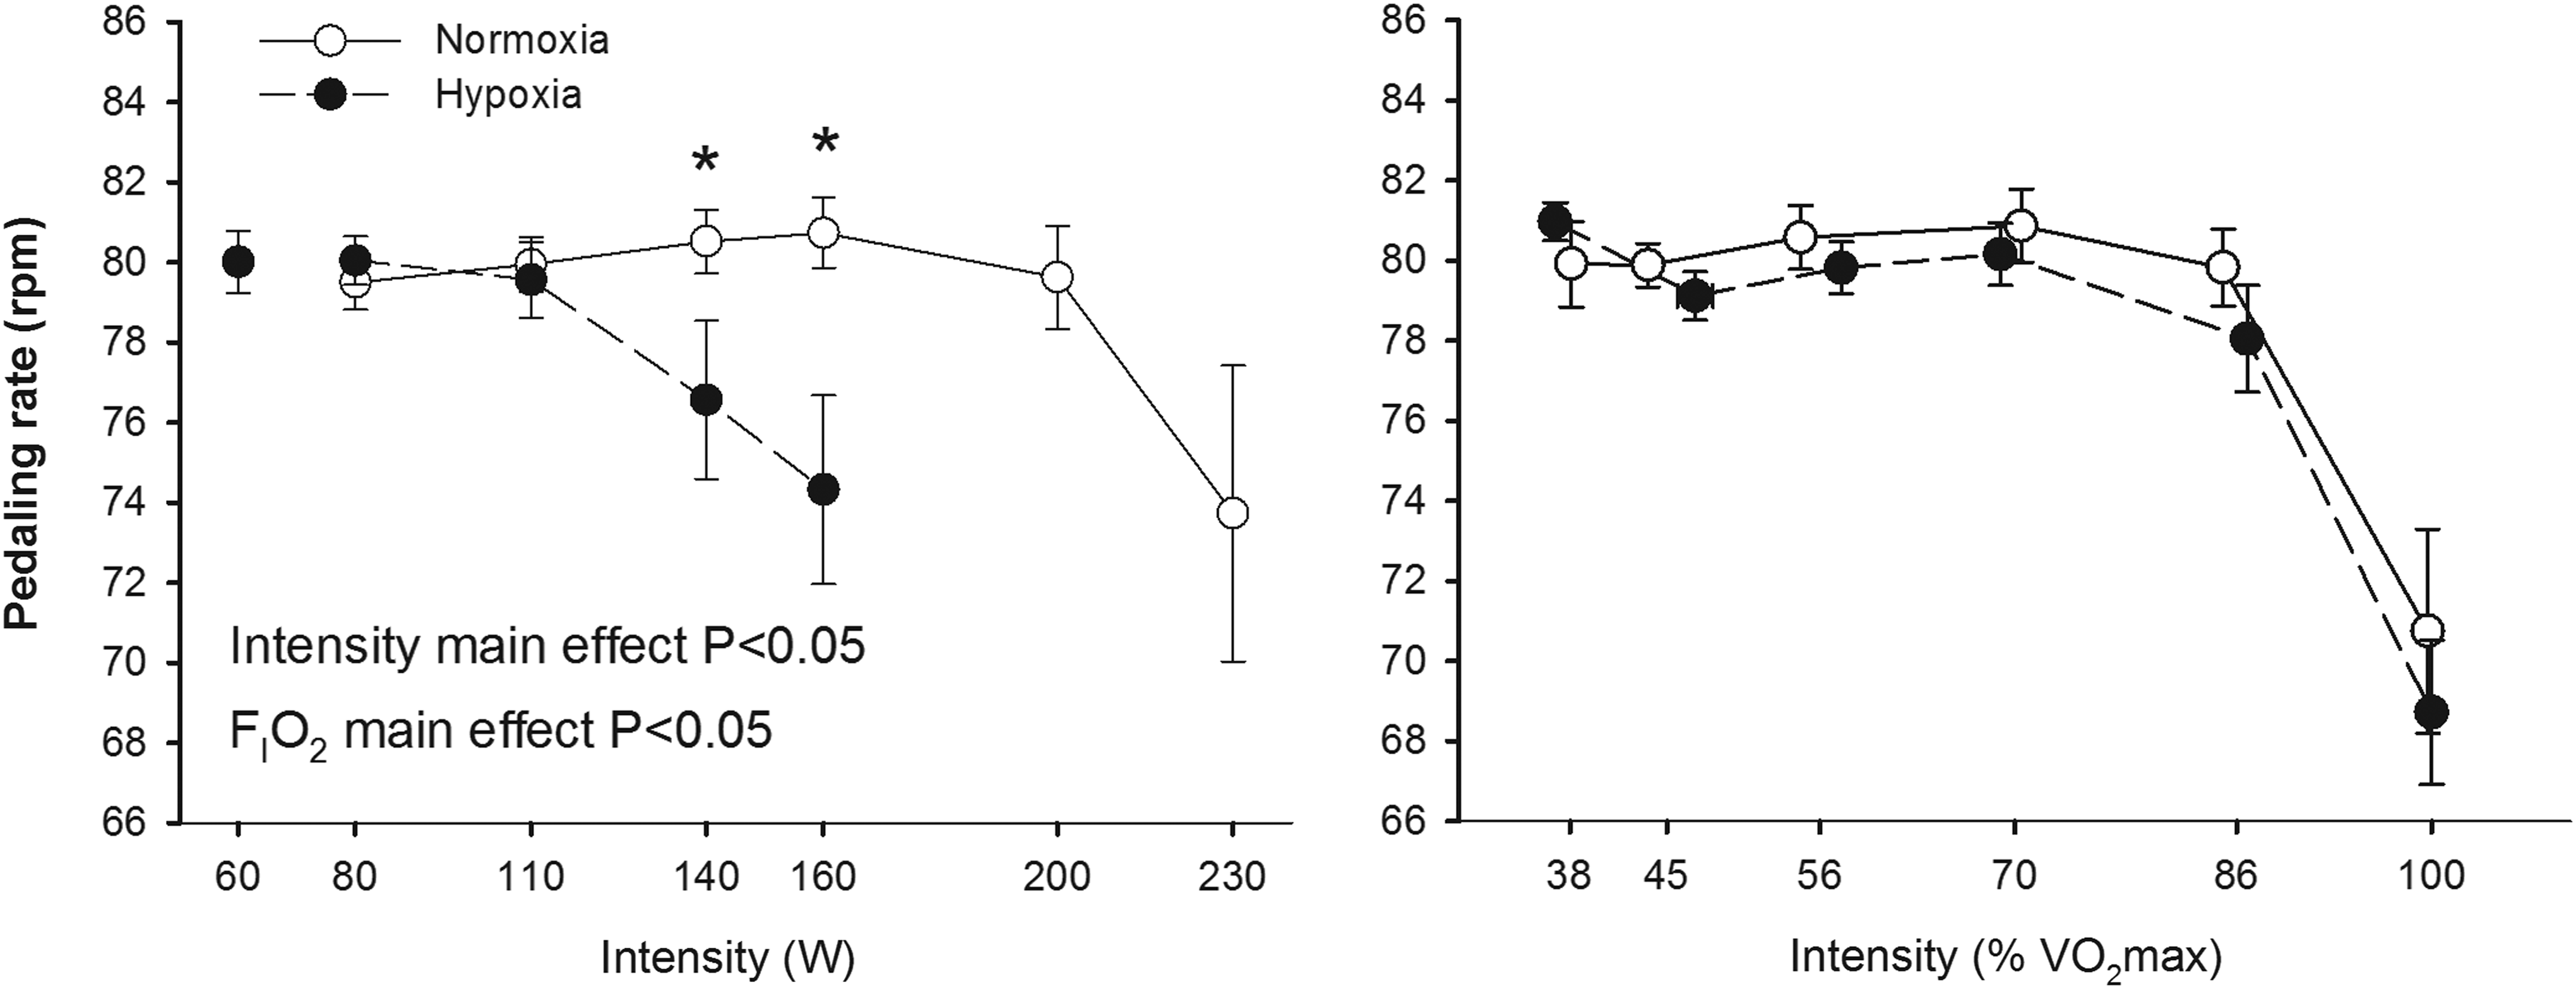
Pedaling rate during incremental exercise to exhaustion in normoxia (FI
The RMS and TAIm increased with exercise intensity in all the examined muscles; this effect being more accentuated in the RF than in the other muscles (p<0.05) (Figs. 3 and 4). The rate of increase of RMS and TAIm with absolute exercise intensity was greater in hypoxia than in normoxia in the RF and VM (interaction intensity x FI
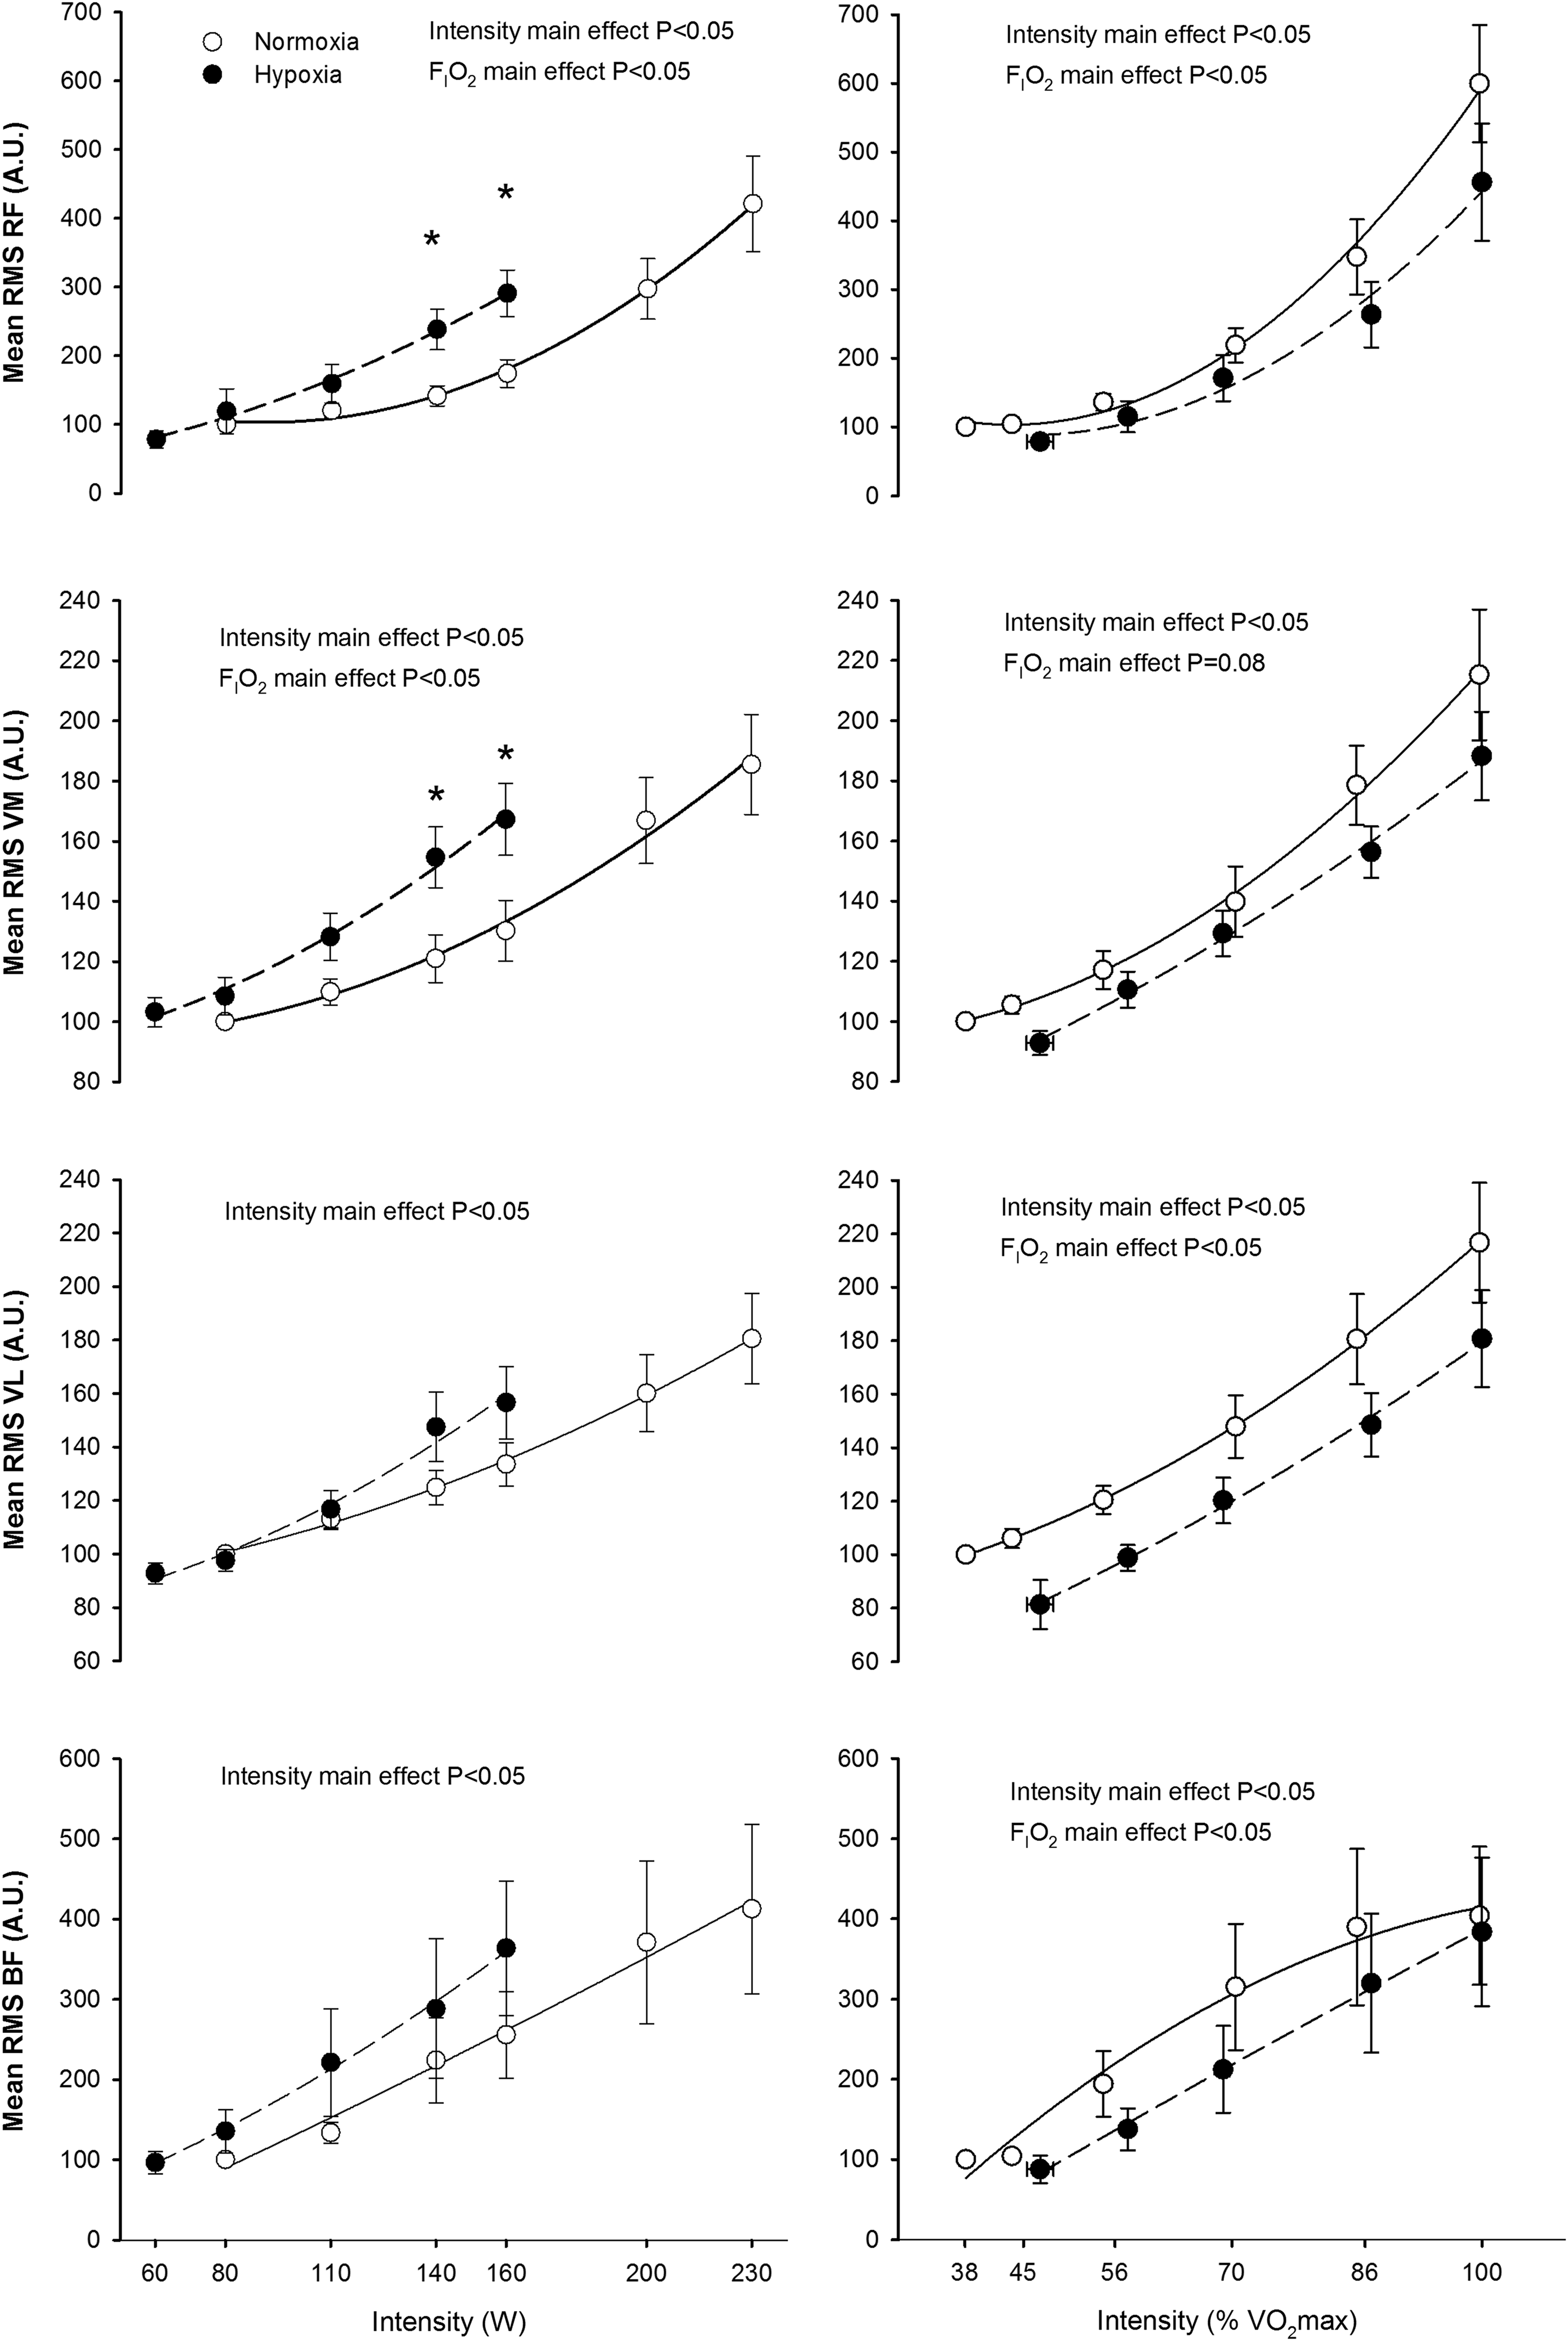
Root mean square (RMS) during incremental exercise to exhaustion in normoxia (FI

Total activation index per minute (TAI) during incremental exercise to exhaustion in normoxia (FI
At the same absolute intensity, median frequency in VL was higher in hypoxia, while no significant effects of FI
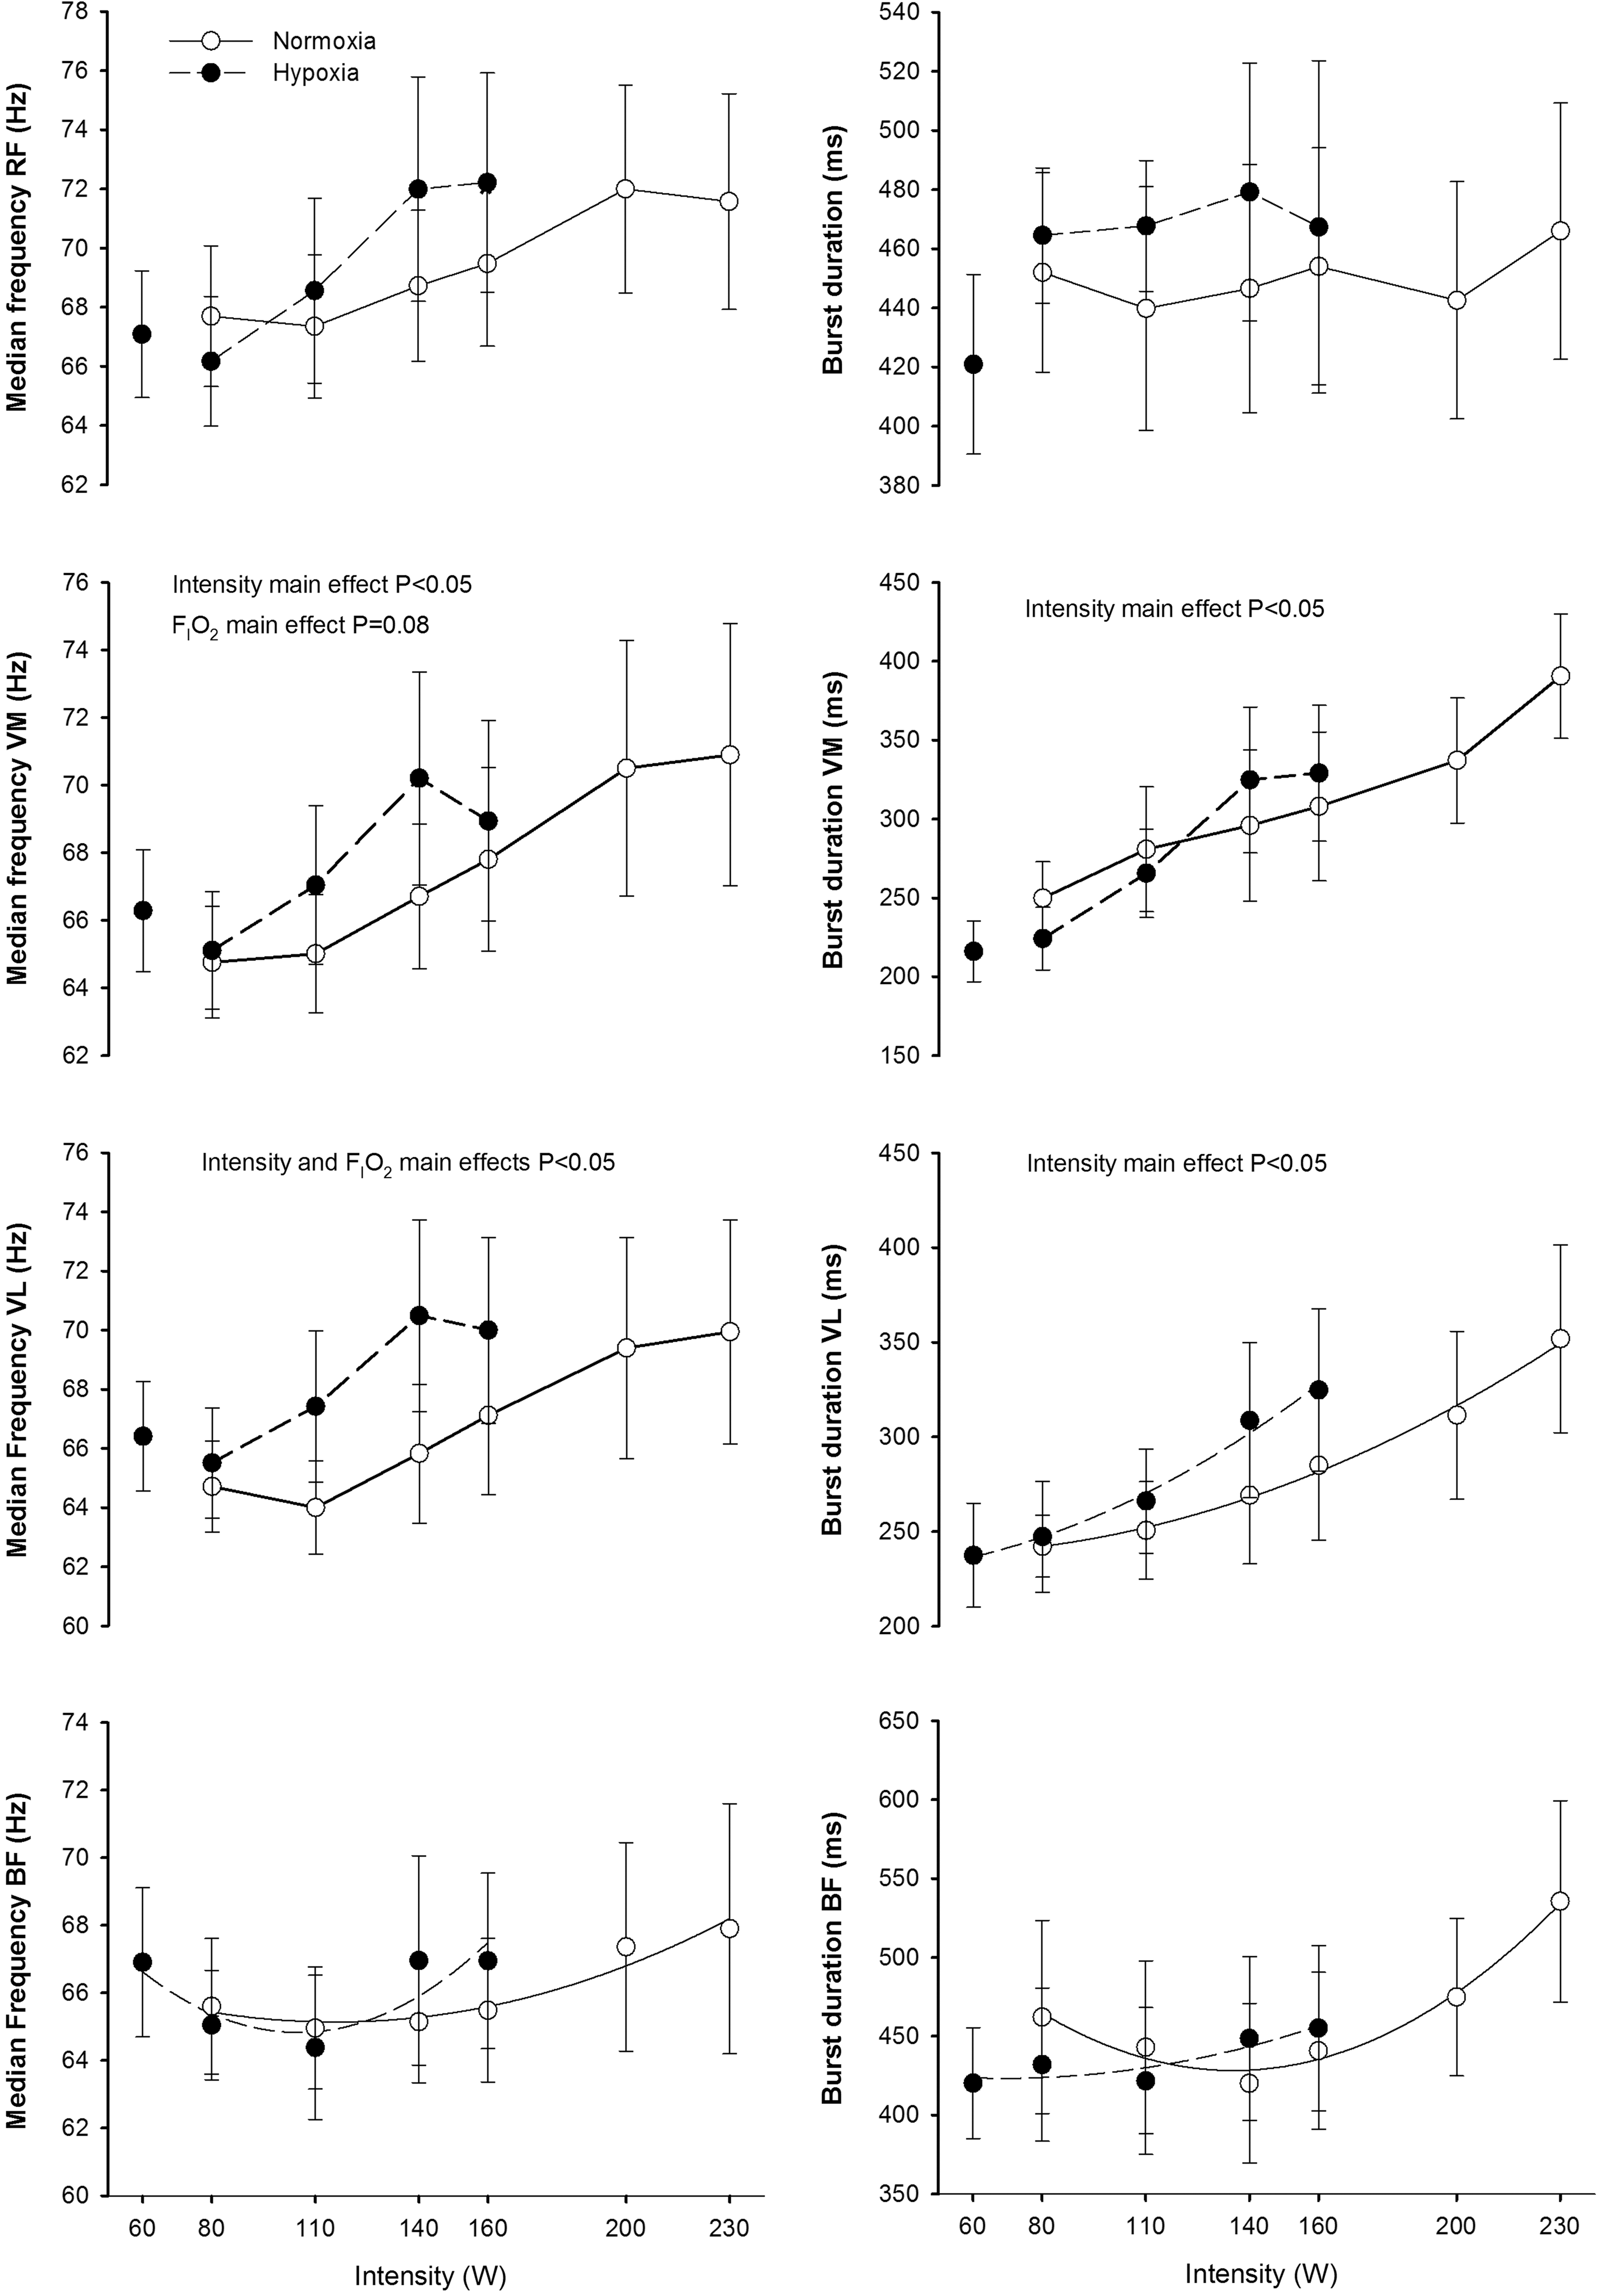
Median power frequency and burst duration during incremental exercise to exhaustion in normoxia (FI
Discussion
Although the exercise protocols were slightly different, this study shows that exercise muscle activation increases almost linearly with exercise intensity, and is modulated by the inspired O2 fraction. We have also shown that FI
This muscle specificity may originate from changes in the neural activation pattern caused by the effect of FI
In agreement with our results, increased quadriceps muscle iEMG was observed during dynamic knee extension exercise at 21 W in hypobaric hypoxia (barometric pressure: 464 mmHg) compared to normoxic exercise (Fulco et al., 1996). Likewise, increased mean VL iEMG during cycling in hypoxia at FI
In contrast with our results, Taylor and Bronks (1996) observed similar iEMG responses in RF, VM, and VL at the same absolute intensities in normoxia and moderate hypoxia (FI
The increased EMG amplitude during submaximal exercise at a given absolute intensity in hypoxia may reflect increased motor unit recruitment to compensate for fatigue of active muscle units (Moritani et al., 1992). In fact, using wire electrodes, Moritani et al. (1992) showed both increases in amplitude and firing frequency of individual motor units with fatigue. Motor unit recruitment strategies can be indirectly assessed by determining the MPF of the power spectral analysis of the EMG (Solomonow et al., 1990; Sbriccoli et al., 2003). The fact that the pattern of muscle activation was altered by hypoxia is clearly demonstrated by the reduced pedaling rate at 140 and 160 W in hypoxia (Fig. 2). The influence of pedaling cadence on EMG activity is controversial, but in general it seems that EMG activity increases with pedaling rate with a muscle-specific pattern. EMG activity has been reported to increase with cadence in VL (Marsh and Martin, 1995; Bieuzen et al., 2007), VM (Neptune et al., 1997), BF (Neptune et al., 1997), RF (Marsh and Martin, 1995; Sarre et al., 2003), and medial gastrocnemius (Neptune et al., 1997), whereas no changes in EMG with cadence has been also reported for VM (Sarre et al., 2003), VL (Sarre et al., 2003), RF (Neptune et al., 1997; Bieuzen et al., 2007), and BF (Marsh and Martin, 1995; Bieuzen et al., 2007). At a given absolute exercise intensity, the relative intensity increases with cadences above 60 rpm (Chavarren and Calbet, 1999), implying that part of the increase in EMG amplitude with cadence is likely due to the increase in relative intensity. Despite the slightly lower cadence during exercise in hypoxia at 140 and 160 W, EMG activity was higher in hypoxia than in normoxia. Furthermore, pedaling rate declined similarly in normoxia and hypoxia at exercise intensities above 86% of V
Supraspinal fatigue has been defined as an exercise-induced decline in force caused by suboptimal output from the motor cortex (Gandevia, 2001). Reduced brain oxygenation may cause central fatigue during exercise, particularly in severe acute hypoxia (Goodall et al., 2010; Millet et al., 2012) leading to the corticospinal inhibition of motor drive. Interestingly, hypoxia has, if any, a small effect on muscle metabolism and exercise capacity when the muscle mass recruited is small (Roach et al., 1999; Calbet et al., 2009) or the impairment in exercise capacity is only observed in severe hypoxia (Goodall et al., 2010). Moreover, during exercise with a small muscle mass in severe acute hypoxia, pulmonary gas exchange is less perturbed and consequently, brain oxygenation is less altered than during exercise with a large muscle mass (Amann and Calbet, 2008; Calbet and Lundby, 2009; Calbet et al., 2009). The energy charge of the cell is less reduced during submaximal cycling at the same relative intensity in hypoxia (FI
In summary, muscle activation during whole body exercise increases almost linearly with exercise intensity, following a muscle-specific pattern, which is modulated depending on FI
Footnotes
Acknowledgments
Special thanks are given to José Navarro de Tuero for his excellent technical assistance. Thanks are also expressed to Lorena Rodríguez-García and Jesus Gustavo Ponce González who helped occasionally during the execution of the experiments.
Author Disclosure Statement
The authors have no conflict of interest to disclose. This study was supported by a grant from the Ministerio de Educación y Ciencia of Spain (DEP2009-11638 and FEDER).