
Abstract
Abstract
Morales-Artacho, Antonio J., Paulino Padial, Dario Rodríguez-Matoso, David Rodríguez-Ruiz, Amador García-Ramos, Juan Manuel García-Manso, Carmen Calderón, and Belén Feriche. Assessment of muscle contractile properties at acute moderate altitude through tensiomyography. High Alt Biol Med 16:343–349, 2015.—Under hypoxia, alterations in muscle contractile properties and faster fatigue development have been reported. This study investigated the efficacy of tensiomyography (TMG) in assessing muscle contractile function at acute moderate altitude. Biceps femoris (BF) and vastus lateralis (VL) muscles of 18 athletes (age 20.1 ± 6.1 years; body mass 65.4 ± 13.9 kg; height 174.6 ± 9.5 cm) were assessed at sea level and moderate altitude using electrically evoked contractions on two consecutive days. Maximum radial displacement (Dm), time of contraction (Tc), reaction time (Td), sustained contraction time (Ts), and relaxation time (Tr) were recorded at 40, 60, 80, and 100 mA. At altitude, VL showed lower Dm values at 40 mA (p = 0.008; ES = −0.237). Biceps femoris showed Dm decrements in all electrical stimulations (p < 0.001, ES > 0.61). In VL, Tc was longer at altitude at 40 (p = 0.031, ES = 0.56), and 100 mA (p = 0.03, ES = 0.51). Regarding Td, VL showed significant increases in all electrical intensities under hypoxia (p ≤ 0.03, ES ≥ 0.33). TMG appears effective at detecting slight changes in the muscle contractile properties at moderate altitude. Further research involving TMG along with other muscle function assessment methods is needed to provide additional insight into peripheral neuromuscular alterations at moderate altitude.
Introduction
T
Increased sympathetic nervous activity has been reported at high altitude (Seals et al., 1991; Ashenden et al., 1999; Katayama et al., 2011), although no changes in maximal isometric force generating capacity are generally described (Bowie and Cumming 1971; Orizio et al., 1994; Felici et al., 2001; Esposito et al., 2003; Casale et al., 2004). On the other hand, it has been described that normobaric hypoxia reduces peak power output and oxygen uptake during maximal whole body exercises to fatigue (Duhamel et al., 2004).
Furthermore, there seems to be agreement that hypoxia accelerates fatigue development during voluntary and electrically evoked resistive protocols (Felici et al., 2001; Degens et al., 2006; Katayama et al., 2007), although that is not always the case (Young et al., 1980; Szubski et al., 2007; Perrey and Rupp, 2009). Based on animal models (Ottenheijm et al., 2006; Degens et al., 2010), the mechanisms behind changes in muscular performance have been linked to alterations in muscle contractile properties. Human studies are limited and do not seem to support that hypothesis (Degens et al., 2006).
Inconsistent evidence comes from previous research looking at myoelectric activity (EMG) when examining contractile properties under hypoxic environments (Casale et al., 2004; Degens et al., 2006). For example, no changes in EMG signal were reported after maximum voluntary contractions (Garner et al., 1991), cycling efforts (Kayser et al., 1994; Taylor and Bronks, 1996) or electrically elicited contractions (Casale et al., 2004) when normoxic and hypoxic conditions were compared. On the contrary, other studies have reported changes in EMG variables associated to reduced oxygen availability during voluntary (Moritani et al., 1992; Felici et al., 2001; Goodall et al., 2012; Torres-Peralta et al., 2014) and/or electrically evoked contractions (Garner et al., 1991; Dousset et al., 2001a) and after 5-week low-load hypoxic resistance training (Manimmanakorn et al., 2013). The fact that all these investigations have been conducted at different altitude levels and hypoxic environments (real altitude vs. normobaric hypoxia) may account for these discrepancies.
Tensiomyography (TMG) represents an objective, noninvasive technique capable of measuring changes in muscle contractile properties (Valencic and Knez, 1997). TMG has been proposed as an effective tool at estimating muscle fiber composition and distribution (Dahmane et al., 2000; 2005; Simunic et al., 2011) and at evaluating neuromuscular fatigue (Garcia-Manso et al., 2012), muscle damage (Hunter et al., 2012), and structural muscle adaptations (Dahmane et al., 2006; Loturco et al., 2015). Basic TMG parameters such as muscle displacement (Dm), highly correlated to muscle tone and contractile force (Pisot et al., 2008), and time of contraction (Tc), representative of muscle histochemical properties (Simunic et al., 2011), may be altered under acute hypobaric hypoxia.
Gasparini et al., (2012) reported TMG parameters alterations in individuals with peripheral arterial disease who suffered from intermittent lower-limb claudication. The authors suggested that physiological and structural modifications in muscle function, as result of chronic limited oxygen availability, could be detected by TMG. Nonetheless, to the best of our knowledge, TMG technique has not previously been employed to evaluate the acute effects of hypobaric hypoxia on the muscle contractile properties of healthy trained athletes.
Accordingly, the objective of this study was to investigate the TMG muscle response to increasing percutaneous electrical stimulation intensities during an acute exposure to moderate altitude. It was thus hypothesized that TMG could detect the acute effects of moderate altitude on the muscle contractile characteristics.
Materials and Methods
Participants
Eighteen trained subjects (age 20.1 ± 6.1 years; weight 65.4 ± 13.9 kg; height 174.6 ± 9.5 cm) took part of the study. All participants were fully informed about the details of the experimental procedures and their associated risks and discomforts. Each subject signed informed consent form previously approved by the Granada University Research Ethics Committee in accordance with the criteria of the Helsinki Declaration for research involving human beings.
Study design
Contractile properties of biceps femoris (BF) and vastus lateralis (VL) of the dominant leg were assessed at sea level (11 m) and moderate altitude (2320 m) on two consecutive days by using a TMG device (TMG-BMC, Ljubljana, Slovenia). Four increasing electrical stimulation intensities were employed to assess muscle TMG responses. Dm, time from 10% to 90% of Dm (Tc), time from the onset of electrical stimulus to 10% of Dm (reaction time, Td), time between 50% of Dm on both sides of the curve (sustained contraction time, Ts), and time from 90% to 50% of Dm (relaxation time, Tr) were the dependent variables measured. The environmental condition constituted the independent variable including two levels: altitude (2320 m) and sea level (11 m).
Procedures
The TMG device detects radial muscle belly displacement through a displacement-measuring sensor (GK40, Panoptik, Ljubljana, Slovenia) whose characteristics have been previously described (Valencic and Knez, 1997; Dahmane et al., 2005). A single twitch electrical stimuli (1 ms duration) elicited muscle contraction through two self-adhesive electrodes (Compex Medical SA, Ecublens, Switzerland) placed symmetrically to the sensor 4 cm apart from midpoint (Dahmane et al., 2005). The measuring point for each muscle was anatomically established as the point of maximal muscle belly displacement detected by palpation during voluntary contraction (Dahmane et al., 2000; Garcia-Manso et al., 2012).
During VL measurements, participants were positioned supinely on a padded bench with a foam pad placed under the knee (knee angle set at 30° knee flexion). Measurements on BF were performed in a prone position on a padded bench with a foam pad placed above the ankle (knee angle set at 5° knee flexion). To avoid potential reproducibility issues (Tous-Fajardo et al., 2010), electrode and sensor positions were outlined on the skin surface with a permanent marker so that the same procedure was accurately reproduced on the following day. The inductive sensor was carefully placed perpendicular (90°) to the muscle belly displacement by using a bubble level and manual goniometer (Fig. 1).

Tensiomyography (TMG) set up with displacement sensor and electrodes placed above biceps femoris to deliver electrical stimulation. A bubble level and manual goniometer were employed to ensure perpendicular position of the inductive sensor.
On day one, sea level TMG measurements were recorded at different electrical stimulations (40, 60, 80, and 100 mA). Previous studies using TMG have reported maximal muscle belly response using electrical intensities between 40 and 100 mA (Hunter et al., 2012). There was a 2 min rest period between each measure of the same muscle to avoid potentiation and/or fatigue effects. The muscle responses measured were computer-analyzed to determine the above-described TMG parameters (Dm, Tc, Tr, Td, and Ts).
Force was not measured during testing, as previous research has shown minor force production during TMG assessments (Hunter et al., 2012). Reproducibility of TMG has previously been assessed across consecutive testing days (Simunic 2012). Likewise, long and short-term stability have been previously reported (Ditroilo et al., 2013; Krizaj et al., 2008). TMG reproducibility has also been tested previously at our laboratory (Rodríguez-Matoso et al., 2010).
Statistical analysis
Results are expressed as means ± standard deviations of the mean (SD). Frequency distributions were assessed using the Shapiro-Wilk test and Student t-test for paired data was employed in those variables normally distributed. The Wilcoxon signed-rank test was utilized to test differences when variables were not normally distributed. Significance was set at p ≤ 0.05. The magnitude of the differences between both conditions was expressed as a standardized mean difference (Cohen's d effect size; ES). The criteria to interpret the magnitude of the ES were as follows: <0.2 = trivial, 0.2–0.6 = small, 0.6–1.2 = moderate, 1.2–2.0 = large, and >2 = very large (Hopkins et al., 2009).
Results
At altitude, VL showed lower Dm values at 40 mA (4.6 ± 2.01 vs. 5.1 ± 2.1 mm; p = 0.008; ES = −0.237). No significant differences were found at higher electrical stimulations (p ≥ 0.05; ES < 0.019). Biceps femoris showed Dm decrements in all electrical stimulations under hypoxic conditions (p < 0.001, ES > 0.61) (Fig. 2).

Mean ± (SE) VL and BF maximal radial displacement values (Dm) at sea level and moderate altitude. **p < 0.0005; *p ≤ 0.01.
In VL, Tc was longer at altitude compared to sea level at 40 (27.93 ± 6.09 vs. 24.72 ± 5.31 ms; z = 2.15, p = 0.031, ES = 0.56) and 100 mA (25.22 ± 3.51 vs. 23.4 ± 3.71ms; p = 0.03, ES = 0.51). No statistical differences were found in Tc of BF between conditions (p > 0.05, ES > −0.19) (Fig. 3).
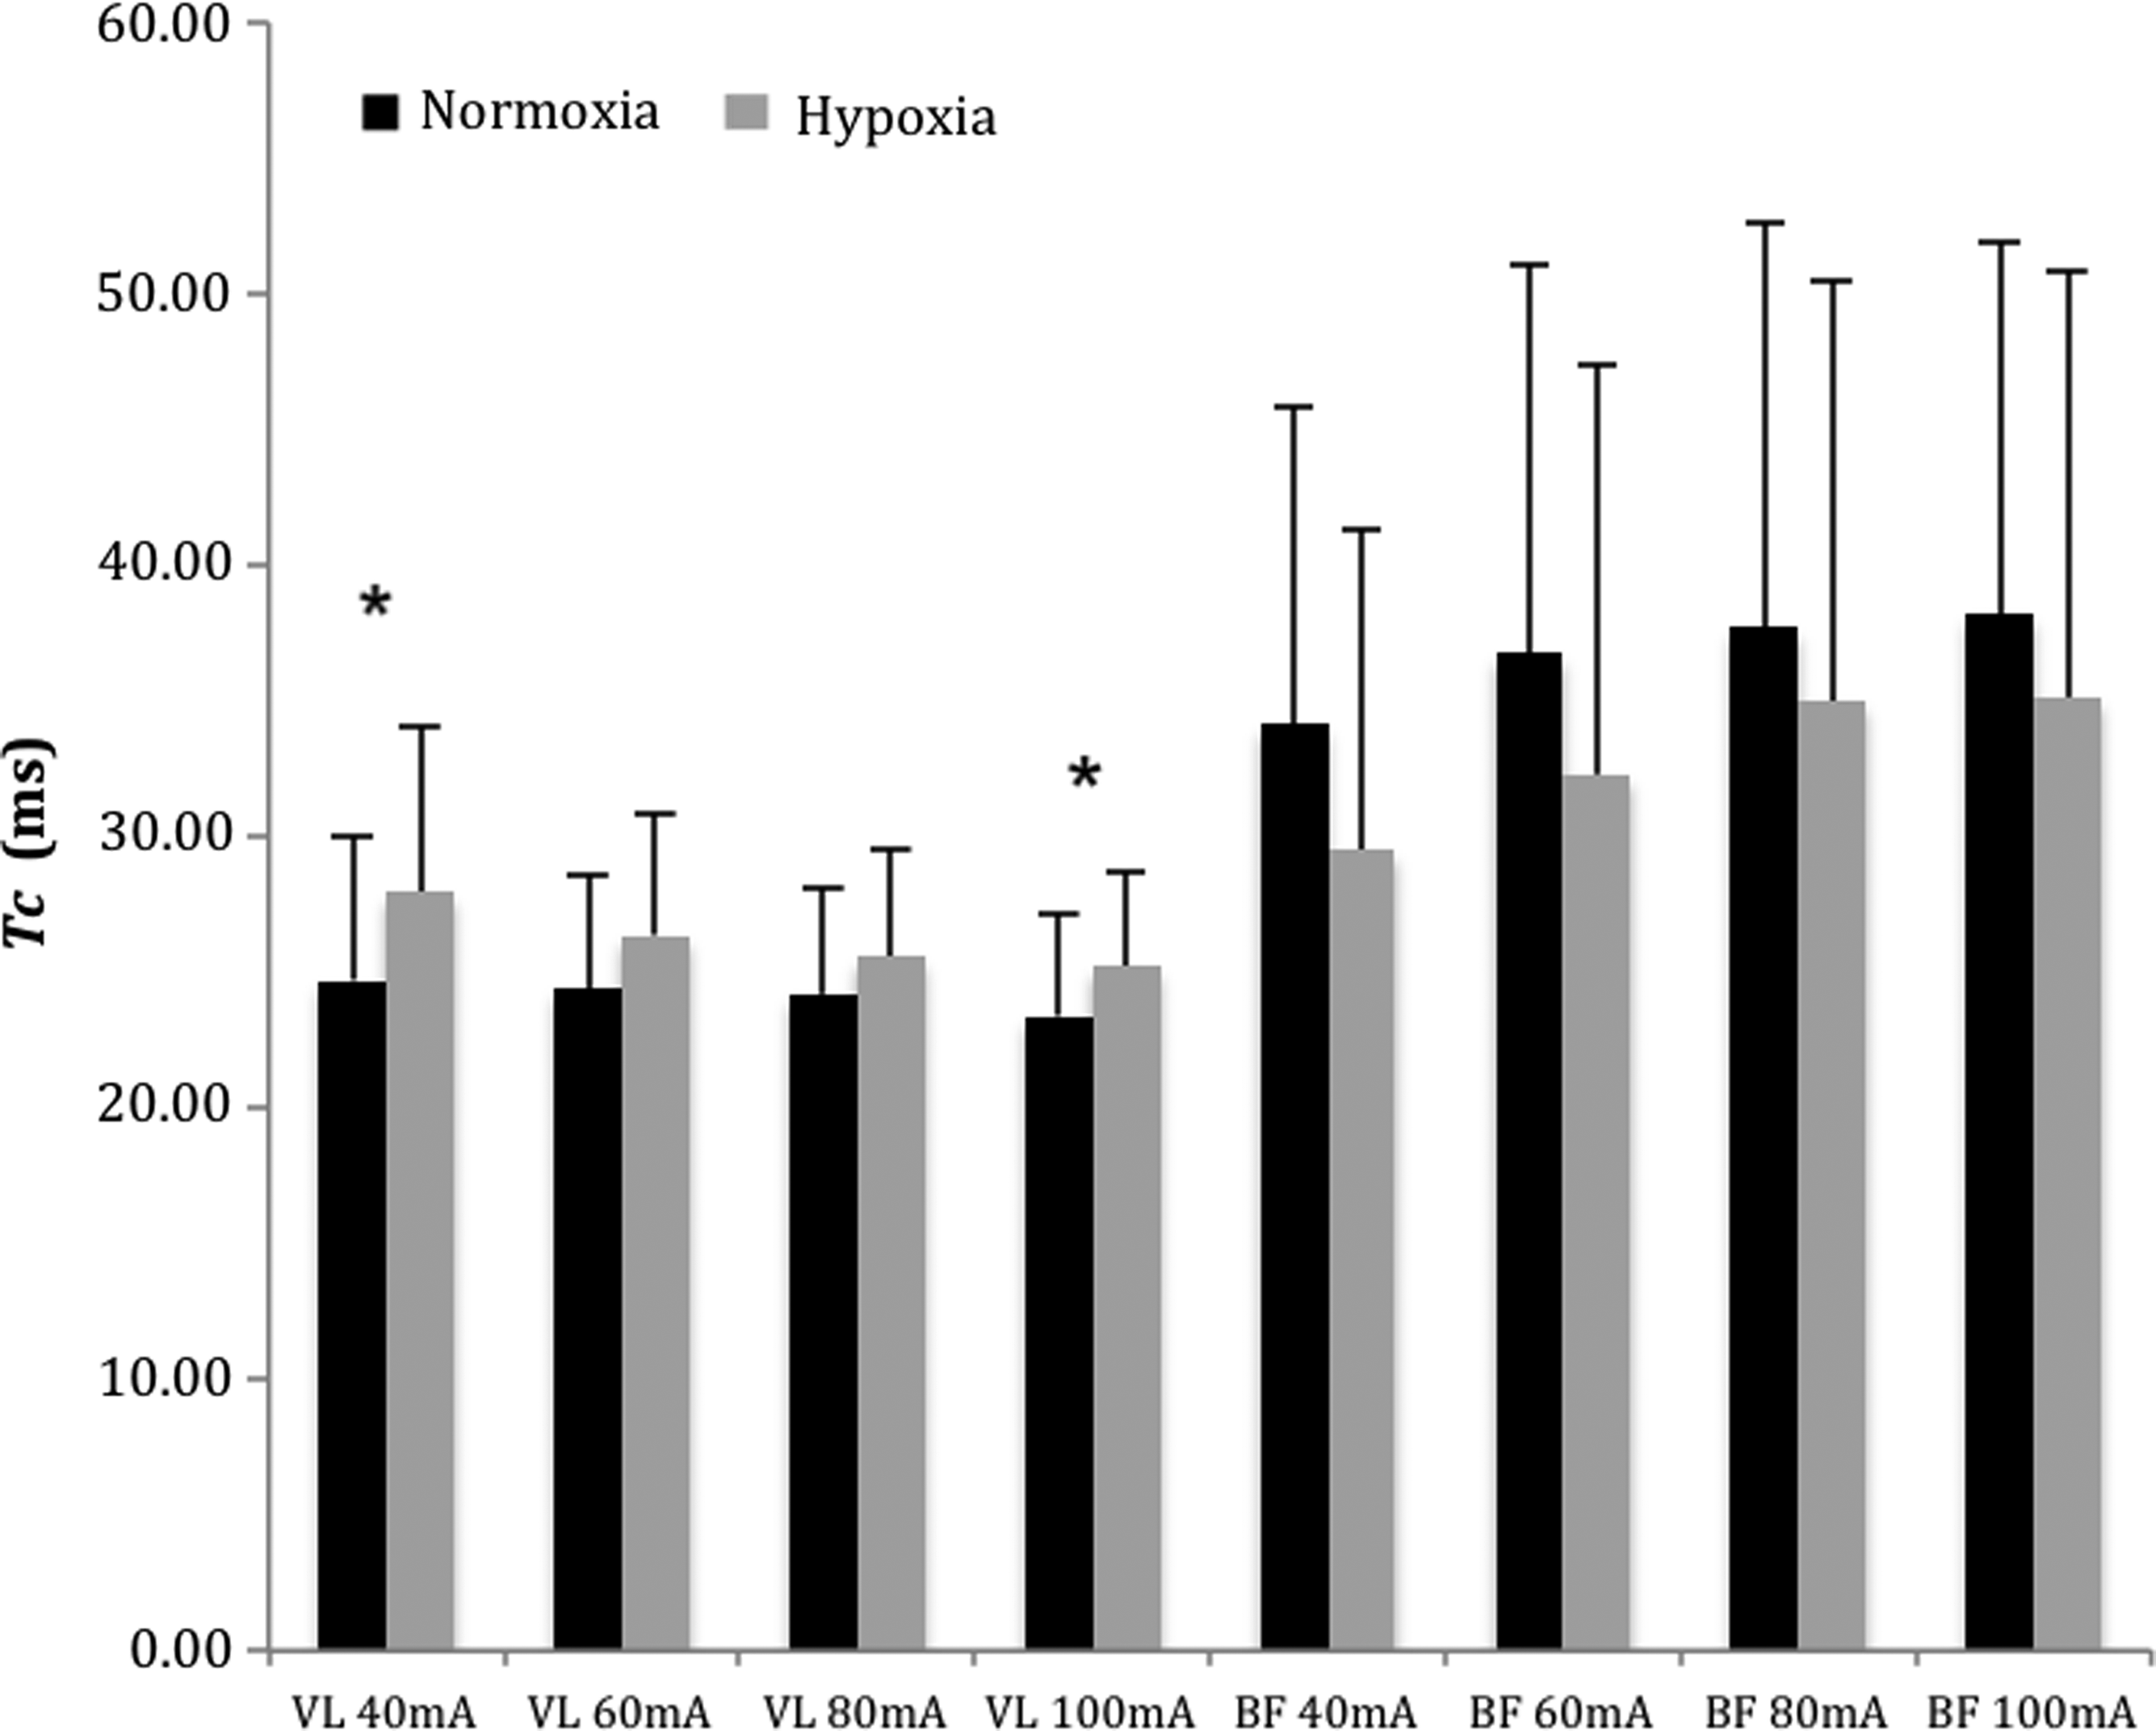
Time of contraction (Tc) behavior under normoxic and hypoxic conditions in vastus lateralis (VL) and biceps femoris (BF) stimulated at different intensities (mA). *p ≤ 0.05.
At altitude, VL showed higher Ts (at 40 and 100 mA) and Tr (at 80 and 100 mA) than under normoxic conditions. No significant differences were observed in BF for Ts and Tr (Table 1).
Values expressed as mean ± SE. H, hypoxia; N, normoxia.
BF, biceps femoris; Td, reaction time; Tr, relaxation time; Ts, sustained contraction time; VL, vastus lateralis.
Vastus lateralis revealed significant increments in Td at all electrical intensities under hypoxic conditions (p ≤ 0.03, ES ≥ 0.33). No significant differences were seen in BF Td (p > 0.05, ES = −0.52 in 40mA, ES ≤ −0.11 in 60, 80 and 100mA) (Table 1).
Discussion
The main outcome of this study is that slight changes in the muscle contractile properties of VM and BF were observed at acute hypobaric hypoxia through TMG. However, those changes do not appear to be consistent across the muscles assessed and electrical intensities employed. To the best of our knowledge, this is the first study to report acute effects of hypobaric hypoxia on muscle contractile properties through TMG technique.
Our results showed lower Dm values in BF at acute moderate altitudes, whereas higher Dm values were observed in VL at 40 mA. TMG appears to be sensitive in the detection of acute muscle damage and fatigue (Garcia-Manso et al., 2011; Hunter et al., 2012). While eccentric exercise-induced muscle damage increases muscle tone (lower Dm values) (Hunter et al., 2012), reductions in muscle stiffness (higher Dm) have been reported after an ultra-endurance event (Garcia-Manso et al., 2011). Given that our participants remained in resting conditions and the exposure to altitude was no longer than ≈5 h, acute changes in muscle tone may have occurred for reasons linked to the effect of altitude exposure on the neuromuscular system (Seals et al., 1991).
The implications of these changes on muscle performance are unknown, as no functional testing was performed. Nevertheless, the evidence supporting changes in muscle function at moderate altitude is limited (Perrey and Rupp, 2009). It should be taken into account that investigations are conducted at different altitude levels and hypoxic conditions (hypobaric vs. normobaric hypoxia), which may account for discrepancies. Our measurements were taken at moderate hypobaric altitude (< 3000 m) and in acute conditions (< 6 h of altitude exposure). At high altitude (> 4000 m), previous research has shown impairments in muscle force generating capacity during endurance force testing (Eiken and Tesch 1984; Degens et al., 2006; Katayama et al., 2007; Katayama et al., 2011). On the contrary, maximal force generating capacity seems to be maintained at high altitude (Garner et al., 1991; Casale et al., 2004; Degens et al., 2006) or even improved at real moderate altitude (Feriche et al., 2014).
Regarding Tr and Ts parameters, opposite responses between muscles were observed under hypoxic conditions. At altitude, lower Tr and Ts values were observed in BF, whereas higher Tr and Ts values were detected in VL (Table 1). These results are consistent with data obtained in animal studies, showing that hypoxia has greater impairment of cellular homeostasis in muscle composed of fibers with low oxidative capacity compared with those of a more oxidative profile (Howlett and Hogan, 2007; Degens et al., 2010). The shorter Ts observed at altitude in BF is also in agreement with previous research showing an improvement of the muscle response when electrically stimulated (Dousset et al., 2001b).
On the other hand, an increment in Ts values has been attributed to muscle fatigue development (Garcia-Manso et al., 2011; 2012), which is in line with previous studies showing faster fatigue development under hypoxia (Perrey and Rupp, 2009). The fact that higher Tc (Fig. 2) and Td (Table 1) values were also observed under hypoxic conditions further supports the idea of muscle fatigue symptoms on VL muscle. Increments in Tc have been attributed to muscle damage (Hunter et al., 2012) and fatigue symptoms after a long distance triathlon competition (Garcia-Manso et al., 2011).
A trend towards shorter Tc values was observed in BF, although it did not reach statistical significance. Previous research has reported shorter Tc values as a result of muscle training adaptations (Dahmane et al., 2006; García-García et al., 2013) and shift in the fiber type composition from type I to type II fibers due to chronic arterial hypoxemia (Gasparini et al., 2012).
These findings may be somewhat limited by several factors that should be taken into account. Hyperventilation during altitude exposure leads to respiratory alkalosis and increased respiratory loss of water (Faiss et al., 2013). Hydration status of participants during altitude exposure was not controlled, which could have affected skin conductivity and therefore electrical impulse propagation during assessments (Tous-Fajardo et al., 2010).
Furthermore, hamstring tightness could have increased during the trip to altitude from sea level (2 hours by bus), altering possibly the TMG response. Assessments were performed between 11.00 and 16.00 h, but comparisons in BF TMG parameters between morning and afternoon testing sessions did not reveal any differences (p > 0.05; data not shown). Nonetheless, sea level assessments were also preceded by a 1.5 h car trip, what may counterbalance this possible confounder factor. Additionally, it is important to bear in mind that arterial oxygen saturation levels were not measured and may differ between participants (Luks and Hopkings, 2014).
These results suggest that the acute exposure to moderate altitude induced little but varying changes on the muscle contractile properties of BF and VL assessed by TMG. In agreement with previous investigations using other neuromuscular assessment techniques (Perrey and Rupp, 2009), a tendency towards muscle fatigue symptoms on VL but the opposite behavior (potentiation) on BF was depicted. More research, along with other neuromuscular assessment techniques, is needed to effectively determine the efficacy of TMG as a valid tool to evaluate altitude-induced changes on muscle function.
Footnotes
Acknowledgments
The authors would like to thank the OlympicArt-Malaga Club, all athletes involved, and the High Performance Centre of Sierra Nevada (CSD) for making possible this investigation.
Author Disclosure Statement
The authors have no financial conflicts of interest to disclose. This study was supported by the Spanish Ministry of Science and Education (FPU13/04801).