
Abstract
Abstract
Casuso, Rafael A., Jerónimo Aragón-Vela, Gracia López-Contreras, Silvana N. Gomes, Cristina Casals, Yaira Barranco-Ruiz, Jordi J. Mercadé, and Jesus R. Huertas. Does swimming at a moderate altitude favor a lower oxidative stress in an intensity-dependent manner? Role of nonenzymatic antioxidants. High-Alt Med Biol. 18:46–55, 2017.—we aimed to describe oxidative damage and enzymatic and nonenzymatic antioxidant responses to swimming at different intensities in hypoxia. We recruited 12 highly experienced swimmers who have been involved in competitive swimming for at least 9 years. They performed a total of six swimming sessions carried out at low (LOW), moderate (MOD), or high (HIGH) intensity at low altitude (630 m) and at 2320 m above sea level. Blood samples were collected before the session (Pre), after the cool down (Post), and after 15 minutes of recovery (Rec). Blood lactate (BL) and heart rate were recorded throughout the main part of the session. Average velocities did not change between hypoxia and normoxia. We found a higher BL in response to MOD intensity in hypoxia. Plasmatic hydroperoxide level decreased at all intensities when swimming in hypoxia. This effect coincided with a lower glutation peroxidase activity and a marked mobilization of the circulating levels of α-tocopherol and coenzyme Q10 in an intensity-dependent manner. Our results suggest that, regardless of the intensity, no oxidative damage is found in response to hypoxic swimming in well-trained swimmers. Indeed, swimmers show a highly efficient antioxidant system by stimulating the mobilization of nonenzymatic antioxidants.
Introduction
H
In addition, an increase from low to high altitude induces a number of rapid responses mediated by an enhanced sympathetic drive, which in turn induces a higher heart rate (HR) and cardiac output (Talbot et al., 2005; Siebenmann and Lundby, 2015). The activation of the sympathetic nervous system also leads to an attenuation of whole muscle fatty acid oxidation within the mitochondria while glucose uptake is maintained to support glycolytic flux (Horscroft and Murray, 2014). Thereby, aerobic capacity of the athlete is compromised when exercising in a hypoxic environment (Lundby and Robach, 2015).
Due to the critical role of mitochondria in producing reactive oxygen species (ROS) in response to skeletal muscle contractions (Jackson, 2015), ROS production is increased while exercising in hypoxia (Quindry et al., 2016). The increased shuttles of ROS within the exercise muscle in hypoxia produce oxidative stress, which is exacerbated in an intensity-dependent manner (Quindry et al., 2016). To prevent oxidative damage of biological membranes, excessive ROS production is counteracted by a number of both enzymatic and nonenzymatic antioxidants (Powers et al., 2011).
In fact, untrained subjects increase their catalase (CAT) and superoxide dismutase (SOD) activity in response to an acute bout of hypoxic exercise (Debevec et al., 2014; Krzeszowiak et al., 2014). However, high training level increases the ability of skeletal muscle to rapidly detoxify ROS produced within the exercised muscle (Finaud et al., 2006; Brooks et al., 2008). Nevertheless, athletes differ in their redox responses to exercise in hypoxia, for example, if compared with runners, swimmers exhibit a higher antioxidant potential during exercise to exhaustion in hypoxia, due to an enhanced nonenzymatic antioxidant activity such as α-tocopherol (Pialoux et al., 2009a, 2009b). This difference can be explained by the involvement of the upper limbs during swimming, as the triceps brachii is the muscle responsible for the propulsive phase of swimming. A recent study showed that in response to a 4-week period of high-intensity training, the triceps brachii shows a greater oxidative challenge than the quadriceps (Larsen et al., 2015).
It can, therefore, be anticipated that well-trained swimmers would rapidly counteract ROS production by a highly developed antioxidant machinery when swimming in hypoxia. However, ROS-induced oxidative stress and the antioxidant response of swimmers to different intensities in hypoxia have not been tested yet.
Since managing training intensities is one of the main problems of coaches when training in hypoxia (Lundby and Robach, 2015), we aimed to describe ROS-related oxidative damage and both enzymatic and nonenzymatic antioxidant responses to swimming at different intensities in hypoxia.
Materials and Methods
Participants
For our study, we recruited 12 swimmers from the University of Granada Swimming Club (6 men and 6 women) who had more than 12 years of swimming practice and enrollment in competitive swimming events for at least 9 years. Swimmers' characteristics were 24 ± 1. 8 years old, 65.8 ± 3.25 kg of weight, 170 ± 2.5 cm of height, and 13.2% ± 1.66% of body fat. After being fully informed of all the procedures and risks of the study, the swimmers gave their written consent to participation. The protocol followed was according to the Declaration of Helsinki and approved by the Ethics Committee of the University of Granada (Granada, Spain).
Study design
Two months before the experimental period, all swimmers were informed about the need to avoid any antioxidant supplementation. Moreover, after 5 days of food recording, the swimmers' diets were evaluated by means of the Spanish food database to ensure normal ingestion of key antioxidants and macronutrients (Mataix et al., 2009). After an independent dietitian declared that all micro- and macronutrients were near nutritional recommendations, all the swimmers were asked to adopt a similar food pattern throughout the study.
The week before the experimental periods, the participants came to the Physiology Laboratory of the Faculty of Sports for anthropometric measurements. Following the guidelines provided by the International Work Group of Kinanthropometry (IWGK), we calculated the percentage of body fat by taking 19 anthropometric measurements, using the average of three measurements for calculations. Body mass index was calculated as weight (kg)/height (m)2.
The experimental period consisted of six training sessions performed over 3 weeks. During the first training session, swimmers performed low-intensity swimming (LOW) and after 3 days of rest they repeated the same LOW swimming session at moderate altitude (hypoxia). The participants then rested for 7 days and repeated the same protocol but at moderate intensity (MOD), repeating the MOD session in hypoxia after 3 days of rest. Finally, after 7 days of recovery, they performed a high-intensity (HIGH) swimming session and repeated it in hypoxia after 3 days of rest. No exercise was allowed during the 3 days between normoxia and hypoxia sessions, and only light swimming was allowed within the 7-day intervals. All swimmers refrained from vigorous physical activity 48 hours before each swimming session.
Swimming sessions
All the swimming sessions were performed in a 50-m swimming pool with the front crawl technique. The normoxia sessions were performed in Granada, Spain, at 630 m above sea level. The hypoxia swimming sessions were carried out at the High Performance Altitude Training Centre of Sierra Nevada (CARD) located in Granada 2320 m above sea level. For the hypoxia training, subjects woke up early in the morning in Granada and travelled to the CARD by bus for 45 minutes. Once in the swimming pool, the participants performed a typical swimming session, which was divided into warm-up, main training, and cooldown periods of 30 minutes each.
Warm-up and cooldown periods were always similar in terms of objectives and tasks (number of sets, number of repetitions, rest, distance, swimming style, and so on) and focused especially on technical drills.
The main training period, however, was divided into three intensities: LOW, MOD, and HIGH. We followed the swimming intensities described by Mujika et al. (1995) as follows: LOW consisted of continuous swimming, maintaining a constant speed as low as possible, with a focus on a perfect technique, with a lactate accumulation around 2 mmol/L (Intensity 1). MOD consisted of 100-m repetitions interspersed with 20 seconds of recovery. The target time for MOD was obtained by halving each swimmer's personal best time of the season in the 200-m freestyle and adding 10 seconds (Intensity 3). HIGH consisted of 50-m repetitions interspersed with 20 seconds of recovery. The target time for HIGH was obtained by dividing by four each swimmer's personal best time of the season in the 200-m freestyle and adding 2 seconds (Intensity 4). During the main set, the average speed was also registered and the time used to cover each lap noted.
Blood lactate concentration and heart rate assessment
HR (Polar Team 2) and blood lactate (BL; KDK Corporation Lactate Pro System, Kyoto, Japan) were recorded before the beginning of each swimming session and during each resting period within the main training. During the LOW session subjects performed continuous swimming, but, given that 10 seconds is enough to accurately measure HR while swimming (Casuso et al., 2014), they were stopped for 10 seconds every 5 minutes for that purpose.
Blood sampling
Before each training session (Pre), immediately after the cooldown period (Post), and after 15 minutes of recovery (Rec), blood samples (3 mL) were drawn from the antecubital vein with vacutainers. The samples were stored in different containers, one for whole-blood analysis and the other for serum. Hematocrit (HCT) was obtained by microcentrifugation for 10 minutes at 11,000 rpm (BIOCEN). HB was analyzed with Drabkin's method, whereby 20 μL samples of blood were oxidized and quantified spectrophotometrically at 540 nm. After centrifugation, serum was obtained and stored at −80°C until further analysis. All the blood parameters, unless otherwise stated, were normalized to changes in plasma volume (ΔPV). ΔPV at Post and Rec time points were calculated with the Dill and Costill (1974) equation as follows:
where pre refers to the basal hematological data within a given intensity (i.e., LOW, MOD, or HIGH) and hypoxic condition (i.e., hypoxia and normoxia), and post refers to the post measurement (i.e., Post or Rec) under the same condition as Pre.
Nuclear DNA damage (comet assay)
We performed the Comet Assay to evaluate nuclear DNA damage (nDNA-damage) in lymphocytes (% DNA-tail damage). Lymphocytes were isolated by gradient centrifugation. The total sample of blood was diluted in phosphate-buffered saline (PBS; 1:1) and centrifuged at 3500 rpm for 30 minutes. After several centrifugations (1750 rpm in an RPMI Histopaque), the top layer of cells (lymphocytes) was removed and diluted in 500 μL of 10% dimethyl sulfoxide (DMSO)-SBF. The mixture was divided into aliquots of 200 μL for subsequent storage in cryogenic boxes. Lymphocytes (50 μL) were then embedded in a thin agarose gel on a microscope slide. Fragments of damaged DNA then migrated away from the nucleus after electrophoresis treatment. After staining with a DNA-specific fluorescent, the gel was read (Komet 5.5). The extent of DNA liberated from the head of the comet is directly proportional to the amount of nDNA damage (Collins, 2004).
Lipid peroxidation
Hydroperoxides (HPx), as a specific and direct biomarker of lipid peroxidation, were measured (Yoshida et al., 2013). Plasma HPx were determined with the Sigma PD1 kit (St Louis, MO). Absorbance changes at 560 nm were monitored spectrophotometrically.
Thiobarbituric acid assay
Plasma thiobarbituric acid (TBAR) concentration is an indirect method of estimating malondialdehyde (MDA) and was measured as described by Orrenius et al. (1976) through the spectrophotometric measurement of substances that react with TBARs. The reaction of MDA-TBA led to orange pigmentation, which was then read spectrophotometrically on a U-bottomed microplate at 532 nm.
Nonenzymatic antioxidant activity
Alpha-tocopherol and coenzyme Q10 content in plasma were quantified as described by Quiles et al. (2005). First, extraction with ethanol–petroleum ether (60:40) by high-performance liquid chromatography (HPLC) equipped with a diode array detector (Beckman Instruments, Inc., Fullerton, CA) and an HPLC column with a reverse-phase C18 Spherisorb ODS1 of 25 × 0.46-cm was performed. For chromatographic separation, a 120 μL sample (150 μL of pure ether plus the extracted antioxidant sample) was injected. The mobile phase used was a mixture of ethanol and doubly distilled water for HPLC in a ratio of 97:3 (air was removed with a vacuum pump). The flow rate was 1 mL/min, and the total duration of the method was 25 minutes. A TM Automatic Waters 717 plus Autosampler (Gen Tech Scientific) was also used. The images were analyzed by chromatograms that were quantified later.
CAT activity
CAT enzymatic activity was measured in erythrocytes by spectrophotometry (Synergy HT Biotek) as described by Ochoa et al. (2003). A sample of erythrocytes (10 μL) was used. The enzymatic activity of CAT was determined by kinetic reaction as spectrophotometrically analyzed. H2O2 decomposition was conducted by absorbance decrease at 240 nm. The absorbency difference by unit time was the mean of CAT activity.
Glutation peroxidase activity
Glutathione peroxidase (GPx) activity was measured in erythrocytes by spectrophotometry (Synergy HT Biotek). PBS potassium phosphate buffer (KH2PO4 0.1 pH 7.0; 56 μL) containing 0.1 mM EDTA, 19 μL of GSH 99% in bidistilled H2O, 19 μL of glutathione reductase, and sample erythrocytes of 18 μL were incubated at 37°C for 10 minutes. A GEN 5 program was used in the spectrophotometer. First, a 19 μL sample of NADPH (1.5 mM in 0.1% NaHCO3) was added to monitor the independent chemical reaction of HPx for 3 minutes at 340 nm; immediately a 19 μL sample of 30% H2O2 was added for full monitoring of the second enzymatic reaction at 340 nm for 5 minutes. The decrease in concentration of NADPH (Δ[NADPH] min) was calculated from the decrease in absorbance at 340 nm by means of the Lambert–Beer theory and molar extinction coefficient.
SOD activity
SOD activity was determined by the epinephrine method of Misra and Fridovich (1972) based on the inhibition by SOD of cytochrome C reduction. One hundred microliters lysate and 1 mL carbonate buffer were mixed, and then 100 μL of epinephrine was added. Detection was performed at 470 nm.
Skeletal muscle damage
Skeletal muscle damage was determined by serum α-actin quantification as a specific muscle skeletal damage biomarker. Western Blot and densitometric analysis were performed as described previously (Martínez-Amat et al., 2005).
A serum sample (5 μL) from every swimmer was dissolved in Laemmli's sample buffer (62.76 mm Tris-HCl pH 6.8, 1% 2-mercaptoethanol, 1% sodium dodecyl sulfate [SDS], 10% glycerol, and 0.01% bromophenol blue) in a 1:5 ratio, boiled for 5 minutes, microfuged for 1 minute, and analyzed by sodium dodecyl sulfate–polyacrylamide gel electrophoresis (SDS-PAGE) in a Mini Protean II cell (Bio-Rad Laboratories, Hercules, CA) at 60 mA for 1 hour at ambient temperature. Gels with samples of serum were run in duplicate in all cases. Gels for immunoblot analyses were separated electrophoretically and transferred to a nitrocellulose membrane by applying a current of 20 V at ambient temperature for 30 minutes. Blots were treated with blocking solution (20 mM Tris, 0.9 NaCl, 10% nonfat milk) for 3 hours at ambient temperature and then reacted with a 1:2000 dilution of anti-sarcomeric actin monoclonal antibody [Actin (C-11): sc-1615; Santa Cruz Biotechnology, Inc.]. Primary antibodies were incubated overnight at 4°C. Membranes were washed (15 minutes in 5% Tris-buffered saline with Tween) and incubated with bovine anti-goat IgG-HRP: sc-2350 (1:5000, Santa Cruz Biotechnology, Inc.) for 1 hour at ambient temperature, followed by additional washes (15 minutes in 5% Tris-buffered saline with Tween). Proteins were visualized by enhanced chemiluminescence (ECL; Bonus, Amersham, United Kingdom).
Densitometric analysis was carried out by chemiluminescence (Prestained SDS-PAGE Standard, Low Range; Bio-Rad Laboratories). Light emission was detected with a digital imaging system (Fujifilm Image Analyzer LAS-4000, Tokyo, Japan) and analyzed with Multi Gauge software. The procedure was repeated for each study sample. The digital image obtained was formed of 40 wells: the resting of each subject was used as control. This resting sample was compared with the rest of the samples and expressed as relative change.
Statistical analysis
The Statistical Package for the Social Sciences (SPSS 22.0 for Windows, Inc., Chicago, IL) was used for the statistical comparisons. The normal distribution of variables was tested with the Kolmogorov–Smirnov test. Two-way analysis of variance was carried out, and a Tukey's or Tamhane's T2 post hoc test was used to assess the statistically significant differences among the groups. The graphs were generated with Statistica version 7.1 (Stat Soft, Inc., Tulsa, OK). Results are considered statistically significant at p < 0.05 and presented as mean ± standard error of the mean. All variables were analyzed for a sex effect, but none of them showed any differences between men and women.
Results
Our protocol was able to discern between swimming intensities (p < 0.05) as the average swimming velocities were 1.00 ± 0.004 m/s for LOW, 1.24 ± 0.026 m/s for MOD, and 1.39 ± 0.031 m/s for HIGH. These intensities were almost identical between normoxia and hypoxia (Fig. 1A). Although there was a lower HR when LOW was compared with MOD and HIGH, no difference was found between MOD and HIGH; in addition, hypoxia did not modulate HR either at rest or while swimming (Fig. 1B). BL increased in MOD when compared with LOW and further increased during HIGH if compared with MOD (Fig. 1A).

BL, HR, and serum α-actin in response to swimming intensity and hypoxia.
During MOD hypoxic training we found a higher BL when compared with MOD normoxic swimming (Fig. 1A). This effect was not owed to an increased hemoconcentration as hypoxia did not significantly alter plasmatic volume change (Table 1). Moreover, no skeletal muscle damage was associated either with hypoxia or with swimming intensity as α-actin release to serum was similar among LOW, MOD, and HIGH at both normoxia and hypoxia (Fig. 1C).
P < 0.05, compared with normoxia at the same intensity.
CAT, catalase; GRX, glutation reductase; HCT, hematocrit; HGB, hemoglobin; PVΔ, plasmatic volume change; Rec, recovery; RET, retinol plasmatic concentration.
Both TBARs and HPx were measured as markers of lipid peroxidation. We found that swimming intensity did not alter those parameters as they were similar during LOW, MOD, and HIGH (Fig. 2A, B). There were slight differences, however, between those parameters in response to hypoxic swimming. Regarding TBARs, we found a lower value Post Low in hypoxia compared with normoxia. Moreover, we found a lower basal value for TBARs before the HIGH hypoxic training (Fig. 2A). On the contrary, HPx were downregulated in hypoxia in response to LOW at Post and in response to MOD and HIGH at Post and Rec (Fig. 2B). It should be noted that HPx were downregulated by the hypoxic environment per se as we found lower HPx before the first hypoxic training. Regarding DNA damage to lymphocytes, we found no effect in percentage of DNA tails or heads in response to normoxia or hypoxia (Table 1).
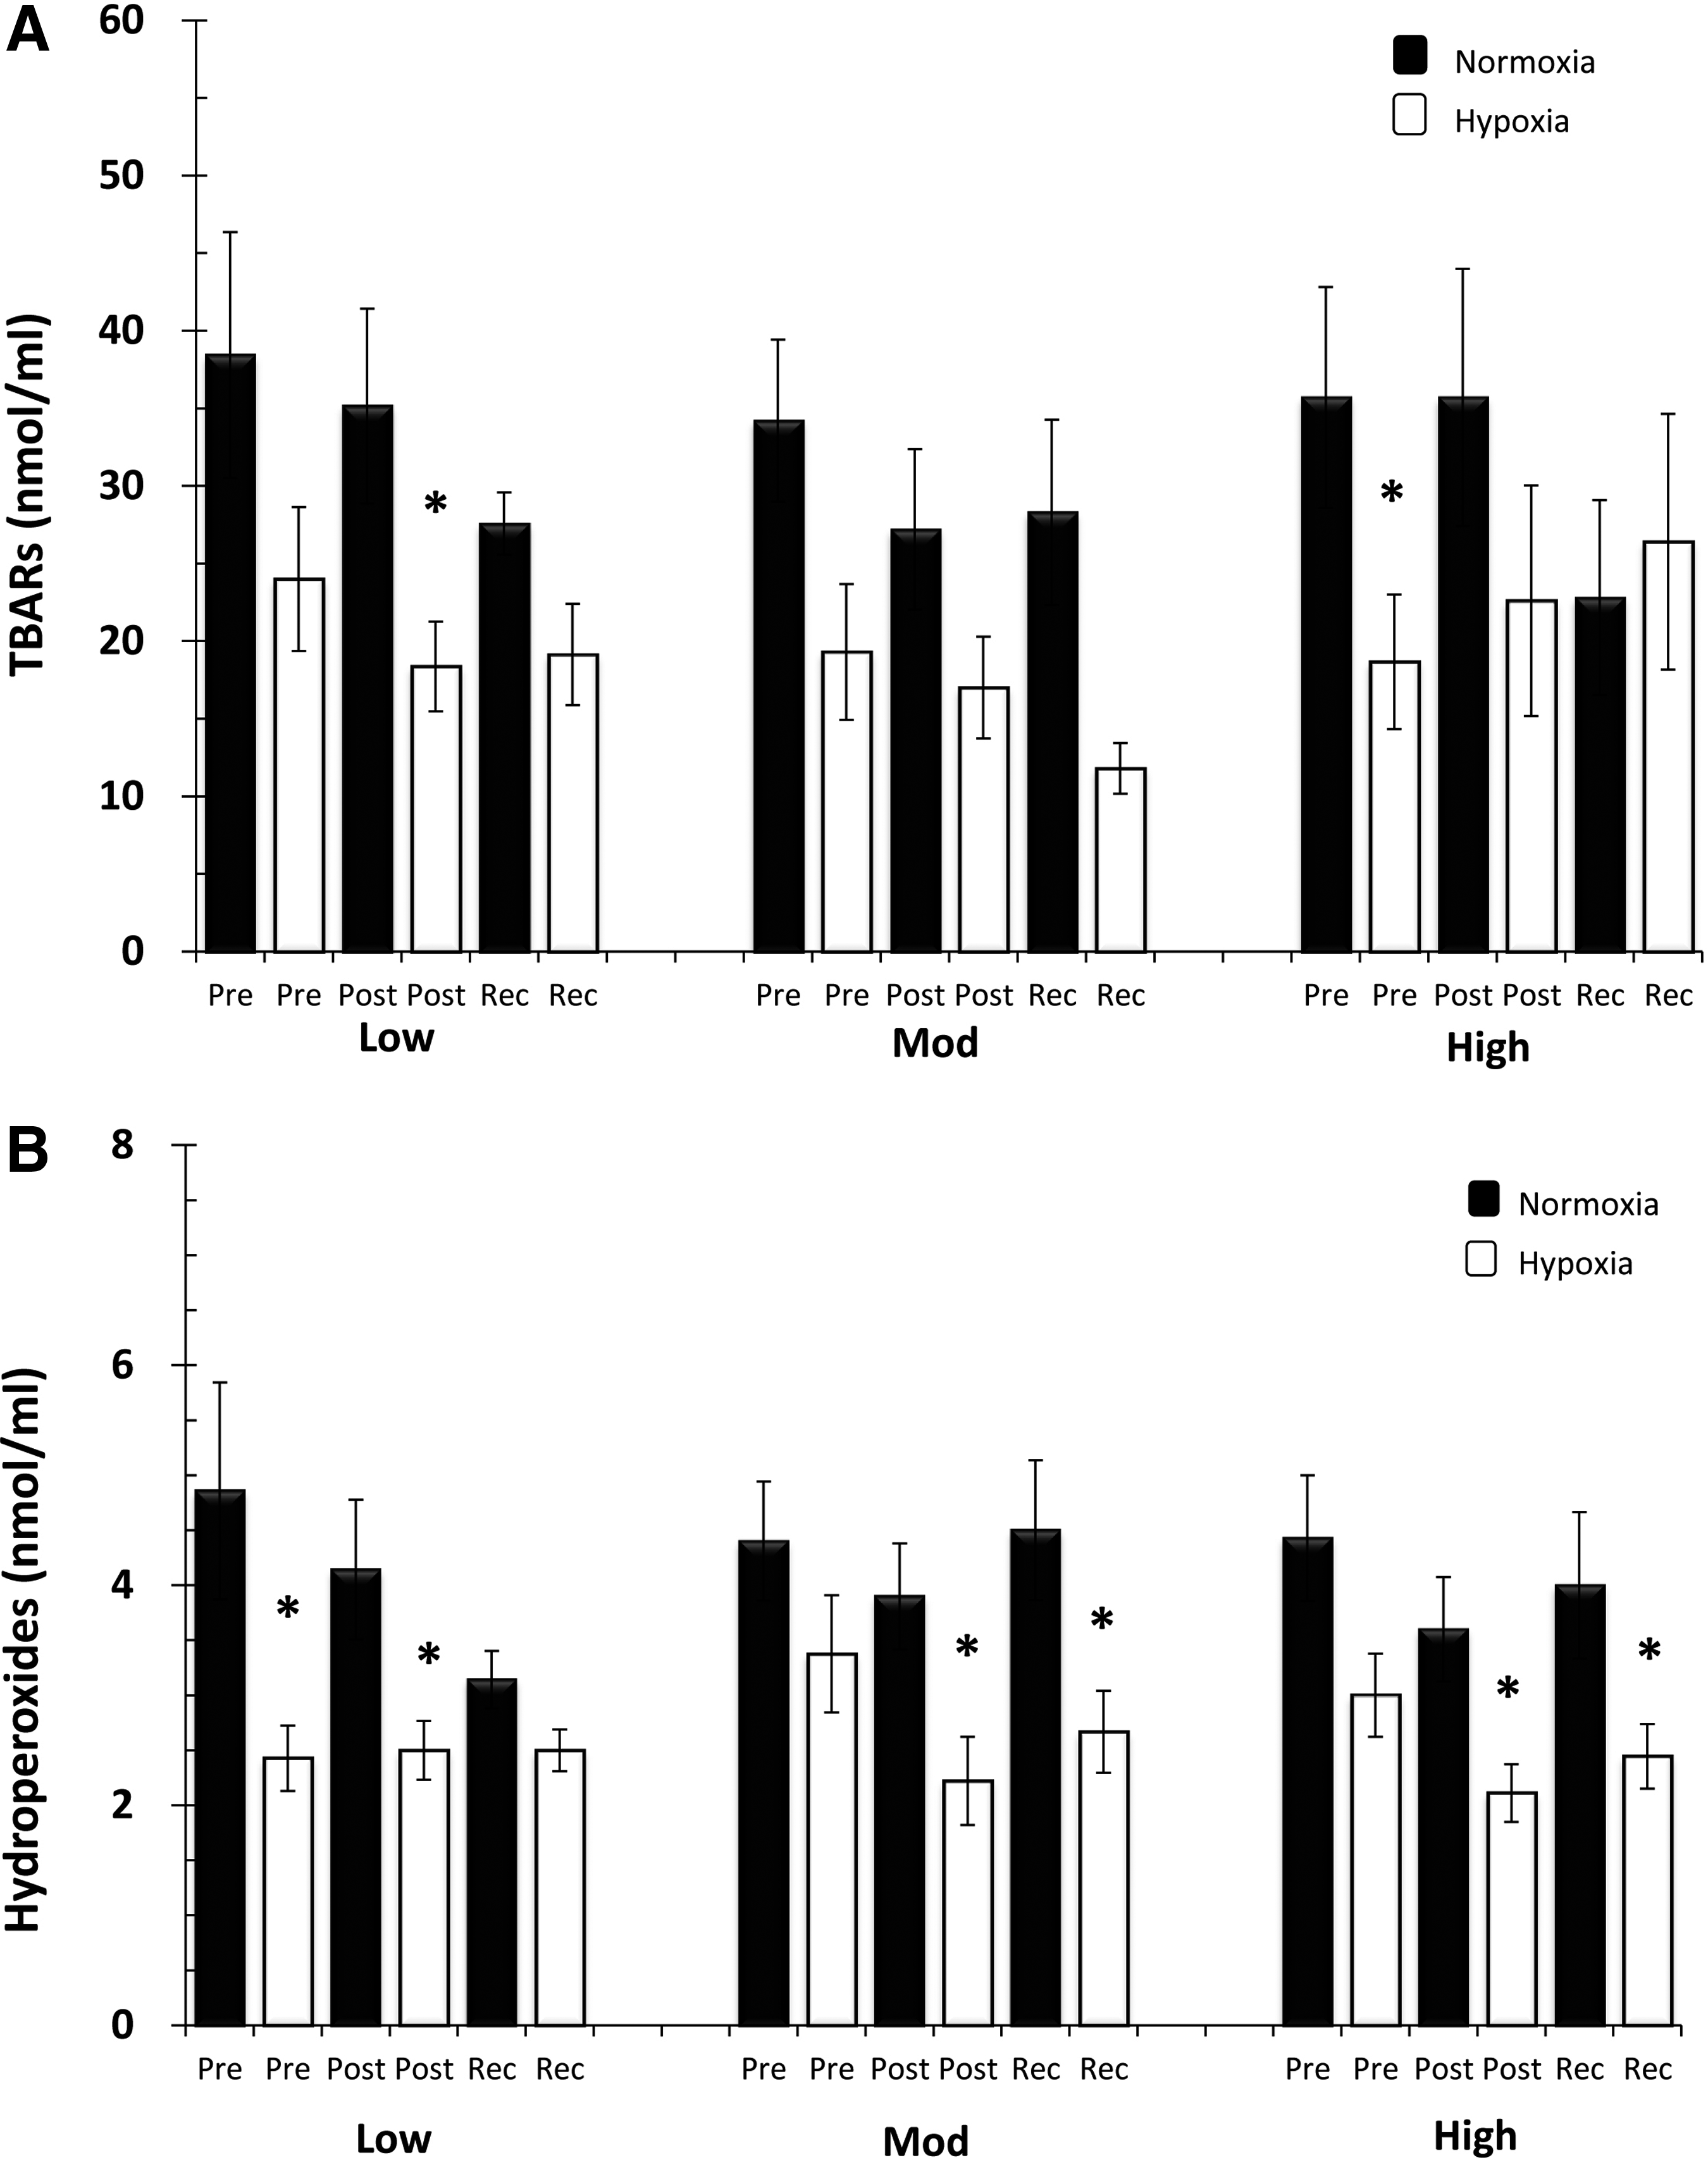
Serum oxidative stress markers in response to swimming intensity and hypoxia.
In normoxia, SOD activity (Fig. 3A) decreased during HIGH at all the time points examined, thus suggesting that the antioxidant activity decreased as swimming intensity increased. This is in accordance with the results shown for GPx activity (Fig. 3B) as it decreased Post High in normoxia. Moreover, the effects shown in response to HIGH were exacerbated in hypoxia as both SOD and GPx decreased their basal levels. Furthermore, GPx activity decreased in hypoxia, compared with normoxia, at Post and Rec during HIGH. Hypoxia decreased the basal level at all the intensities tested of GRx activity (Table 1).

Serum antioxidant enzymatic activity in response to swimming intensity and hypoxia.
In normoxia, we found lower levels of α-tocopherol during Rec after the HIGH swimming session (Fig. 4A). Moreover, under the normoxic condition, we found that coenzyme Q10 levels dropped in response to HIGH (Fig. 4B). Therefore, nonenzymatic antioxidants seem to be mobilized in a swimming intensity-dependent manner. This effect seems to be maximized in hypoxia, as α-tocopherol and coenzyme Q10 levels were lower during MOD swimming in hypoxia. Moreover, coenzyme Q10 levels dropped in response to HIGH, but no differences were found between normoxia and hypoxia.

Serum α-tocopherol and coenzyme Q10 in response to swimming intensity and hypoxia.
Discussion
Our results provide new insights into the mechanisms that regulate oxidative stress during exercise in hypoxia. We found a systemic reduction of the oxidative stress when swimming in hypoxia, as denoted by a marked decrease in lipid peroxidation markers such as HPx and TBARs, and in addition, no DNA oxidative damage was observed. We also found that swimmers exhibit a high modulation of both enzymatic and nonenzymatic antioxidants in response to swimming intensity as demonstrated by coenzyme Q10 and GPx results.
BL is increased in response to hypoxia, which is statistically significant after MOD intensity, whereas skeletal muscle damage and HR are similar between hypoxia and normoxia. The regulation of HR during exercise in hypoxia is a complex process, which has not yet been fully understood. Some studies have reported an increased HR in athletes exercising in hypoxia (Lundby and Van Hall, 2002), which may occur to enhance cardiac output (Talbot et al., 2005). Our results, however, are consistent with those showing no effect of hypoxia on HR (Calbet, 2003). It has been reported that swimming evokes a higher cardiac output than other exercise modes, mainly due to the horizontal position (Lazar et al., 2013), but also due to water immersion (Pendergast et al., 2015); moreover, upper limbs exercise induces a higher heart work than legs (Calbet et al., 2015). Then, moderate hypoxia may be insufficient to further increase cardiac output while swimming.
Moreover, the finding of an increased BL in hypoxia can be explained by an activation of the central nervous system. Indeed, at a given absolute intensity, muscle activation has been recently reported to be higher in hypoxia than in normoxia (Torres-Peralta et al., 2014). Therefore, the higher BL shown in hypoxia without changes in HR can be explained by an activation of the central nervous system, but also because of the nature of swimming.
Swimming mainly involves upper limbs, which have different metabolic responses to exercise than lower limbs. Indeed, mitochondrial responses to training differ between arms and legs (Boushel et al., 2014). Moreover, Larsen et al. (2015) showed that in response to high-intensity training, the triceps brachii shows a greater oxidative stress than the quadriceps, leading to a robust expression of mitochondrial antioxidant enzymes.
Our data on SOD and GPx activity show that the training of the upper limbs by swimming for years may lead to a significant enzymatic antioxidant efficiency. However, there are few studies aiming to describe oxidative stress in well-trained swimmers; it has been reported that adolescent swimmers show an oxidative damage to DNA and lipids in response to an acute sprint swimming session (Kabasakalis et al., 2014), but also in response to moderate swimming intensity (Tauler et al., 2008). In contrast, adult swimmers subjected to high-intensity swimming show a rise in circulating TBARs rapidly counteracted by the antioxidant defenses (Deminice et al., 2010). Moreover, highly experienced swimmers are able to efficiently regulate a redox homeostasis during ultra-long duration swimming (Kabasakalis et al., 2011). These data suggest that as the swimming training status increases, there is a higher protection against oxidative stress induced by each swimming session.
Moreover, our results show a fall in the circulating levels of α-tocopherol and coenzyme Q10 in a swimming intensity manner. This result is consistent with the lower plasmatic α-tocopherol level (∼2%) shown after an “all out” swimming session in highly trained swimmers (Deminice et al., 2010). Therefore, our results support the hypothesis that highly trained swimmers show an enhanced enzymatic and nonenzymatic antioxidant defense.
The high training status of the swimmers could also explain the unchanged DNA damage in response to hypoxic swimming. Indeed, training increases the resistance of lymphocytes to oxidant-induced DNA damage (Niess et al., 1996). Moreover, lipid peroxidation significantly decreases in response to all the swimming intensities in hypoxia and this effect is achieved despite a lower antioxidant activity. Before the first hypoxic swimming session, we found a nonsignificant ∼15% α-tocopherol decrease but a significant decrease of HPx if compared with the basal levels. This effect is even more marked after exercise, especially after hypoxic MOD intensity.
The mobilization of α-tocopherol from circulation to mitochondrial membranes has been previously reported to protect mitochondria from excessive ROS production (Mataix et al., 1998; Quiles et al., 1999). Previous studies conducted on elite swimmers and runners, who exercised in a hypoxic environment, also reported that swimmers mobilize more α-tocopherol in response to the same exercise intensity (Pialoux et al., 2009a, 2009b). The higher α-tocopherol mobilization, if compared with normoxic training, in response to the hypoxic LOW (∼30%) and MOD (∼65%) training intensity, may reflect an acquired mechanism to protect their biological membranes. This effect seems to efficiently work from low to moderate intensities. However, as the hypoxic swimming intensity increases, this mechanism may not be enough to counteract the further increase in ROS production (Quindry et al., 2016). At this point, as evidenced by MOD and HIGH hypoxic data, coenzyme Q10 is also mobilized to block excessive oxidative stress. Indeed, coenzyme Q10 has a double side effect, by blocking free radical production and by regenerating other antioxidants such as α-tocopherol under stressful conditions (Quiles et al., 1999).
The mechanism by which GPx and SOD activity is decreased in an intensity-dependent hypoxic training and the implications for swimming adaptations remain unclear. It has been reported that 4 weeks of high-intensity training attenuates mitochondrial function within upper limbs by a severe increase of oxidative stress, which, in turn, leads to a robust antioxidant enzyme expression (Larsen et al., 2015). Then, it could be possible that years of swimming exercise may improve the ability of nonenzymatic antioxidants to mobilize in response to oxidative stress, thus allowing proper cellular function and expression of antioxidant proteins. However, this hypothesis will require further investigations to be proved.
The present study has some limitations that should be mentioned. First, we found that hypoxia decreases basal levels of SOD, α-tocopherol, and coenzyme Q10 before MOD intensity. Hypoxia also decreases GPx, SOD, TBARs, and coenzyme Q10 before HIGH intensity; this effect could be because we did not randomize the swimming sessions. However, the fact that HPx and GRx also decrease before the LOW hypoxic session strongly suggests an effect induced by hypoxia per se. Another potential constraint is because the blood sample was not obtained immediately after exhaustion, since a 30-minute cooldown period was included. However, this can also be considered a strength because we tested the redox status under a real situation of swimming training.
Conclusions
Hypoxic swimming does not induce oxidative damage in well-trained swimmers, as evidenced by a decrease in the circulating levels of HPx and unchanged DNA damage. This effect is likely induced by a mechanism that stimulates the mobilization of nonenzymatic antioxidants, allowing an efficient antioxidant defense in an intensity-dependent manner.
Footnotes
Acknowledgments
The authors are grateful to the Spanish Superior Sports Council support (grant 26/UPB20/O7). They would also like to thank two sports institutions, Sierra Nevada High Altitude Training Centre (Granada, Spain) and the Athletic and Sport Management Department of the University of Granada (Granada, Spain) where the study was performed. J.A.-V. is the recipient of a “Formación de Profesorado Universitario (FPU)” fellowship award from the Ministry of Education and Science (Spain) (AP2012-1867). This article will be part of J.A.V.'s PhD thesis, which is being performed within the “Nutrition and Food Sciences Program” at the University of Granada.
Author Disclosure Statement
No competing financial interests exist.