
Abstract
Abstract
Horiuchi, Masahiro, Shiro Oda, Tadashi Uno, Junko Endo, Yoko Handa, and Yoshiyuki Fukuoka. Effects of short-term acclimatization at the summit of Mt. Fuji (3776 m) on sleep efficacy, cardiovascular responses, and ventilatory responses. High Alt Med Biol. 18:171–178, 2017.—We investigated the effects of a short period of acclimatization, at 3776 m on Mt. Fuji, on sleep parameters and related physiological responses. Physiological responses were assessed in seven healthy lowlander men during both daytime and sleep while at sea level (SL), as well as for three consecutive nights at high altitude (HA; 3776 m, day 1 [D1], D2, D3, and morning only of D4). Blood pressure variables, heart rate (HR), pulmonary ventilation (VE), and breathing frequency (Bf) progressively increased each day, with significant differences between SL and HA (p < 0.05, respectively). In contrast, end-tidal PCO2 (PETCO2) progressively decreased each day with statistical differences between SL and D3 at HA (p < 0.05). During sleep at HA, mean arterial pressure (MAP) was stable, whereas it decreased during sleep at SL. Sleep efficacy, which was assessed by actigraphy, was linearly impaired with statistical differences between SL and D3 (p < 0.05). These impairments in sleep efficacy at HA were associated with higher MAP and HR, as well as lower Bf and PETCO2 during the daytime (pooled data, p < 0.05, respectively). These results suggest that hypoxia-induced cardiovascular and ventilatory responses may be crucial contributors to changes in sleep efficacy at HA.
Introduction
S
In general, acute exposure to hypoxia, which is common at HA, can cause sympathoexcitation in humans. Since sympathoexcitation and hypoxemia are associated with sleep apnea-related hypertension (Carlson et al., 1993; Narkiewicz and Somers, 1999), studies about the relationship between sleep and physiological responses at high altitude may be clinically relevant. Acclimatization may be a potential adaptation strategy for HA. Previous studies on the effects of short-term acclimatization on sleep parameters, including an apnea/hypopnea index (AHI) and sleep efficacy, have produced equivocal findings. For example, some studies showed that a short-term acclimatization at high altitude may have positive effects on sleep variables (Nussbaumer-Ochsner et al., 2012b; Latshang et al., 2013; Stadelmann et al., 2013), but not all (Bloch et al., 2010; Nussbaumer-Ochsner et al., 2010; Tseng et al., 2015), suggesting that universal findings do not seem to have been obtained. One difficulty with interpreting the effects of acclimatization on sleep parameters and related factors is that environmental and experimental settings are varied. Indeed, it has been suggested that sleep may be dependent on various factors, such as cold temperature, wind, hut noise or smells, or long-distance travel, suggesting that it is essential to conduct studies where sleep parameters are compared in identical settings (San et al., 2013).
One such setting may be Mt. Fuji, which, with a summit of 3776 m, is the highest mountain in Japan; 300,000 tourists climb to the peak each summer. In addition, there are >15 huts on the trail, with a total capacity of >3000 people, resulting in many climbers staying on the mountain overnight (Horiuchi et al., 2016a). In a recent epidemiological study conducted on Mt. Fuji, we reported that a subjective sleep quality index in people with AMS was significantly impaired compared with that in people without AMS (Horiuchi et al., 2016a). However, the precise mechanisms and factors influencing sleep disturbance on Mt. Fuji have not been elucidated. Therefore, further studies are needed to investigate sleep, AMS, and related physiological responses on Mt. Fuji.
We investigated the effects of short duration acclimatization at 3776 m on Mt. Fuji and on sleep parameters, as well as on cardiovascular and ventilatory responses. We hypothesized that short-term acclimatization would reduce sleep disturbance and AMS for climbers on Mt. Fuji. In addition, we predicted that these improvements would be associated with changes in cardiovascular and ventilatory responses. Therefore, the present study was conducted on the summit of Mt. Fuji, using actigraphy to assess sleep parameters. The validity and reliability of this device have been verified and assessed with respect to that of polysomnography (PSG) in healthy participants and in patients with various sleep disorders at SL as well as at HA (Cole et al., 1992; Nussbaumer-Ochsner et al., 2011; Latshang et al., 2016).
Methods
Participants and study locations
Participants were seven healthy lowlander men, with a mean age of 39 ± 7 years, height of 173 ± 5 cm, and body weight of 70 ± 8 kg (mean ± standard deviation [SD]). After a detailed description and explanation of all study procedures, as well as possible risks and benefits of participation, each participant gave written informed consent. Participants were asked to abstain from caffeinated beverages for 12 hours and from strenuous exercise and alcohol for a minimum of 24 hours before experimental sessions. Additionally, participants did not experience altitudes >1500 m within 6 months before participation. All procedures were approved by the ethics committee of Mt. Fuji Research Institute in Japan and were performed in accordance with the guidelines of the Declaration of Helsinki (ECMFRI-01-2014). Studies were conducted at the Mount Fuji Research Institute (1050 m above SL, ambient barometric pressure ≈670 mmHg) in the SL condition and at the Mt. Fuji summit hut in the HA condition (3776 m above SL, ambient barometric pressure ≈480 mmHg).
Study procedure
Studies consisted of daytime and overnight sleep measurements at SL as well as for three consecutive nights at HA (3776 m, day 1 [D1], D2, D3, and morning only of D4). Participants were familiarized with all measurement techniques at SL, including for blood pressure (BP), heart rate (HR) during a free rhythm of respiration that was selected by each individual, and sleep measurement with actigraphy. SL measurements were performed within 2 weeks before ascent. On the ascent day, all participants reached the Self-Defense Forces base camp in the morning by vehicle (1280 m above SL, ambient barometric pressure ≈655 mmHg). Within 3 hours, participants then ascended to the top of Mt. Fuji by riding on a bulldozer and the arrival time at the top of Fuji (∼3776 m) was about 9:00 AM. Resting cardiovascular and ventilatory responses were measured between 14:00 and 16:00 h. Sleep parameters as well as cardiovascular and ventilatory responses were also measured overnight. After three nights at HA (i.e., on the morning of D4), participants walked down the mountain (Fig. 1).
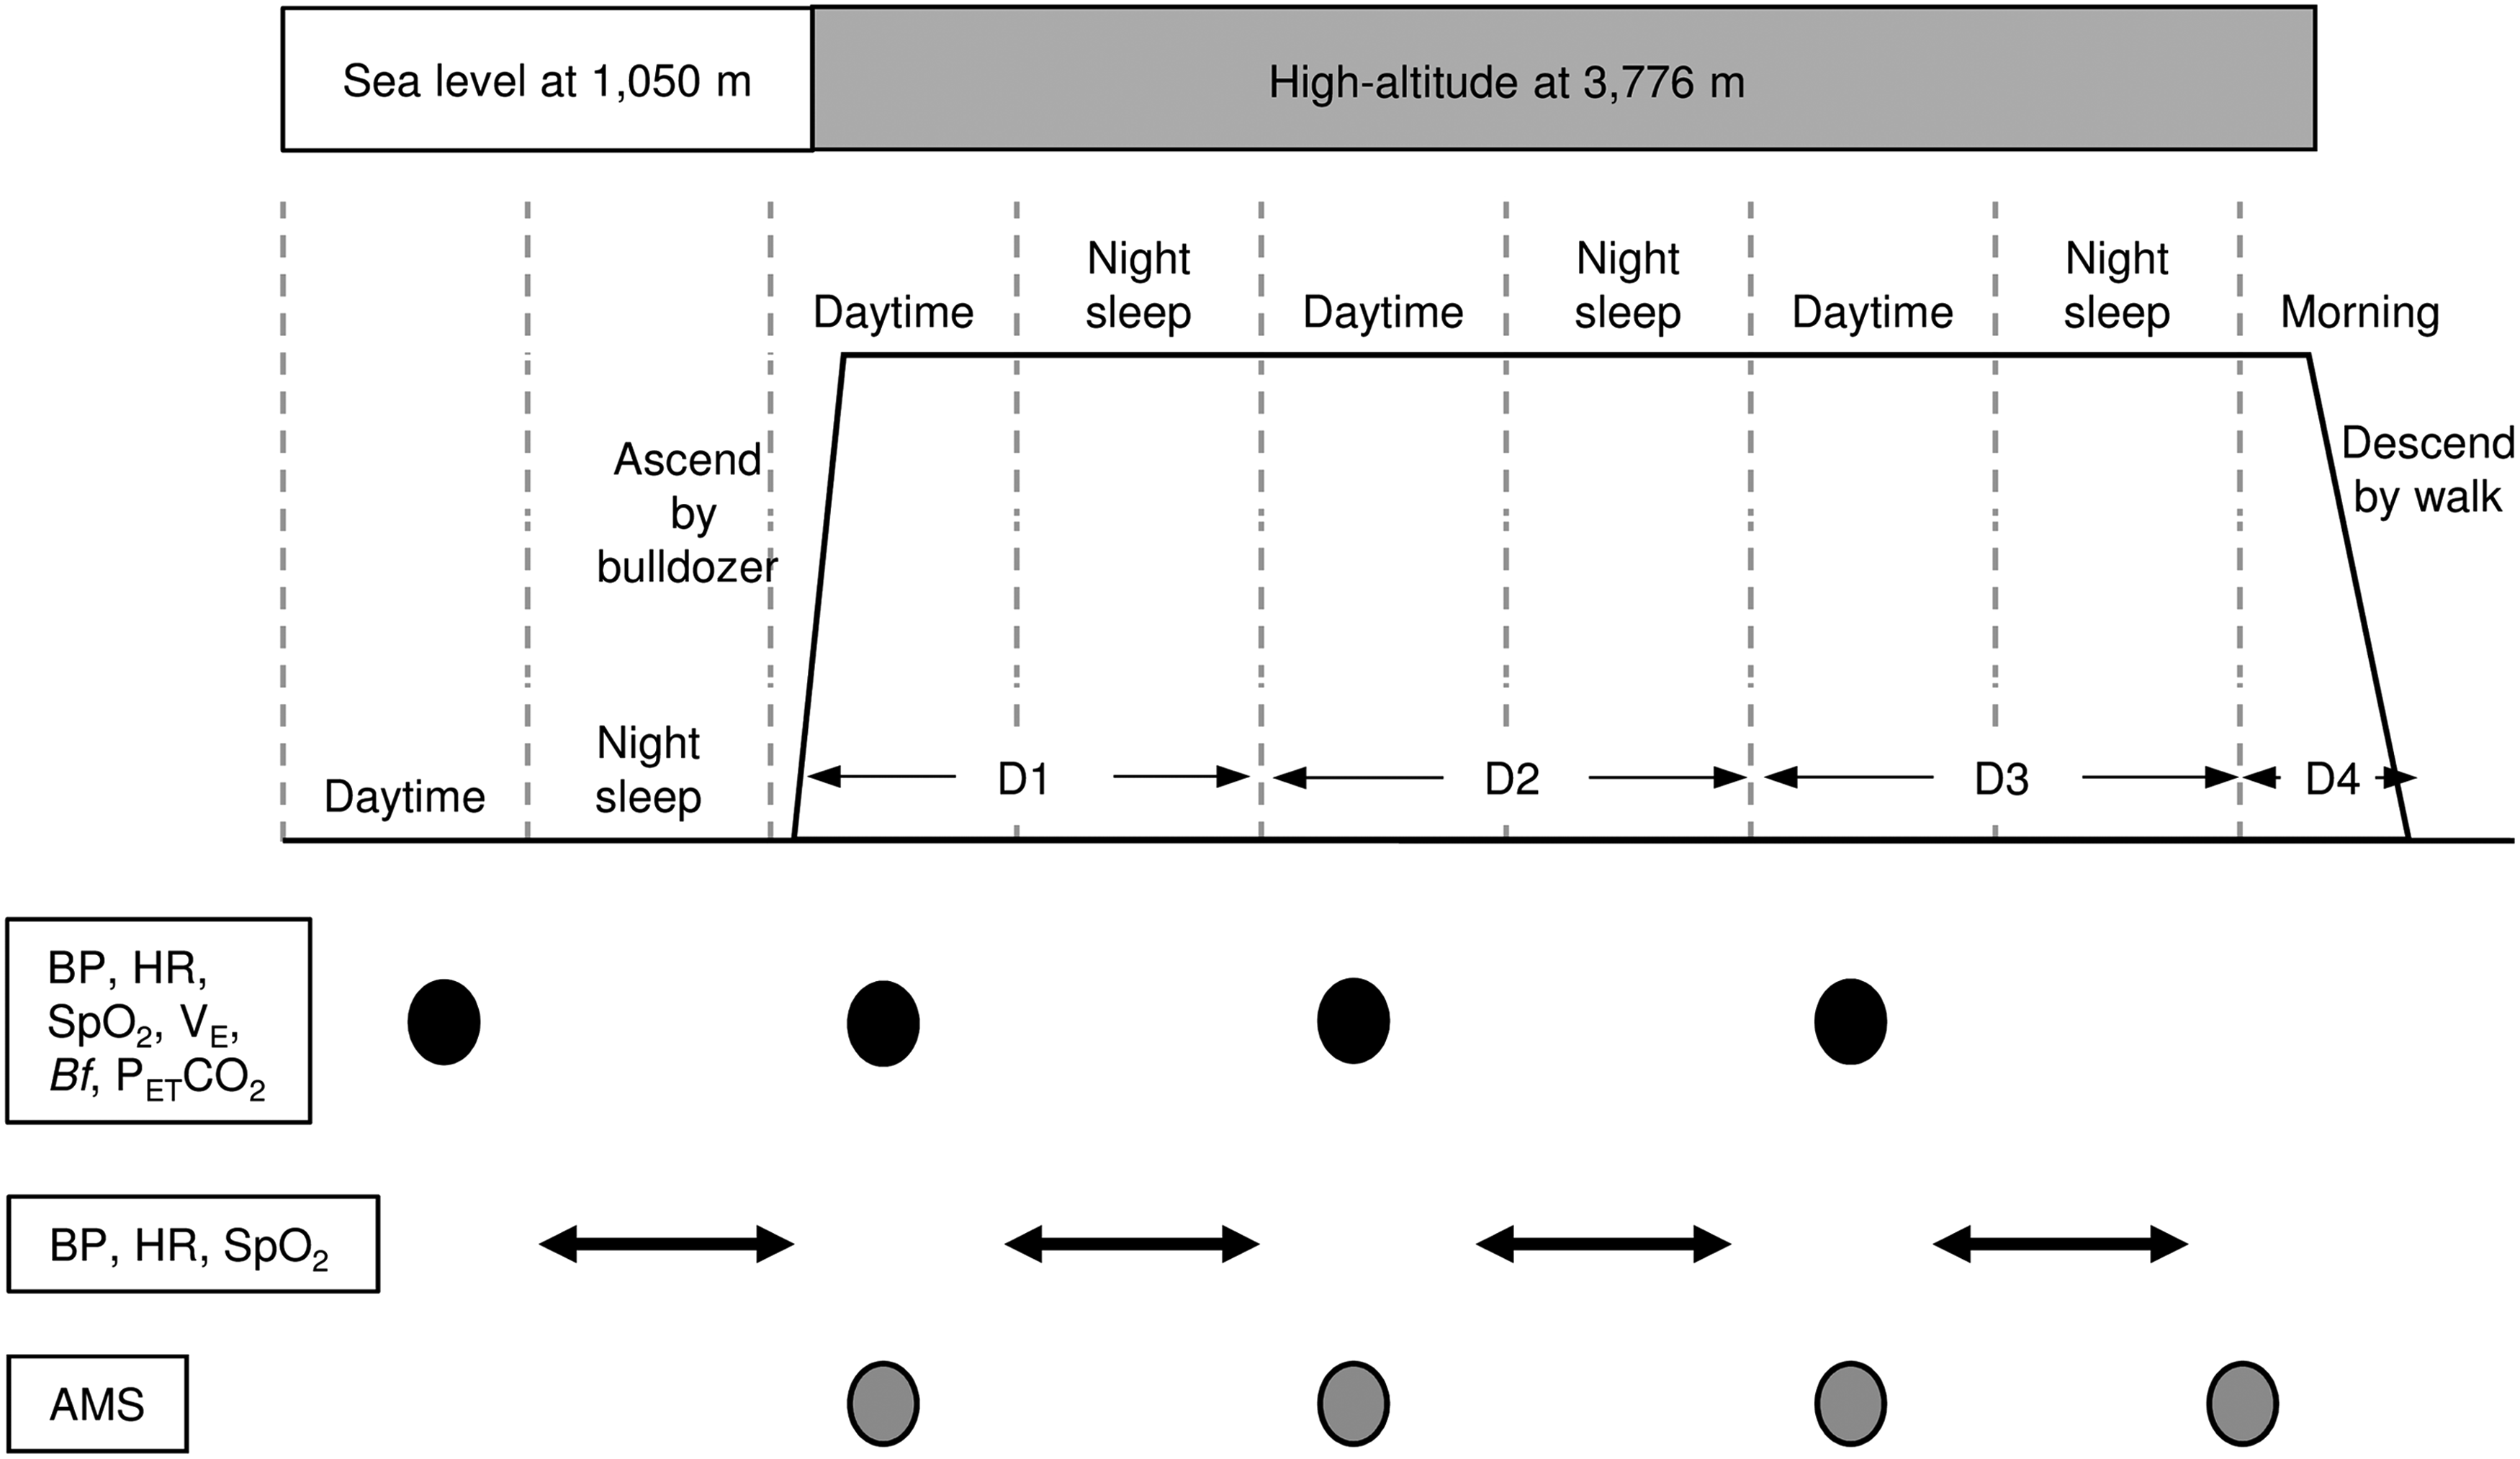
An illustration of the study procedure. Black and gray circles indicate measurement points, and direction arrows indicate night sleep and measurement periods. Note that evaluation of perceived sleep quality was assessed based on the previous night. BP, blood pressure; HR, heart rate; SpO2, arterial O2 saturation; VE, pulmonary ventilation; Bf, breathing frequency; PETCO2, end-tidal PCO2; AMS, acute mountain sickness.
Daytime measurements
Each participant rested in a supine position for 30 minutes, followed by a 10-minute measurement period while remaining supine. During the first 5 minutes, systolic BP (SBP) and diastolic BP (DBP) were measured at 1-minute intervals, using the oscillometric method at the upper left arm (HEM-7420; Omron, Tokyo, Japan). Arterial O2 saturation (SpO2) was continuously monitored by a pulse finger oximeter (Pulfis WB-100; Nissei, Tokyo, Japan). HR was then measured using a CheckMyHeart handheld device (Daily Care BioMedical, Chungli, Taiwan) to evaluate HR variability (HRV) for a further 5 minutes (Leicht et al., 2009). The electrodes of the handheld HRV device were attached to the lower left rib and right clavicle using a lead electrocardiogram signal. The recordings were then transferred to a computer and automatically analyzed using HRV analysis software (Daily Care BioMedical; Chungli, Taiwan). During this period, participants were asked to maintain their self-selected breathing frequency (Bf).
After the 10-minute supine resting measurement, pulmonary ventilation (VE) was measured using a Douglas bag (200 L) for 10 minutes while participants remained seated, and the total volume of VE was measured using a dry test gas meter (model DC-5; Shinagawa, Tokyo, Japan). Simultaneously, end-tidal PCO2 (PETCO2) and Bf were continuously measured using a pocket CO2 monitor (WEC-7301; Capno puti, Nihon Koden, Tokyo, Japan), and SpO2 was also continuously monitored.
Overnight measurements
Participants went to bed after presleep values were measured between 21:30 and 22:00 h. Presleep measurements included BP, HR, and SpO2, using similar methods to daytime measurements, with device modifications to enable us to conduct within-participant comparisons throughout sleep. Participants selected their wake-up time, and measurements ended once awake. BP, HR, SpO2, and Bf were measured throughout each night of the study (SL and D1–D3). Briefly, SBP and DBP were measured at 1-hour intervals, using the oscillometric method at the dominant wrist (Pulfis WB-100; Nissei, Tokyo, Japan). HR and SpO2 were monitored at 1-minute intervals, using the same device. Participants wore the actigraphy recorder on the nondominant wrist (Actigraphy RC type; Ambulatory Monitoring, Inc., Ardsley, NY) to assess sleep parameters using similar methods to previous studies (Cole et al., 1992; Nussbaumer-Ochsner et al., 2011; Latshang et al., 2016). In addition, Bf was measured by a respiratory belt transducer (MLT1132; AD Instruments, Nagoya, Japan). The Bf data were stored on a laptop computer through a field data recorder (es-8; TEAC, Tokyo, Japan) with a sampling rate of 2 Hz.
Assessment of AMS
Symptoms of AMS were evaluated at HA, using the Lake Louise Questionnaire (LLQ) scoring system (Roach et al., 1993). The LLQ consists of a self-report assessment of five AMS symptoms, including (1) headache, (2) gastrointestinal upset, (3) fatigue/weakness, (4) dizziness/light-headedness, and (5) perceived sleep quality. Each question uses a scale of 0–3, indicating nil, mild, moderate, and severe symptoms. A sleep quality index was not used on D1 since there was no hypoxia overnight. On D2–D4, complete LLQ scores were assessed, including the sleep item. Therefore, the total minimum score was 0 and the maximum score was 12 on D1 and the maximum score was 15 at D2–D4. Evaluations of perceived sleep quality were assessed based on the previous night (Table 3). The criteria for AMS were defined as follows: having a total LLQ score ≥3 and headache, but excluding the sleep quality index for comparisons over the course of the study (Roach et al., 1993).
Data analyses
Mean daytime BP values were assessed, and if the difference in SBP or DBP was >5 mmHg compared with the values of one before measurement, these values were excluded and the measurements were repeated. The average BP values of pairs of measurements were taken as the BP values, excluding those that were >5 mmHg values (Horiuchi et al., 2015). Mean arterial pressure (MAP) was calculated using the following equation: (SBP − DBP)/3+DBP. In the frequency domain, the extent of very low-frequency oscillations (VLF: 0.0033–0.04 Hz), low-frequency oscillations (LF: 0.04–0.15 Hz), and high-frequency oscillations (HF: 0.15–0.4 Hz) was quantified using the fast Fourier transformation (Task Force of the European Society of Cardiology and the North American Society of Pacing and Electrophysiology, 1996). HF power was defined as an indicator of para-SNA, and the ratio of LF to HF values was used as an indicator of sympathetic nerve activity (SNA). Tidal volume (VT) was calculated by dividing VE by Bf per minute. The AHI was evaluated using the following criteria: (1) apnea events assessed by respiratory belt transducer ≥10 s/h and (2) oxygen desaturation (measured every 1 minute) assessed by pulse oximeter >3%/h compared with presleep values. AHI was represented as the total number of both types of these events based on a previous study (Ruehland et al., 2009).
Statistics
Values are expressed as mean ± SD. One-way repeated measures analysis of variance (ANOVA) with linear trend analysis and pairwise (Bonferroni) post hoc tests were used to evaluate changes in cardiovascular variables, ventilatory parameters, and sleep conditions during daytime and sleep. As these outcomes are continuous variables, we analyzed them as parametric data set; however, if equal variance failed, Friedman nonparametric and pairwise (Scheffe) post hoc tests were used. Indeed, as equal variance failed in LF/HF, PETCO2, VE, sleep latency, and AHI for these outcomes, we analyzed them as nonparametric data set. For comparisons of AMS scores, Friedman nonparametric and pairwise (Scheffe) post hoc tests were used. Two-way repeated ANOVA was performed to compare MAP, SpO2, and HR values overnight (d × h). Due to varying sleep durations between participants and over the course of the study, these statistics were conducted only for the first 4 hours of sleep. Pearson correlation coefficients were used to assess the relationship between daytime physiological responses and sleep efficacy. Multiple linear regression analysis was also used to predict changes in sleep efficacy. For this analysis, predictor variables for which univariable analysis indicated an association with a probability of p < 0.2 were used in this multiple regression analysis (Latshang et al., 2013). AMS status (presence or absence) was evaluated with a chi-square test. Statistical significance was defined as p < 0.05, and statistical analyses were performed using commercially available software packages (Sigma Stat 3.5; Hulinks, Chicago, IL, and GraphPad Prism 7; GraphPad Software, Inc., La Jolla, CA).
Results
Table 1 presents cardiovascular and ventilatory variables during daytime measurements. BP metrics (SBP, DBP, and MAP), HR, VE, and Bf progressively increased over time from SL to HA, with significant differences between SL and HA using pairwise comparisons (p < 0.05). In contrast, there was no significant linear trend and no differences over time for VT (all p > 0.05). SpO2 acutely decreased on D1 at HA, with significant differences between SL and each of HA D1–D3 (p < 0.05, respectively), but no significant differences in SpO2 values between HA D1–D3 (all p > 0.05). HF linearly decreased (p = 0.001) with differences between SL and D3 (p < 0.05). However, there was no significant linear trend (p > 0.05) and no differences in pairwise comparisons over time for LH/HF (all p > 0.05).
Values are mean ± SD.
p < 0.05 versus sea level.
D, day; SBP, systolic blood pressure; DBP, diastolic blood pressure; MAP, mean arterial pressure; HR, heart rate; HF, high frequency; LF, low frequency; SpO2, arterial O2 saturation; PETCO2, end-tidal PCO2; Bf, breathing frequency; VT, tidal volume; VE, pulmonary ventilation; SD, standard deviation.
Sleep parameters at SL and HA are shown in Table 2. Sleep efficacy was progressively impaired (p = 0.002), and sleep latency was progressively delayed over time (p = 0.047). Sleep efficacy on D3 was significantly impaired compared with at SL (p = 0.012). In contrast, total sleep and arousal durations did not change linearly over time, and pairwise comparisons did not reveal any significant differences (all p > 0.05). AHI acutely increased on D1 at HA, with significant differences between SL and HA D1–D3 (p < 0.05, respectively), but no significant differences in AHI between HA D1–D3 (all p > 0.05).
Values are mean ± SD.
p < 0.05 versus values at sea level.
AHI, apnea/hypopnea index.
Time courses for MAP, SpO2, and HR during sleep each night are shown in Figure 2. At SL, MAP decreased from the onset of sleep throughout the first 4 hours, after which it began to increase toward the time of waking. This finding is in contrast to MAP at HA, which did not decrease during the night. There were significant differences in MAP values between SL and HA at 2, 3, and 4 hours of sleep (p < 0.05, respectively). Conversely, SpO2 had constant values during sleep at SL and significantly higher values compared with HA D1–D3 (p < 0.05, respectively). At HA, SpO2 began to decrease following the onset of sleep and it continued to decrease for the first 4 hours of sleep. Thereafter, SpO2 slightly recovered, but did not reach presleep values. Significant differences were observed between presleep values and values at 2, 3, and 4 hours during sleep within D1, D2, and D3 (p < 0.05, respectively). With regard to HR changes, significant main effects of day and h of sleep were observed, but the interaction was not significant. Overall, HR at HA was higher than at SL, but the difference was not significant (all p > 0.05).

Time course changes in MAP, SpO2, and HR during sleep. Values are means ± standard deviations. *p < 0.05 between sea level and HA D1–D3. †p < 0.05 versus presleep values (Pre) within D1, D2, and D3. Note that two-way repeated measures analysis of variance assessed presleep compared with the first 4 hours of sleep. HA, high altitude; MAP, mean arterial pressure.
Figure 3 describes the relationship between sleep efficacy and daytime physiological responses at HA using pooled data (n = 21; 7 participants × 3 nights at HA). Impaired sleep efficacy was associated with higher MAP and HR (cardiovascular responses), as well as lower Bf and PETCO2 (ventilatory responses), at daytime assessments (p < 0.05, respectively). Additionally, Bf and PETCO2 were evaluated to predict sleep efficacy changes using multiple linear regression for these four parameters (R2 = 0.658, p = 0.001; Bf, p = 0.012; PETCO2, p = 0.048).
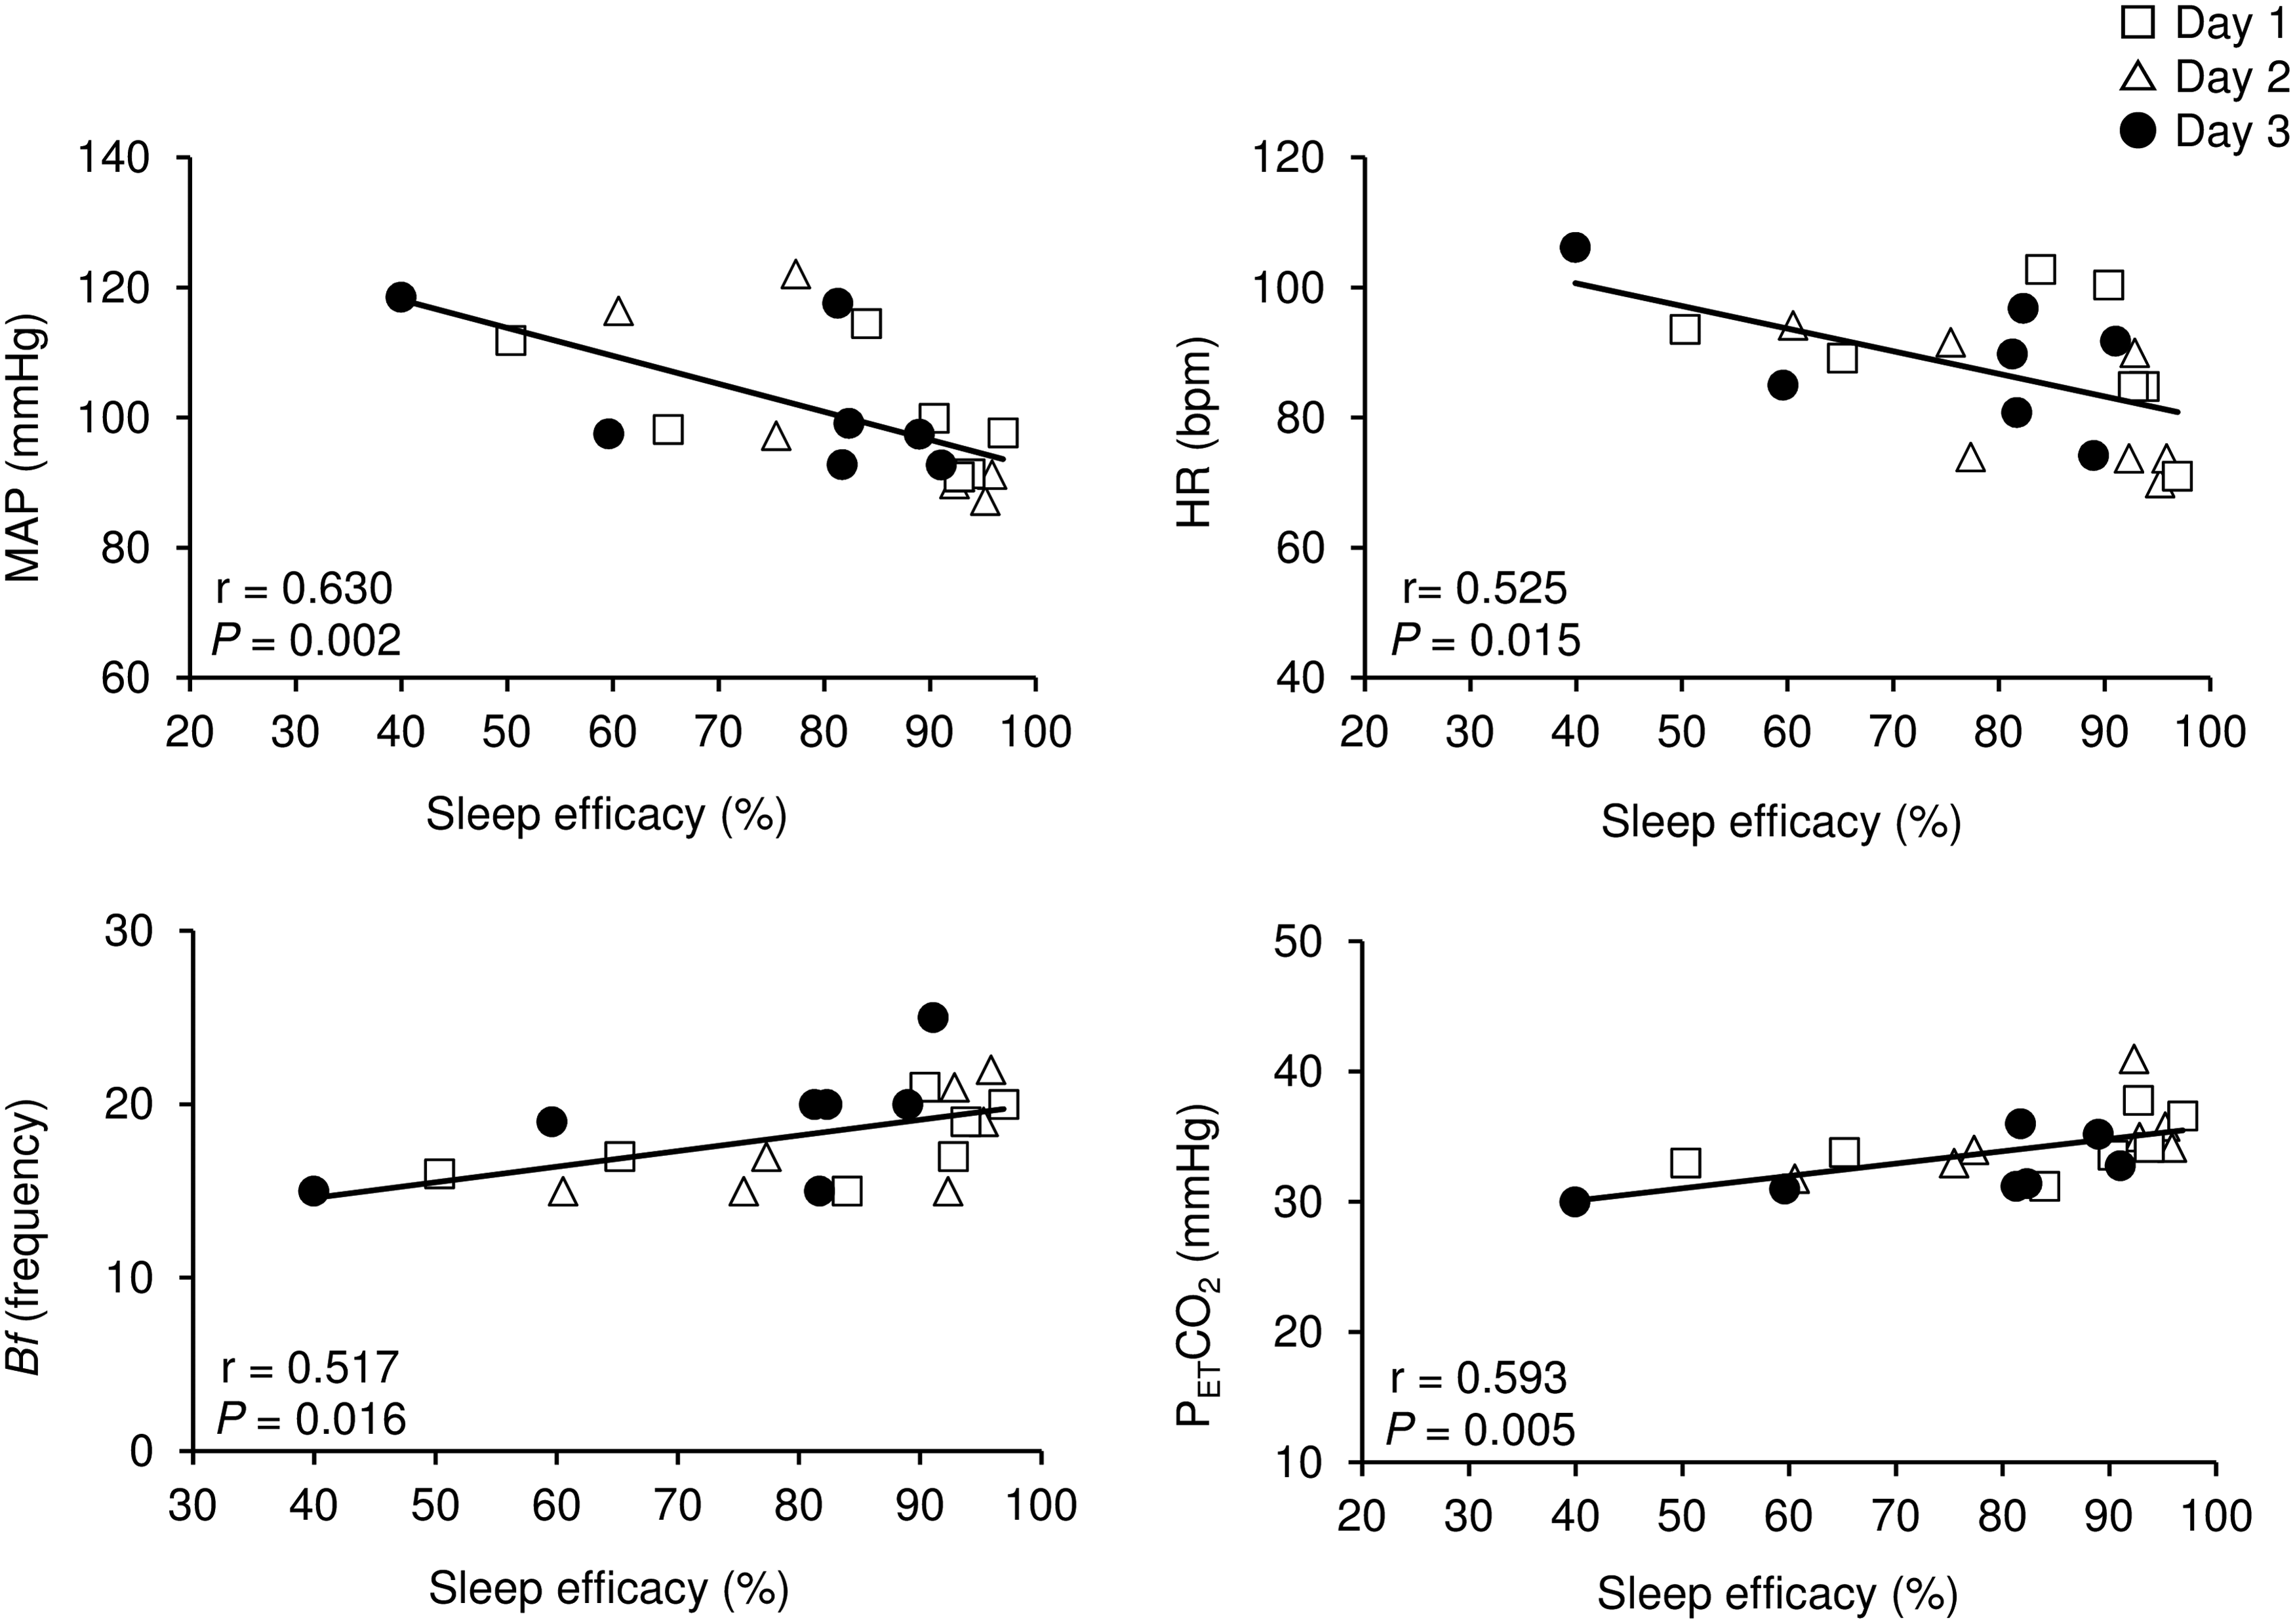
Relationships between sleep efficacy and daytime values of MAP, HR, Bf, and PETCO2 at HA. Note that the sample size was 21 (7 participants × 3 consecutive nights at HA).
As shown in Table 3, there were no significant differences in the LLQ values by D at HA for either the sleep quality index or for the other 4 indices. Furthermore, the number of participants who met the criteria for AMS did not vary over the study period (five of seven participants) as different participants showed symptoms of AMS over the course of the study (all p > 0.05). The severity of AMS did not change over the HA period.
Values are mean ± SD. AMS (+) indicates people who have symptoms of AMS, and AMS (−) indicates people who have no symptoms of AMS. Note that evaluation of perceived sleep quality was assessed as per the previous night, that is, for D1, no sleep quality index is available as the previous night was sea level.
LLQ, Lake Louise Questionnaire; N/A, not appreciable; AMS, acute mountain sickness.
Discussion
This is the first study to investigate the effects of short duration acclimatization on sleep parameters and related physiological responses at the summit of Mt. Fuji. The major findings of the present study are as follows: (1) during short duration acclimatization at HA (3776 m), daytime BP variables, HR, VE, and Bf progressively increased from SL to D4, while PETCO2 progressively decreased over time and SpO2 did not increase over 3 days at HA; (2) sleep efficacy was progressively impaired and symptoms of AMS did not improve over 3 days at HA; (3) during sleep at HA, MAP was stable, while SpO2 gradually decreased and did not recover to presleep values; and (4) higher daytime MAP and HR, as well as lower Bf and PETCO2, were associated with impaired sleep efficacy.
Daytime responses
We observed continuous elevation of daytime BP variables (SBP, DBP, and MAP) and HR, as well as HF reductions during the period of HA exposure. Our results may indicate continuous increases in SNA and decreases in para-SNA over a 3-day exposure to HA. Previous studies have reported that DBP and MAP remained markedly elevated after acclimatization for 5 days (Kanstrup et al., 1999; Liu et al., 2014). In addition, muscle sympathetic nerve activity indicated enduring sympathetic overactivity and increased MAP even after 4 weeks of acclimatization at HA (Hansen and Sander, 2003). Furthermore, HRV, an indirect assessment of SNA, is associated with BP control in prehypertensive participants (Pal et al., 2011).
Continuous progressive increases in VE and Bf, in conjunction with no differences in VT, were observed at D1–D3 of HA compared with at SL. These results indicate that hypoxic ventilatory responses persist throughout 3 days of HA exposure, and hyperventilation may result from increased Bf at an altitude of 3776 m, without change in VT (West et al., 1983).
Overnight responses and symptoms of AMS
In the present study, overall sleep disturbance was observed at HA and became progressively worse over time. These results indicate that 3 days of acclimatization at HA on Mt. Fuji did not have beneficial effects on sleep disturbance. Moreover, our MAP and SpO2 findings during sleep indicate that enhanced SNA and hypoxemia persisted even after 3 days of acclimatization. A previous study demonstrated that SpO2 and severity of AMS significantly improved on the third night of 3 days of acclimatization at 4539 m (Nussbaumer-Ochsner et al., 2012b). Sleep efficacy was also significantly improved on the third night compared with the first night (Nussbaumer-Ochsner et al., 2012b). The severity of AMS is related to sleep disturbance (Burgess et al., 2004; Nespoulet et al., 2012; Nussbaumer-Ochsner et al., 2012a) and hypoxemia, as indicated by lower SpO2 (Erba et al., 2004; Nespoulet et al., 2012; Liu et al., 2014). The use of an oxygen enrichment room at 3800 m significantly improved deep sleep and hypoxemia compared with ambient air room (Barash et al., 2001). Thus, AMS and SpO2 severity may have affected sleep efficacy in previous studies, although those parameters did not improve with acclimatization in the present study.
Relationship between sleep efficacy and daytime physiological responses
In the present study, significant relationships between sleep efficacy and several daytime physiological responses were observed when HA data were pooled. Higher MAP and HR are induced by enhanced SNA, therefore sympathetic overactivity during the daytime may persist throughout the night and disturb sleep. Interestingly, higher Bf was associated with improved sleep efficacy, while lower PETCO2 was associated with sleep disturbance, indicating a potential mechanism for the effects of hypoxic ventilatory responses on sleep efficacy. This relationship appears to be interactive and elaborative as greater Bf-induced hyperventilation is associated with lower PETCO2. Furthermore, of these four parameters (i.e., MAP, HR, PETCO2, and Bf), our multiple linear regression determined that Bf and PETCO2 are potential candidates for predicting sleep efficacy. There are several possible explanations for these relationships. A recent study reported that people without AMS had higher VE values than people with AMS (Nespoulet et al., 2012). Larger ventilatory responses at HA may also produce higher SpO2 values, suggesting that these responses may be beneficial HA adaptations (Schoene et al., 1984). Another possibility may be a relationship between cerebral blood flow (CBF) and PETCO2. CBF is strongly regulated by PaCO2 levels (Paulson et al., 1990), therefore a potential relationship between CBF and sleep efficacy should be considered, especially given that patients with obstructive sleep apnea have lower CBF during sleep (Baril et al., 2015). Taken together, the findings suggest that larger hypoxic VE and Bf values as well as sustenance in PETCO2 level may result in improved sleep efficacy.
Methodological considerations
There are several limitations to the present study. First, the sample size and statistical power were low for multiple comparisons. Our linear trend analysis addressed the issue of low statistical power by focusing on the overall slope and fit of cardiovascular responses, ventilatory responses, and sleep indices over the study period, thus reducing the number of comparisons. This approach was particularly advantageous because the changes in these parameters were subtle and showed greater variation between participants over the study (Horiuchi et al., 2016b). We also conducted post hoc power analysis for pairwise comparisons that were observed with significant differences as the standard of 80% power with a two-sided significance level of 0.05 (GPower 3.1). We estimated that a sample size of 7 would have been necessary to achieve the appropriate statistical power for most outcomes; however, a sample size of 12 would have been necessary for VE and sleep efficacy. Second, we could not evaluate detailed sleep conditions, such as rapid and nonrapid eye movements, and central or obstructive sleep apnea as we did not use PSG. However, the actigraphy devices are much smaller, wearable, and easier to use compared with PSG equipment, making them more practical in a clinical setting and comfortable during sleep. It was also reported that algorithms of actigraphy could distinguish sleep from wakefulness ∼88% of the time and that sleep percentage and latency assessed by actigraphy correlated with 0.82 and 0.90, respectively, corresponding to those assessed by the PSG (Cole et al., 1992). Moreover, recent studies have also confirmed that this device is valuable and informative for assessing effects of HA and on sleep efficacy and/or duration during field studies (Nussbaumer-Ochsner et al., 2011; Latshang et al., 2016). PSG recordings obtained during the first night are generally excluded from analyses, so these data from the present study should be interpreted with caution (Toussaint et al., 1995). However, assessment of the first night of sleep was required by our design to investigate the effects of acclimatization. Another concern is insufficient information about perceived sleep quality index. In this study, we evaluated perceived sleep quality index by the subscale of Lake Louise Scoring system and Oguri–Shirakawa–Azumi sleep inventory that was established by Japanese researchers' group (Supplementary Table S1; Supplementary Data are available online at www.liebertpub.com/ham). However, we mainly tried to investigate the relationship between changes in sleep condition and in cardiovascular and ventilatory responses. Finally, we did not assess VE during sleep, thus it was impossible to observe drastic reductions in VE during sleep to evaluate AHI in more detail. Therefore, future studies should incorporate more detailed sleep observations.
In conclusion, our results demonstrate that daytime BP values, HR, VE, and Bf progressively increase at HA, while PETCO2 progressively decreases. Sleep efficacy, SpO2, and AMS symptoms did not recover over 3 days at HA. In addition, sleep efficacy was related to higher daytime MAP and HR, as well as lower Bf and PETCO2. Specifically, lower Bf and PETCO2 predict changes in sleep efficacy, as indicated by multiple regression. Overall, short duration acclimatization on Mt Fuji did not improve enhanced SNA, hypoxemia, AMS, and sleep efficacy.
Footnotes
Acknowledgments
The authors thank all participants for their contributions to the study. They would also like to thank all members of the Mount Fuji Research Station for their technical support at the summit of Mt. Fuji.
Author Disclosure Statement
No competing financial interests exist.
References
Supplementary Material
Please find the following supplemental material available below.
For Open Access articles published under a Creative Commons License, all supplemental material carries the same license as the article it is associated with.
For non-Open Access articles published, all supplemental material carries a non-exclusive license, and permission requests for re-use of supplemental material or any part of supplemental material shall be sent directly to the copyright owner as specified in the copyright notice associated with the article.