
Abstract
Abstract
Objective:
Clinical studies have shown that oral vitamin C supplementation can reduce serum uric acid levels in multiple populations and may also improve acute mountain sickness. However, it is unclear whether this protocol can improve high-altitude hyperuricemia. Therefore, we aimed to evaluate the role of vitamin C supplementation on high-altitude hyperuricemia.
Methods:
A preliminary prospective control study was performed in 2015. Young male army recruits (n = 66), who had recently arrived on the Tibetan Plateau for the first time, were recruited for study I. Subjects were assigned to either the vitamin C group, who took an oral daily dose of 500 mg vitamin C for 1 month, or the blank control group, who had no intervention. The levels of serum uric acid, serum creatinine, and blood urea nitrogen were monitored at baseline and at the end of 1 month. In a second study II in 2016 (n = 120), the effect of 500 mg/d vitamin C on high-altitude hyperuricemia was compared with 75 IU/d of vitamin E.
Results:
In study I, the level of serum uric acid at 1 month was significantly higher than at baseline (436.1 ± 79.3 μmol/L vs. 358.0 ± 79.8 μmol/L, p < 0.001) and the prevalence of hyperuricemia was also significantly higher (63.6% [95% confidence interval, CI: 52.0%–75.2%] vs. 19.7% [95% CI: 10.1%–29.3%], p < 0.001). Both the level of serum uric acid (411.5 ± 74.2 μmol/L vs. 460.8 ± 54.8 μmol/L, p = 0.003) and the prevalence of hyperuricemia (48.5% [95% CI: 31.4%–65.6%] vs. 78.8% [95% CI: 64.9%–92.7%], p = 0.020) were significantly lower in the vitamin C group than in the blank control group. In study II, the levels of serum uric acid and the frequency of hyperuricemia also increased over 1 month and were similar in the vitamin C and the vitamin E groups at both baseline and 1 month (p > 0.05). The change in serum uric acid was positively correlated with both the changes in serum creatinine (r = 0.599, p < 0.001) and blood urea nitrogen (r = 0.207, p = 0.005).
Conclusions:
These findings indicate that healthy young men develop an increase in serum uric acid within a month of moving from low to high altitude. Oral vitamin C supplementation can safely reduce this increase at a low cost.
Introduction
T
High-altitude hyperuricemia was first reported in 1968 (Sobrevilla and Salazar, 1968). In local Tibetan Plateau populations, the incidence of hyperuricemia varies from 29.1% to 45.6% (Yan et al., 2007; Chen et al., 2011). People migrating from the plains to the plateau have significant increases in serum uric acid level during their time at high altitude (Cui et al., 2000; Yan et al., 2007). Some studies suggest that the increased serum uric acid level was correlated with high-altitude hypoxemia (Braghiroli et al., 1993; Gonzales and Tapia, 2013). In addition, the acute rise in serum uric acid level caused gout flares and other serious diseases (Gupta et al., 2007; Handler, 2010; Nakazawa et al., 2013). Therefore, the prevention of high-altitude hyperuricemia in people migrating from low to high altitude may be worthwhile. Based on current knowledge, the mechanism of high-altitude hyperuricemia is not the same as low-altitude hyperuricemia, due to associations with high-altitude hypoxemia, lactic acid accumulation related to hypoxemia, and polycythemia (Arestegui et al., 2011). Therefore, the prevention strategy for high-altitude hyperuricemia may be different from hyperuricemia in other populations.
Vitamin C, known as
However, the effects of vitamin C supplementation on people migrating to high altitude for the first time have not been investigated. In this study, we have investigated the effects of vitamin C on serum uric acid levels in a homogeneous population of young male army recruits having their first high-altitude experience on the Tibetan Plateau.
Methods
Study subjects
The study was conducted using male army recruits within a week of their first arrival on the Tibetan Plateau. They were enrolled in October 2015, and their training camp was at 3700 m altitude. All subjects lived in the army camp for the duration of the study, which involved a homogeneous diet, exercise regime, and lifestyle. Cigarettes and alcohol were forbidden. Two groups of recruits were chosen for study I by the field operator, and they were assigned to either the vitamin C group or the blank control group. Subjects with any chronic disease and subjects taking any long-term medication were excluded at the time of the standard medical examination for army recruits serving at high altitude. Subjects who had previously lived at an altitude >2500 m and subjects who did not complete follow-up were also excluded. This study was the pilot study for a clinical trial (ChiCTR-IOR-16008294). It was conducted according to the Declaration of Helsinki guidelines and approved by the Ethical Committee of Kunming General Hospital. Written informed consent was obtained from all subjects.
Study design
Study I was a prospective pilot study, in which vitamin C pills (Shanxi Taiyuan Pharmaceutical Co. Ltd.) were orally administered to subjects in the vitamin C group at a dose of 500 mg daily for 1 month. This dose was chosen after consulting a meta-analysis of the effect of oral vitamin C supplementation on serum uric acid (Juraschek et al., 2011), in which the median study dose was approximately five times the recommended dietary allowance. No medication was given to the blank control group.
In October 2016, a second study (study II) was performed at the same training camp as study I to compare the hypouricemic effects of two antioxidant vitamins: vitamin C and vitamin E. In study II, the blank control group was replaced by the vitamin E group, in which vitamin E pills (Shanxi Taiyuan Pharmaceutical Co. Ltd.) were orally administered at a dose of 75 IU daily for 1 month. All the other experimental procedures were identical to study I.
In both studies, the levels of serum uric acid, serum creatinine, and blood urea nitrogen were monitored in fasting venous serum samples taken at baseline and at the end of 1 month. Moreover, baseline indicators were also measured and recorded in a corresponding manner, as oxygen saturation (SpO2) tested by pulse oximeter. The plasma was isolated and sent to the Tibet Military Region General Hospital for analysis and cryopreservation.
Assessment of serum uric acid
Uric acid concentrations were determined by the URO-PAP method (Sichuan Maker Science Technology Co. Ltd.) on an automatic biochemical analyzer (Hitachi 7180) at the Laboratory Department, Tibet Military Region General Hospital. Hyperuricemia was defined as uric acid >416 μmol/L (7.0 mg/dL) for men in accordance with American College of Rheumatology (ACR) guidelines.
Statistical analysis
Categorical variables are shown as percentages (% [95% confidence interval, CI]) and continuous variables as the mean ± standard deviation. The chi-square test was used to compare the differences in categorical variables between groups, the Student's t-test was used for comparisons of continuous variables, and the Pearson correlation coefficient was used for analyzing relationships between two variables. Analysis of covariance was used to analyze interactions between variables. The criterion for statistical significance was set at p < 0.05. Statistical analyses were conducted using IBM SPSS Statistics 19 (IBM, Armonk, NY) and the figures were drawn using the GraphPad Prism software package (version 5 for Windows; GraphPad Software, San Diego, CA).
Results
Baseline clinical parameters
A total of 66 recruits were enrolled in study I, and none of these subjects met exclusion criteria. The baseline clinical characteristics are described in Table 1. There were no significant differences between the baseline characteristics of the vitamin C and the blank control groups (p > 0.05 for all comparisons).
Data are presented as either percentage (%) or mean ± SD. The p-values compare the blank control group (n = 33) with the vitamin C group (n = 33) using either the Student's t-test or the chi-square test as appropriate.
BMI, body mass index; BUN, blood urea nitrogen; HR, heart rate; HUA, hyperuricemia; SBP, systolic blood pressure; SCr, serum creatinine; SD, standard deviation; SpO2, oxygen saturation; SUA, serum uric acid.
The effects of high altitude on serum uric acid over 1 month
At the end of study I, the mean serum uric acid level in the whole group of subjects (n = 66) was significantly increased (436.1 ± 79.3 μmol/L vs. 358.0 ± 79.8 μmol/L, p < 0.001) (Fig. 1A), and the increase occurred in 81.8% of subjects. The incidence of hyperuricemia at the end was also increased in comparison with the baseline (63.6% [95% CI: 52.0%–75.2%] vs. 19.7% [95% CI: 10.1%–29.3%], p < 0.001) (Fig. 1B). This is consistent with the possibility that entering a high-altitude area from a low-altitude area results in a rapid increase in serum uric acid levels.

The effects of high altitude on serum uric acid levels.
The effects of oral vitamin C on serum uric acid
In study I, the mean serum uric acid levels (345.7 ± 80.4 μmol/L vs. 370.2 ± 78.4 μmol/L, p = 0.214) and the prevalence of hyperuricemia (18.2% [95% CI: 5.0%–31.4%] vs. 21.2% [95% CI: 7.3%–35.1%], p = 0.757) were similar in the vitamin C and the blank control groups at baseline (Table 1). At the end of study I, the serum uric acid levels increased in both the vitamin C group (411.5 ± 74.2 μmol/L vs. 345.7 ± 80.4 μmol/L, p < 0.001) (Fig. 2A) and the blank control group (460.8 ± 54.8 μmol/L vs. 370.2 ± 78.4 μmol/L, p < 0.001) (Fig. 2A). However, the serum uric acid level in the vitamin C group was significantly lower than that in the blank control group (411.5 ± 74.2 μmol/L vs. 460.8 ± 54.8 μmol/L, p = 0.003) (Fig. 2A) at the end of the study. The prevalence of hyperuricemia was also lower in the vitamin C group than in the blank control group (48.5% [95% CI: 31.4%–65.6%] vs. 78.8% [95% CI: 64.9%–92.7%], p = 0.020) (Fig. 2B). This suggests that oral vitamin C supplementation reduces but does not prevent the increase in serum uric acid levels that occurs after moving to high altitude.
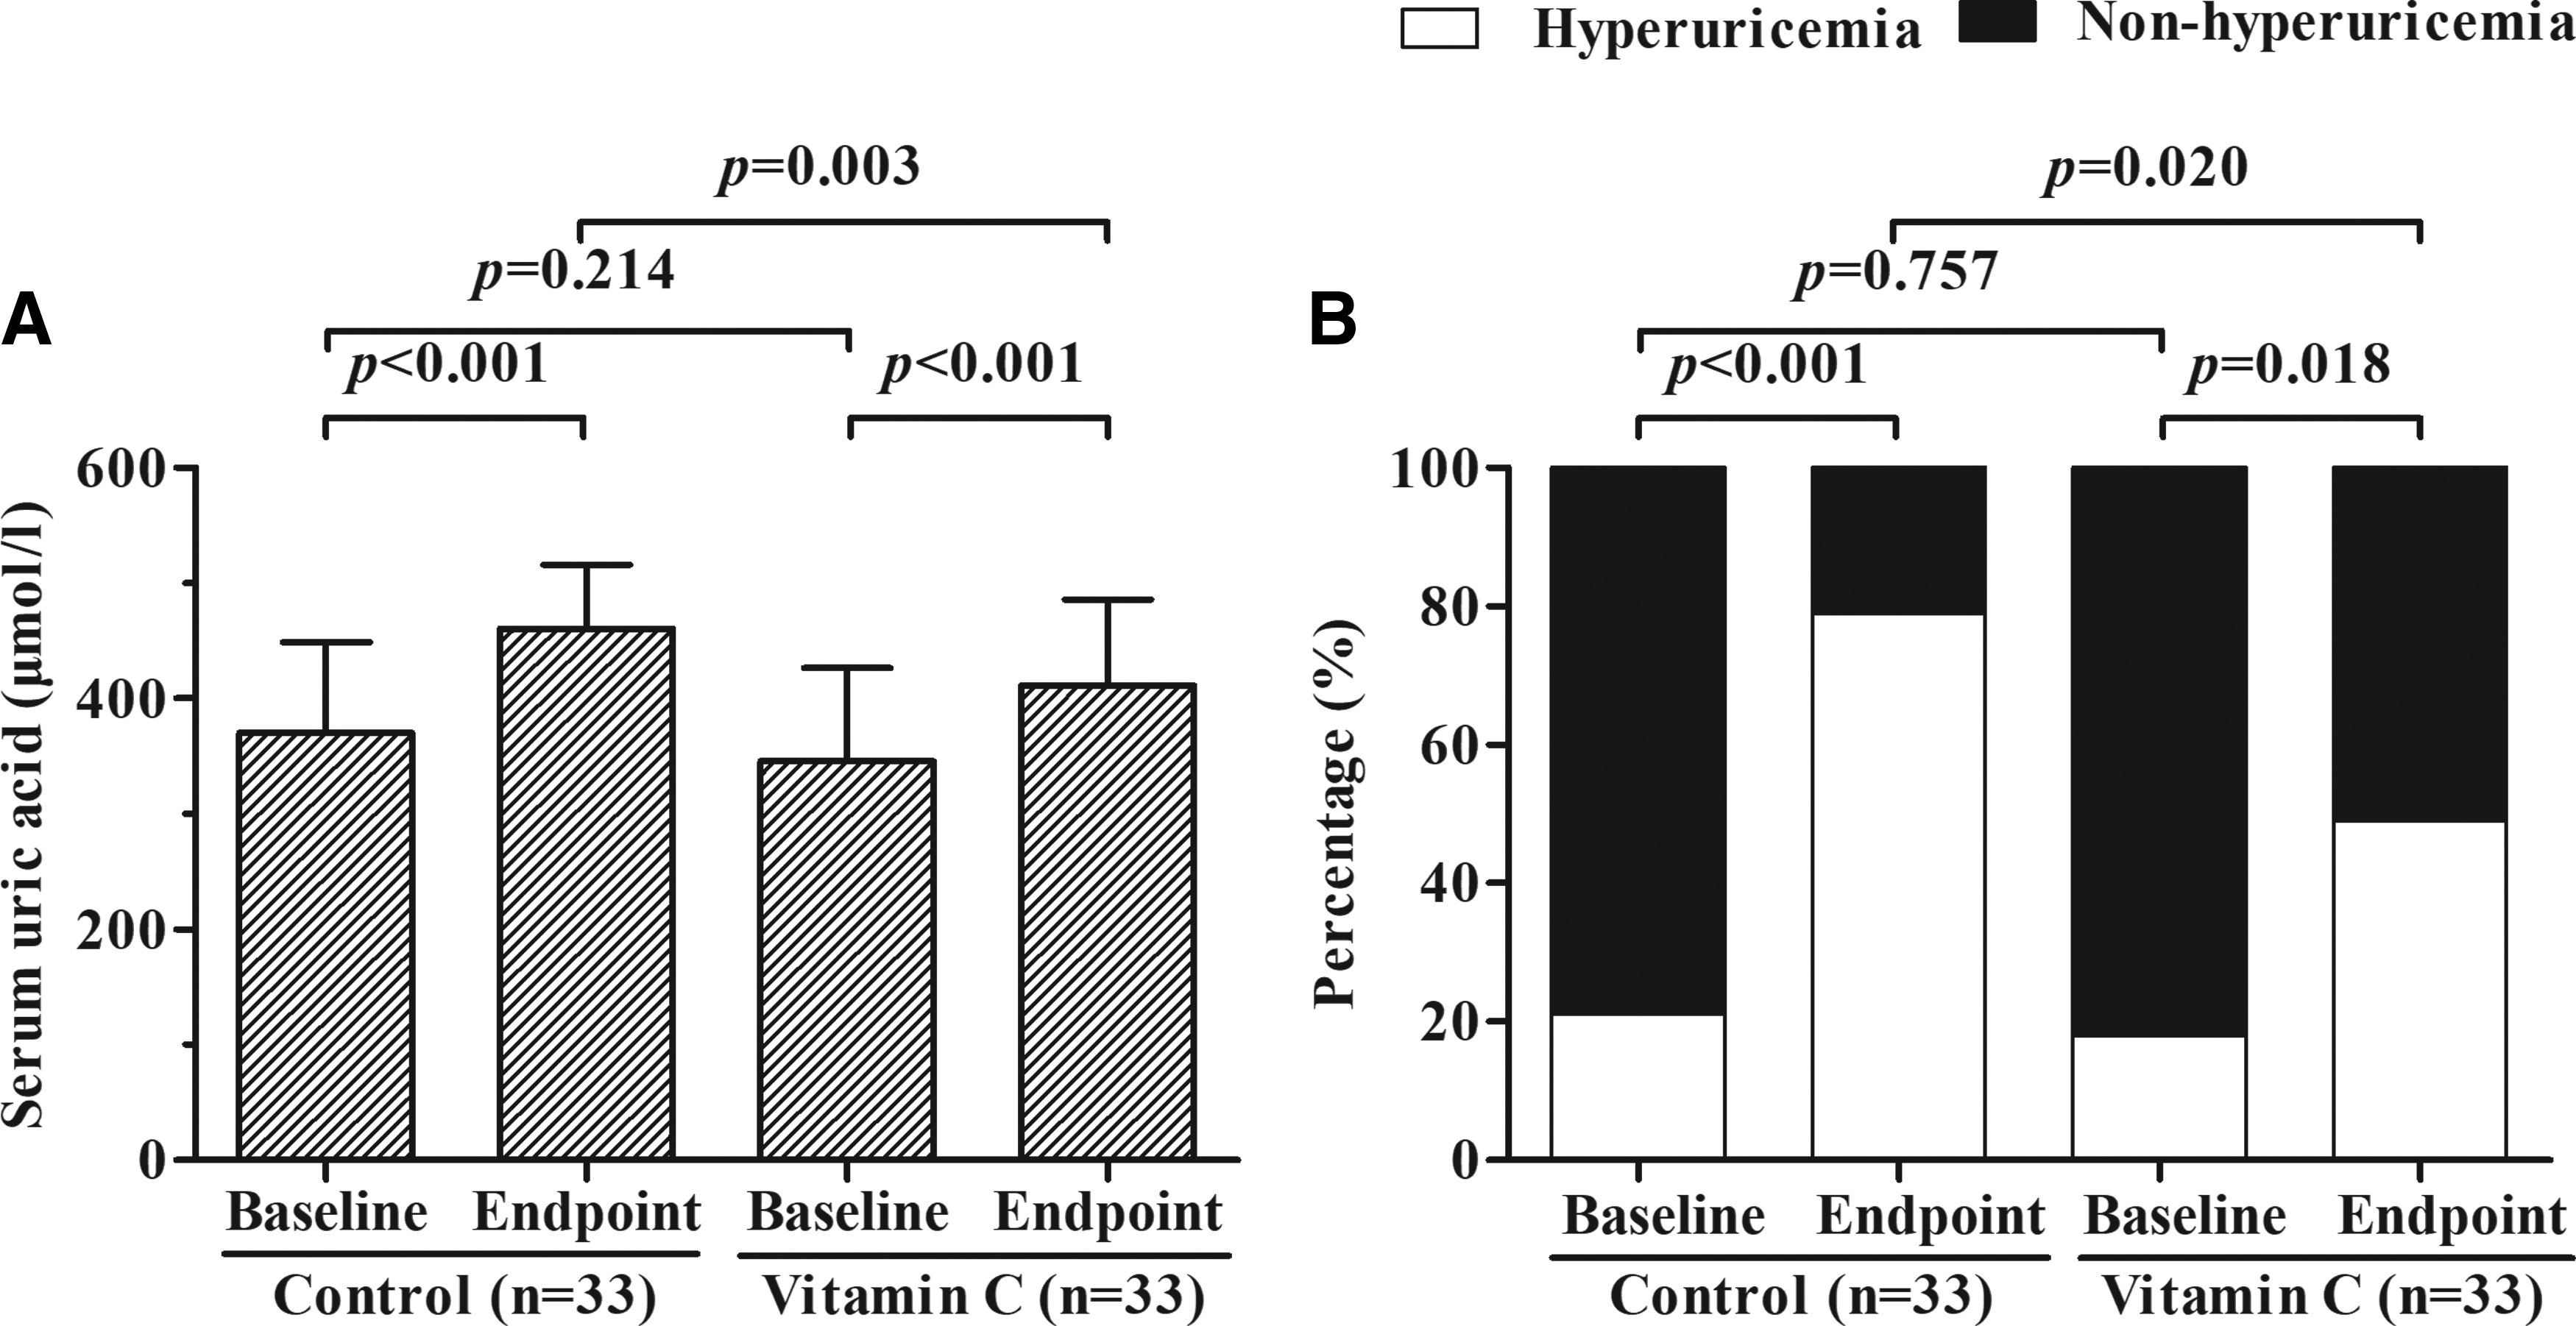
The effects of oral vitamin C on serum uric acid levels. The “Control” and “Vitamin C” labels in the figure represent the blank control group and the vitamin C group, respectively.
Comparison of the effects of vitamin C and vitamin E on high-altitude hyperuricemia (study II)
Study II was conducted to test the effects of two antioxidant vitamins (i.e., vitamin C and vitamin E) on high-altitude hyperuricemia. A total of 120 subjects were recruited, and 5 subjects were excluded according to the exclusion criteria. These subjects were studied under the same conditions as the study I subjects and their baseline levels of heart rate, systolic blood pressure, and SpO2 were similar to the study I subjects.
With the exception of age and SpO2, the baseline characteristics were similar in the vitamin C (n = 57) and vitamin E (n = 58) groups (Table 2). The mean levels of serum uric acid and the incidences of high-altitude hyperuricemia increased in both groups (Fig. 3A) that were similar to study I. At the end of study II, the mean serum uric acid level (435.1 ± 81.6 μmol/L vs. 407.3 ± 70.5 μmol/L, p = 0.053) (Fig. 3A) and the prevalence of high-altitude hyperuricemia (59.6% [95% CI: 46.9%–72.3%] vs. 43.1% [95% CI: 30.4%–55.8%], p = 0.076) (Fig. 3B) were both higher in the vitamin C group relative to the vitamin E group, but the differences were not statistically significant. This suggests that vitamin C and vitamin E at a dose of five times the recommended daily dietary allowance have similar effects on reducing high-altitude hyperuricemia.

Comparison of the effects of vitamin C and vitamin E supplementation on serum uric acid levels. The “Vitamin E” and “Vitamin C” labels in the figure represent the vitamin E group and the vitamin C group, respectively.
Data are presented as either percentage (%) or mean ± SD. The p-values compare the vitamin E group (n = 58) with the vitamin C group (n = 57) using either the Student's t-test or the chi-square test as appropriate.
The relationships between the changes of serum uric acid, creatinine, and blood urea nitrogen levels
At the end of 1 month, the mean levels of both serum creatinine (66.9 ± 8.0 μmol/L vs. 49.9 ± 9.2 μmol/L, p < 0.001) and blood urea nitrogen (4.8 ± 1.0 mmol/L vs. 4.0 ± 1.0 mmol/L, p < 0.001) in the whole cohort of study I subjects were significantly increased. At baseline, there was no significant difference in mean serum creatinine levels between the vitamin C and the blank control groups (50.7 ± 8.3 μmol/L vs. 49.1 ± 10.0 μmol/L, p = 0.482) (Table 1). At 1 month, there was a significant increase in the mean serum creatinine levels in both groups (p < 0.001 for all comparisons) (Fig. 4A), with a trend for a higher level in the blank control group (p = 0.058). Similarly, there was no difference in the mean baseline blood urea nitrogen level between the vitamin C and the control groups. There was also a significant but similar increase in blood urea nitrogen levels in both groups (p < 0.001) (Fig. 4B).

The changes in serum creatinine and blood urea nitrogen levels over 1 month. The “Control,” “Vitamin C,” and “Vitamin E” labels in the figure indicate the blank control group, the vitamin C group, and the vitamin E group, respectively.
At the end of study II, the levels of both serum creatinine and blood urea nitrogen increased significantly relative to baseline in both the vitamin C and vitamin E groups (p < 0.05 for all comparisons) (Fig. 4C, D). Both these increases were higher in the vitamin E group than in the vitamin C group (p < 0.05 for all comparisons) (Fig. 4C, D).
When the data from the two groups were combined, the individual changes in serum uric acid were positively correlated with the individual changes in both serum creatinine (r = 0.599, p < 0.001) (Fig. 5A) and blood urea nitrogen (r = 0.207, p = 0.005) (Fig. 5B) levels. These data raise the possibility that vitamin C might increase the renal excretion of uric acid.
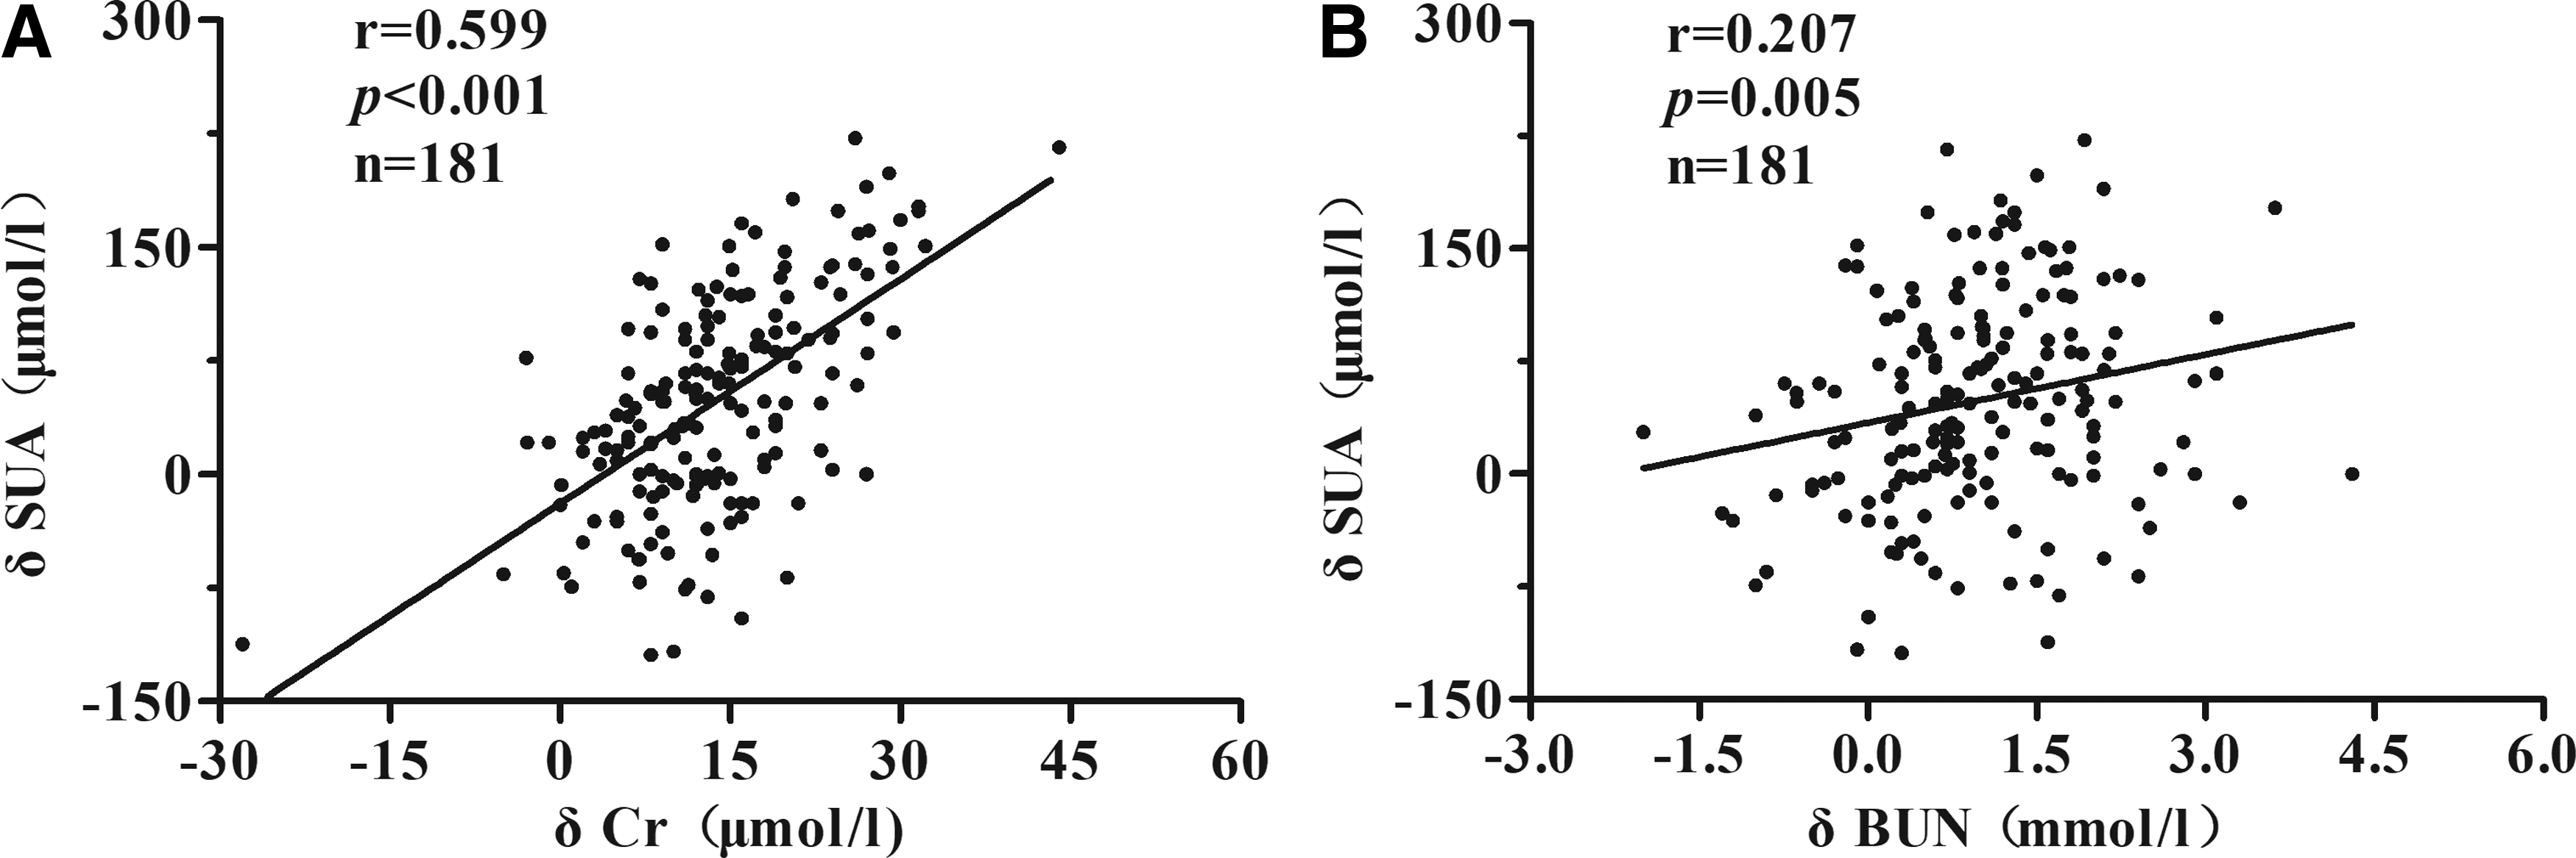
The relationships between the changes in serum uric acid levels and the changes in levels of serum creatinine and blood urea nitrogen. The δSUA, δCr, and δBUN labels indicate the changes in serum uric acid levels, serum creatinine levels, and blood urea nitrogen levels over 1 month, respectively.
Discussion
Travel to high-altitude areas for either work or leisure is now common and most people know about the problems with hypoxia that they will encounter. However, few people know about acute or chronic high-altitude hyperuricemia, both of which can lead to serious complications (Gupta et al., 2007; Feig et al., 2008; Handler, 2010; Zhu et al., 2011; Endocrinology and Metabolism Branch, 2013; Nakazawa et al., 2013).
Serum uric acid levels can be affected by multiple factors, such as genetics, smoking, body mass index, ethnicity, blood pressure, presence of gout, use of aspirin, high energy intake, alcohol, dairy protein, fructose, meat, seafood, coffee, and dietary magnesium (Gao et al., 2008; Wang et al., 2015). This heterogeneity creates a problem when carrying out interventional studies on serum uric acid levels, as responses may vary between subjects whose levels are regulated by different risk factors. The strength of our study is that we recruited a genetically homogeneous sample of healthy, young men and studied them in a homogeneous environment. Thus, the effects of vitamin C and high-altitude hypoxia on serum uric acid levels could be easily demonstrated with a modest sample size.
These subjects had been at high altitude for about 1 week before being recruited into the study. Both groups had a low SpO2 state (<94%) at the time of their baseline blood samples (65.2% of subjects in study I and 73.9% of subjects in study II) indicating that they had responded to tissue hypoxia. However, their serum uric acid levels were still similar to those found in a prior study of young men at low altitude (Zheng et al., 2013), indicating that altitude-induced changes in serum uric acid levels occur at a slower rate. However, we acknowledge that it would be better to take baseline blood samples while subjects are at low altitude in future studies. During the subsequent month of observation, the mean serum uric acid level of the blank control group increased by 90.6 μmol/L and the prevalence of hyperuricemia increased by 57.6%, indicating that high-altitude environment can significantly increase the level of serum uric acid over this time period. The lower increased frequency of hyperuricemia in the vitamin C supplemented group (35.6%) indicates that a worthwhile reduction in serum uric acid can be safely achieved. This is supported by the results of study II, which showed a similar reduction in the frequency of hyperuricemia in the vitamin C-treated group.
Hyperuricemia is usually caused by either excessive intake of exogenous purines, excessive production of endogenous purines, increased purine turnover, or reduced renal excretion. These mechanisms may all contribute to chronic hyperuricemia on the Tibetan Plateau. First, there is a high dietary intake of mutton and beef, which are very rich in purine. Second, high-altitude hypoxemia increases serum uric acid due to the degradation of adenosine triphosphate during the conversion of xanthine dehydrogenase to xanthine oxidase (Schoutsen et al., 1983; Brass et al., 1991; Braghiroli et al., 1993; Hooper et al., 1998). Third, the increased lactate generated by high-altitude hypoxia will compete with the excretion of urate at the proximal tubule, resulting in a decrease in urate clearance (Johnson et al., 2003). In addition, high uric acid levels could also result from hypoxia-induced polycythemia (Denman et al., 1966). In the present study of acute hyperuricemia, the cause of hyperuricemia is most likely to be excessive production of endogenous purine or uric acid and the reduction of urate acid excretion. Our data also show that the changes in serum uric acid levels are positively correlated with both the changes in serum creatinine and blood urea nitrogen levels, suggesting that high-altitude hyperuricemia might result from the reduction of urate excretion. Although the level of lactate could not be measured due to the limitation of medical conditions, it was reported that the increase of lactate could have significant effects on the fractional clearance of uric acid (Burch and Kurke, 1968; Yamamoto et al., 1993), which might suggest that there was the potential connection among hypoxia, lactate, and hyperuricemia. In addition, the incidence of hyperuricemia in the blank control group was 21.2% at the baseline, which was consistent with the data from a low-altitude population (Endocrinology and Metabolism Branch, 2013), whereas the incidence of hyperuricemia was sharply increased to 78.8% after 1 month, which was higher than in previously published data from Tibetans (Chen et al., 2011). It was thought that the difference with Tibetans might be mainly due to genetic adaptation to high altitude (Arestegui et al., 2011). It is also of note that the healthy lifestyle of our subjects, which included vigorous exercise without cigarettes or alcohol, was not sufficient to prevent high-altitude hyperuricemia, indicating the dominant roles played by hypoxia and decreased urate clearance.
There are several possible mechanisms by which vitamin C might reduce serum uric acid levels. Vitamin C is an antioxidant that can decrease free radical-induced damage to body cells (Frei et al., 1989), and thus reduce serum uric acid production (Gao et al., 2008). In support of this, it has been reported that serum vitamin C concentrations are reduced in high-altitude relative to low-altitude populations and this is associated with high concentrations of serum-free radicals (Sinha et al., 2009). The degradation of adenosine into uric acid is also accompanied by free radical production (Waring et al., 2000). Therefore, we speculate that elevated uric acid levels are the result of the adaptive response to hypoxia, and large doses of vitamin C can supplement the depleted antioxidants status in vivo and neutralize free radicals to reduce uric acid production. It has also been suggested that the major target organ of vitamin C is the kidney (Stein et al., 1976; Berger et al., 1977; Frei et al., 1989; Enomoto et al., 2002; Chade et al., 2003; Huang et al., 2005; Tian et al., 2005; Schaufele et al., 2006; Thangaraju et al., 2006; Dehghan et al., 2008). Vitamin C can competitively inhibit an anion exchange transport system at the proximal tubule in the nephron, resulting in increasing renal fractional clearance of uric acid (Stein et al., 1976; Huang et al., 2005). Furthermore, vitamin C can act specifically at uric acid reabsorption sites in the apical brush border of the proximal tubule, such as urate transporter 1 (URAT1) and the sodium-dependent anion cotransporter, SLC5A8/A12 (Enomoto et al., 2002; Thangaraju et al., 2006; Dehghan et al., 2008; Baillie et al., 2009). Vitamin C also increases the glomerular filtration rate by reducing glomerular microvascular ischemia and increasing dilatation of afferent arterioles (Chade et al., 2003; Huang et al., 2005; Tian et al., 2005; Schaufele et al., 2006).
It has also been suggested that vitamin E supplementation could increase urinary uric acid excretion and reduce serum uric acid levels (Seifi et al., 2011). Vitamin E is concentrated in the lipid regions of cellular membranes and protects these lipids by interrupting free radical reactions that otherwise lead to membrane damage (Meydani, 2000). Moreover, vitamin E, as a highly efficient lipid antioxidant, can improve the activity of antioxidative enzymes (i.e., catalase and GSHPx) that scavenge oxygen-free radicals (Garg et al., 2005) and inhibit xanthine oxidase-induced urate synthesis (Chow, 1991; Shaheen et al., 1996). This interaction results in an increased serum vitamin C level after vitamin E supplementation (Hamilton et al., 2000). This might explain why vitamin E supplementation tended to produce lower serum uric acid levels than vitamin C supplementation in our study.
Vitamin C supplementation is usually safe and only produces side effects such osmotic diarrhea, gastrointestinal disturbance, and calcium oxalate nephrolithiasis if intake exceeds 2000 mg/d (Juraschek et al., 2011). However, vitamin E can act as an anticoagulant and increases the risk of bleeding, especially when acting synergistically with the blood thinner, warfarin. Supplementation with vitamin E is also contraindicated during chemotherapy and radiotherapy. Long-term use of high doses also causes nausea, diarrhea, and impaired vision. In conclusion, vitamin C intake is safer than vitamin E.
In summary, our study suggests that oral vitamin C supplementation is a safe, effective, and inexpensive method to prevent high-altitude hyperuricemia. Although we did not show dose-dependent effects of vitamin C in our study, the doses used are safe and should be acceptable for most people. After all, this is the first description of a role for vitamin C in high-altitude hyperuricemia. In addition, our study raises the possibility that vitamin C may be useful for treating other causes of acute hyperuricemia, such as pyrazinamide-induced hyperuricemia. The main limitation of our study is that all the subjects were healthy young physically active men. There were also some parameters (e.g., HCT, proteinuria) not to be measured due to the distance from the camp to the test site. Large randomized placebo-controlled studies are required to confirm and extend the results of our study.
Footnotes
Acknowledgments
The authors express sincere thanks to all subjects in this study, and also to Prof. Hong Wang from Department of Geriatrics, Prof. Guili Xu and Jianchang He from Department of Pharmacy in Kunming General Hospital for the suggestion during the project design. The authors also thank Dr. William Abbott from Auckland District Health Board, New Zealand, for the article revision. This work was supported by the 18th Yunnan province cultivation project of the skilled personnel and the Logistics Science Project of PLA (CCD14C004).
Authors' Contributions
Study concept and design were carried out by S.M.; acquisition of the data was done by D.F., Y.W., Z.D., R.L., J.C., and A.W.; analysis of the data was carried out by H.P. and S.M.; drafting of the article was by H.P., S.M., and L.Z.; and critical revision of the article was carried out by H.P., S.M., Q.C., and L.Z.. All authors read and approved the final article.
Author Disclosure Statement
No competing financial interests exist.