
Abstract
Background:
Body position alters aspects of pulmonary function in health and disease. Although studies have assessed positional effects on the heart and lungs, little is known about positional changes in gas exchange parameters at high altitude. We hypothesized that following ascent, supine positioning would cause lower oxygen saturation than sitting, partially due to decreased ventilation and increased partial pressure of end-tidal carbon dioxide (P
Materials and Methods:
Twenty-eight healthy subjects were studied at sea level and following gradual ascent to 5150 m. After 10 minutes of sitting rest, subjects were studied for 5 minutes each in the sitting, supine, and prone positions with the order randomly assigned. Pulse oximeter oxygen saturation (SpO2), minute ventilation (VE), end-tidal O2 (P
Results:
At high altitude, VE was not affected by body position (12.96 ± 3.09 and 11.54 ± 3.45 L/min in the sitting and supine positions, respectively, p = 0.255). P
Conclusions:
These results extend earlier low-altitude studies and demonstrate the importance of postural regulation in different environments. As 79% of subjects had lower SpO2 while supine than sitting, control of body position is necessary for SpO2 comparisons at altitude to be meaningful.
Introduction
With a growing number of people ascending to high altitude, the risks of high-altitude illness affect an increasingly large population. Much research has been directed to understanding and preventing altitude illness. Changes in oxygen saturation typically accompany acclimatization to altitude in healthy individuals. Although shifts in blood oxygen levels are central to the development of altitude illness, considerable variability exists among these healthy individuals at any given altitude, and lively debate surrounds the issue of whether oxygen saturation predicts the onset of illness (Luks and Swenson, 2011; Basnyat, 2014; Windsor and Rodway, 2014; Leichtfried et al., 2016). Incidental observations on previous expeditions of marked changes in arterial oxygen saturations with posture prompted the current study.
More than a 100 years ago, investigators became interested in cardiac and respiratory changes accompanying body position changes from supine to upright (Liljestrand and Wollin, 1913, 1914), although the precise mechanisms were elusive (Lindhard, 1913; Turner, 1927). More recent low-altitude studies found changes in ventilatory control, dead space, functional residual capacity, and ventilation-perfusion matching (VA/Q) in the lungs (Liljestrand and Wollin, 1913; Bjurstedt et al., 1962; Barr, 1963; Anthonisen et al., 1965; Yoshizaki et al., 1998). A decrease in cardiac output in the upright position compared with the supine position has been observed in many, but not all, studies (McMichael and Sharpey-Schafer, 1944; McGregor et al., 1961; Thomas and Shillingford, 1965; Rodeheffer et al., 1986; Harms et al., 2003). These cardiac output changes would be expected to alter ventilation-perfusion matching in the lungs (Gisolf et al., 2004). Surprisingly, these positional changes in respiratory parameters and gas exchange found at low altitude have not been studied in people traveling from low to high altitude.
To systematically study positional saturation changes at high altitude, we conducted a randomized prospective study to explore the effect of different body positions on arterial pulse oximeter oxygen saturation (SpO2) and to determine the extent to which changes in ventilation could account for any observed saturation changes. We hypothesized that SpO2 would be higher in the upright compared with the supine position, due in part to changes in ventilation and end-tidal carbon dioxide (P
Materials and Methods
Subjects
This study was conducted in conjunction with the 2015 Medical Expeditions medical research trip to the Manaslu region in Nepal in March to April 2015. Subjects were self-selected, but all those participating in the expedition were invited to participate. Thirty-five adult subjects were initially enrolled. Due to time constraints at altitude, only 28 subjects (18 males and 10 females) could complete all study procedures at both sea level and at high altitude. Unless otherwise indicated, the results presented are from these 28 subjects.
We included subjects over a wide range of ages, ranging from 21 to 69 years, with a mean age of 39 ± 15 years (mean ± standard deviation [SD]) and body mass index of 22.5 ± 3.8 kg/m2. All subjects were white, non-Hispanic Westerners, and were healthy with no active medical problems that would be expected to influence these findings. None of the participants were smokers, none had been to high altitude in the month preceding this expedition, and none were taking medications (such as acetazolamide or dexamethasone) for acute mountain sickness (AMS). All subjects were physically active adults, but none were members of any national or Olympic teams. The Wales Research Ethics Committee 5, Bangor, Wales, United Kingdom, approved the study and all subjects signed a written informed consent before undergoing any study procedures.
Experimental design
Data were collected at both sea level and 5150 m. Sea level data were collected at Bangor University, Bangor, Wales, United Kingdom, ∼1 month before the expedition. Subjects flew to Kathmandu (1370 m) and after several days at 1370 m went by bus to starting point for the trek at ∼500 m. Over the next 2–3 weeks, subjects trekked to the research base camp at 5150 m where all high-altitude data were collected (Fig. 1). Twenty-three of the 28 subjects took 18 days for the ascent to base camp, 4 subjects took 16 days, while 1 subject made the ascent in 12 days.
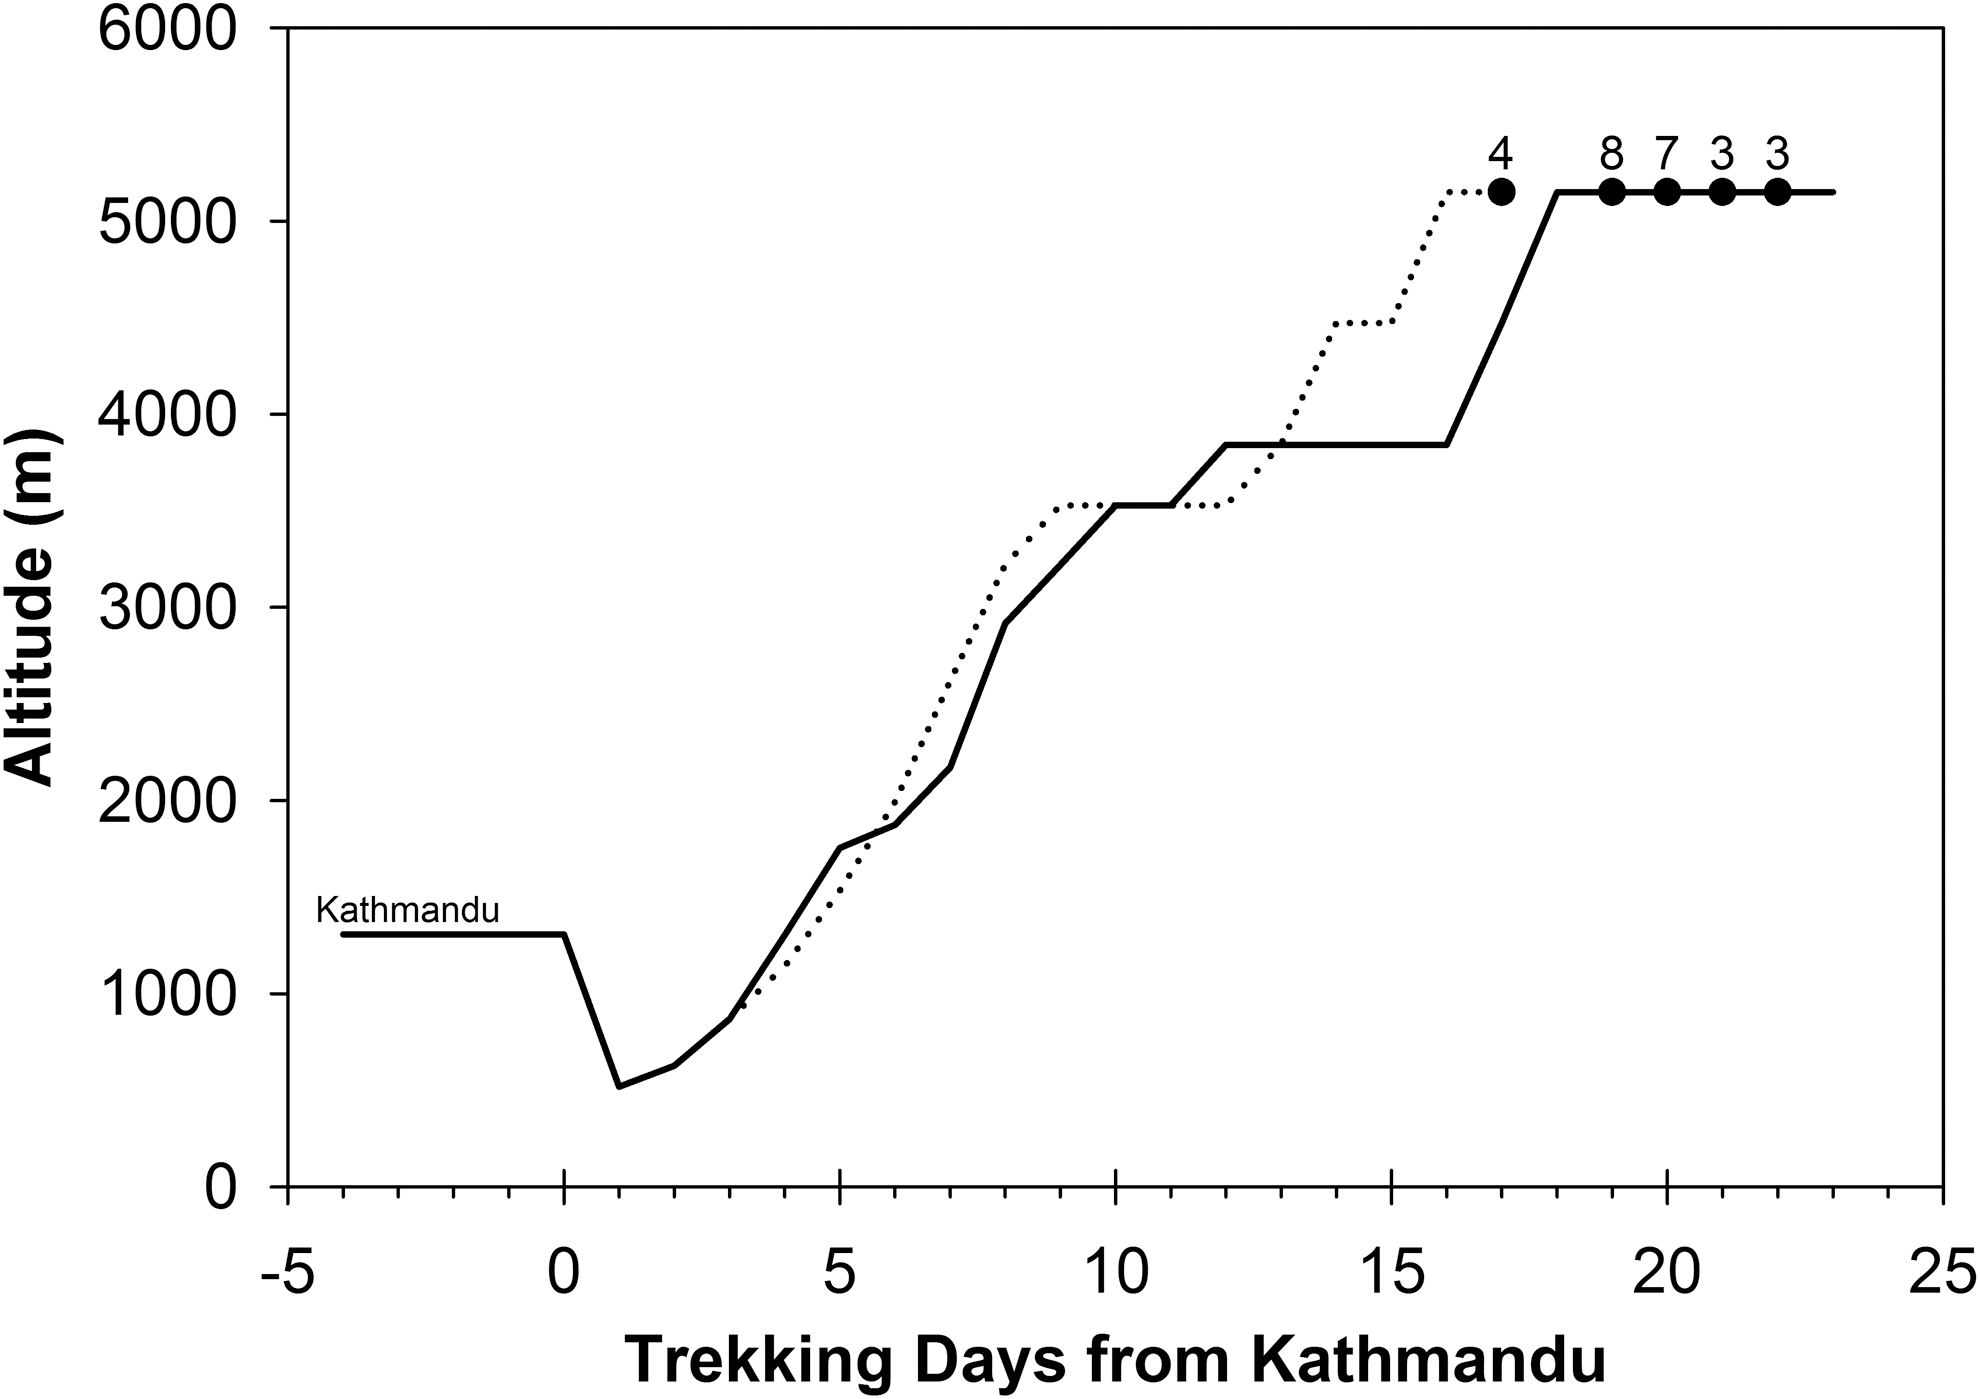
Ascent profile from Kathmandu to the research base camp at 5150 m. The filled circles are the times when the study was performed. The small numbers above the filled circles are the number of subjects tested at that point in time. Most subjects followed the profile shown in the solid line, but four subjects had a more rapid ascent (dotted line). One study subject with a fast ascent of 12 days is not shown.
Study procedures
At both sea level and high altitude, subjects were asked to sit quietly for an initial 10 minutes of resting period. This was followed by 5 minutes each in the supine, sitting, and prone positions with no break between positions. The sequence of body positions was randomly assigned for each subject during each testing session.
Minute ventilation (VE) and end-tidal gas concentrations were measured using a portable metabolic system (K4b2; COSMED USA, Concord, CA). Before testing each subject, calibration of the equipment was undertaken. The K4b2 device was calibrated with a 3.0 L calibration syringe and calibration gases (16.95% O2, 5.05% CO2 at sea level, and 16% O2, 5% CO2 at high altitude). Calibration was performed immediately before each subject was tested. SpO2 was recorded continuously by pulse oximeter (Masimo Rad-57™; Masimo Corp., Irvine, CA). As provided by the manufacturer, the Masimo Rad-57 pulse oximeter has a range of 0%–100% saturation. The arterial oxygen saturation accuracy is ±3% at saturations of 60%–80% and ±2 at higher saturations. It can operate at temperatures of −18°C to +54°C and at altitudes of −304 to 5486 m. Barometric pressure at the 5150 m base camp was 412 ± 1 mm Hg.
The initial 10 minutes of sitting position ensured subjects had rested and any previous activity did not affect results. During this time, all equipments were in position and data were also collected. No verbal communication was permitted by the subject who was instructed to remain at rest, aiming for normal breathing for that individual. We ensured that the participant did not fall asleep during testing.
The subjects were subsequently asked to assume the different body positions, with assistance being given to move the equipment (saturation probe, heart rate monitor, and K4b2 recorder). In previous studies, 5 minutes of duration had a similar effect on alveolar partial pressure of CO2 (P
At sea level, all recordings were performed in a quiet laboratory room, and at altitude, studies were performed inside a tent to eliminate excess ambient light, which could introduce inaccuracies in pulse oximetry measurements. All subjects wore adequate clothing to ensure warmth and, if necessary, wore a glove over the hand from which oximetry measurements were recorded.
At 5150 m altitude, 13 of the 28 subjects also underwent supine echocardiography and 12 of those 13 subjects additionally had lung ultrasound assessments of extravascular lung water (lung comets, or B-lines) as part of an unrelated study. Pulmonary artery systolic pressure (PASP) was estimated from the maximal velocity of the tricuspid regurgitation jet. Standard echocardiographic techniques were utilized, and all echocardiographic measurements were performed after the study by an investigator blinded to study conditions (Rudski et al., 2010). No upright or prone echocardiographic data were performed. Lung ultrasound assessments were also performed as previously described by one of the current investigators (S.V.) and others (Picano et al., 2006; Bouzat et al., 2013).
The Lake Louise mountain sickness score was used to assess AMS. AMS scores were recorded for each subject every morning throughout the trek and time at base camp. AMS was defined as a headache score of at least 1 point with a total AMS score of 3 or more, not including the assessment of any sleep disturbances (Roach et al., 2018).
Data analysis
All data were downloaded from the K4b2 device, and the pulse oximeter data were backed up to a computer for offline analysis after return to low altitude. For each subject, saturation data and other respiratory parameters were averaged for 3–4 minutes and 4–5 minutes for each body position at each altitude (i.e., 4 and 5 minutes of each stage). There were no significant differences between minute 4 compared with minute 5 data for heart rate, oxygen consumption (VO2), and carbon dioxide production (VCO2) at either altitude, suggesting that subjects were in steady state during minute 5. Given these findings, we report only data from the last minute of each stage. Calculated arterial PCO2 (PaCO2) was calculated from the end-tidal P
Statistical analysis
Our main interest was in the positional saturation differences rather than the well-known differences in saturation between sea level and high altitude. For each altitude studied, data were first assessed by normality with the Shapiro–Wilk test. Those variables passing the Shapiro–Wilk test were analyzed by repeated-measures analysis of variance (RM-ANOVA). For the RM-ANOVA, if sphericity was not confirmed by the Mauchly test, p-values from the test for the overall significance were corrected using the Huynh–Felt correction. The Friedman analysis of variance on ranks was used for non-normally distributed data. If the initial ANOVA (or Friedman test) revealed a significant main effect, subsequent post hoc tests were performed using the Holm adjustment of the p-values for multiple comparisons. All statistical comparisons were two-sided. Statistical analysis was performed using R software, version 3.6.1, and SigmaPlot® v13.0. Data are reported as mean ± SD. A p-value ≤0.05 was considered significant.
Results
Sea level
At sea level, respiratory rate and VE were significantly lower in the supine position compared with the sitting position, whereas P
Positional Effects on Cardiorespiratory Parameters at Sea Level
Values are mean ± SD. n = 28 for all other comparisons, except for SpO2 where n = 27. PaCO2 calculated, see Data analysis for details. Sit → Sup, Sit → Pro, and Sup → Pro are the Holm adjusted significance for changes between sitting, supine, and prone positions.
Indicates normality not confirmed by the Shapiro–Wilk test, Friedman nonparametric test on ranks used instead. All other cases used repeated-measures analysis of variance to assess overall significance.
HR, heart rate; PaCO2, calculated arterial PCO2; P
High altitude
At altitude, respiratory rate, tidal volume (VT), VE, VA, VO2, and VCO2 were unaffected by body position (Table 2). P
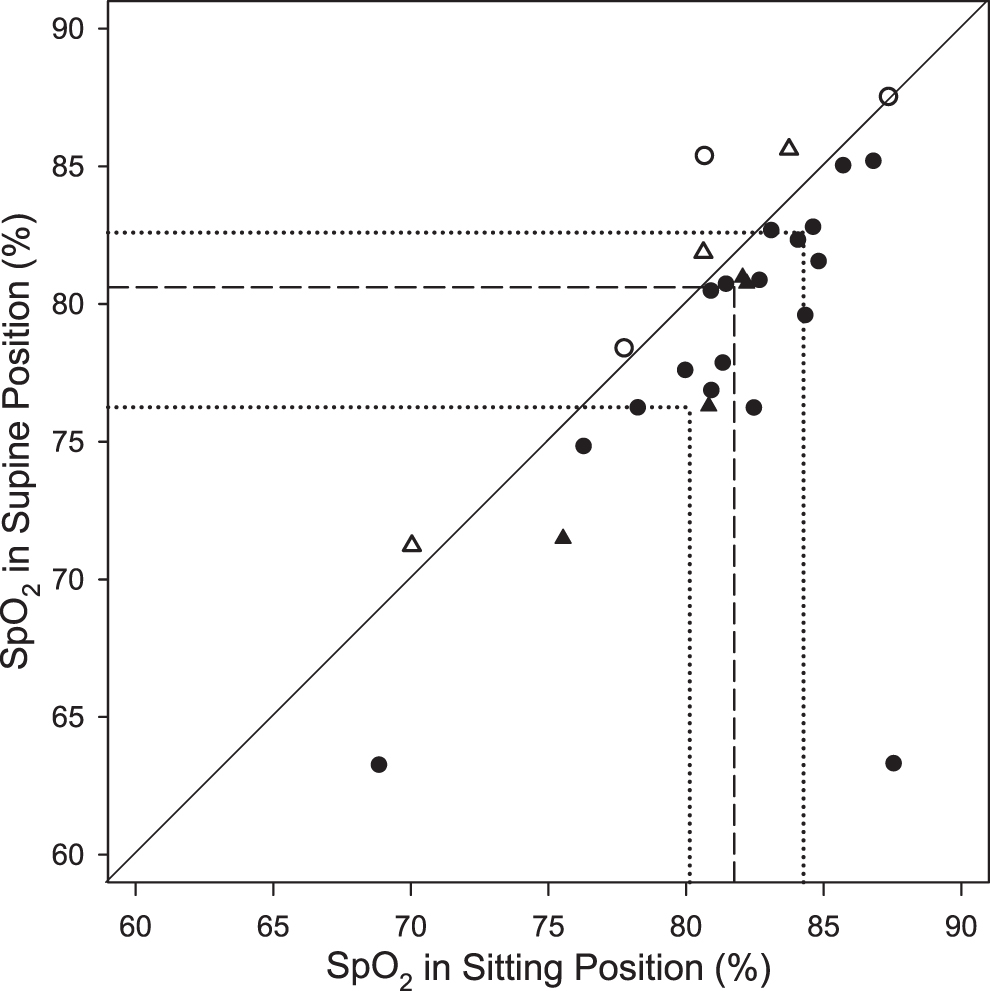
Individual SpO2 values in the sitting position versus the supine position at 5150 m. The solid diagonal reference line is the line of identity, showing no positional differences in SpO2. The circles are subjects without AMS when tested. The triangles are subjects with AMS when tested. Circles and triangles below the diagonal reference line indicate cases in which SpO2 was lower in the supine position than in the sitting position. The dotted lines show the 25th and 75th percentiles of the data, while the dashed line represents the median. AMS, acute mountain sickness; SpO2, oxygen saturation as measured by pulse oximetry.

Individual SpO2 changes in the sitting and the supine positions at 5150 m. ††Indicates significant difference from the sitting position, p = 0.025 (corrected for multiple comparisons). Filled circles are the subjects without AMS when tested, open triangles are those with AMS when tested.
Positional Effects on Cardiorespiratory Parameters at 5150 m
Values are mean ± SD. n = 27 for all comparisons except for SpO2 where n = 28. PaCO2 calculated, see Data analysis for details.
Indicates normality not confirmed by Shapiro-Wilk test, Friedman nonparametric test on ranks used instead. All other cases used repeated-measures analysis of variance to assess overall significance.
Twenty-two of the 28 subjects (79%) had a lower oxygen saturation in the supine position compared with the sitting position. The mean difference in SpO2 in the sitting position versus the supine position was −2.5% (95% confidence interval [CI] −0.6 to −4.4, p = 0.012). One subject (#8) had a large decrease in SpO2 from 88% sitting to 63% while supine. The explanation for the very low SpO2 in the supine position is unclear as this individual was otherwise healthy, without evidence of altitude illness. Removing this “outlier” did not alter the overall significance of the SpO2 changes for the group (mean SpO2 difference in sitting vs. supine positions was: −1.6%, 95% CI −0.6 to −2.6, p = 0.002). For the entire group (n = 28), 11 subjects (39%) had 2% or greater absolute difference in SpO2 in the two positions and 9 subjects (32%) had a 3% or larger absolute difference in SpO2.
There were no differences in the positional SpO2 responses among the males compared with the females. Excluding subject #8, the difference in SpO2 in the sitting position versus the supine position was −1.7% ± 2.4% for males and −1.5% ± 2.6% for the females (p = 0.80). For all subjects, age affected the positional differences in sitting versus supine SpO2, with older age associated with larger positional differences (r = 0.52, p = 0.005), but BMI was not correlated with positional SpO2 differences (p = 0.85). Inspiratory time (TI) and total breath times (TTot) were measured in the different body positions. There were no significant effects of body position on TI, TTot, or TI/TTot (data not shown).
Of the 13 subjects with PASP measurements at 5150 m, there was no correlation between positional saturation changes, sitting to supine, and PASP (r = 0.0, p = 0.98). Similarly, in the 12 subjects with ultrasound assessment of lung water, there was no correlation between the number of B-lines and the sitting to supine positional saturation changes (r = 0.09, p = 0.77).
Relation to AMS
Most subjects developed mild AMS at some point during the trek to base camp, but only 7 of the 28 subjects had AMS on the day they participated in this study. SpO2 values were not significantly different in those with versus those without AMS. Similarly, after excluding subject #8, the sitting to supine positional SpO2 changes were the same in those with versus those without AMS (1.0% ± 2.6% vs. 1.8% ± 2.4%, p = 0.38, respectively).
Discussion
Oxygen saturation measurements at high altitude are simple and take only a brief amount of time. Despite the wide individual variability and debate about the value of such assessments, many groups at altitude routinely perform SpO2 measurements. One easily controlled source of variability is body position when the measurements are made. We sought to systematically study positional oxygen saturation changes and found small but significant changes in SpO2 when body position shifted from upright to supine or from upright to prone. We found that 79% of our subjects had lower oxygen saturation when supine (or when prone) compared with sitting saturation values. Contrary to our original hypothesis, changes in VE and alveolar ventilation did not correlate with the saturation changes we observed.
Numerous studies have reported SpO2 at high altitude, but very few report the body position when the measurements were obtained, and even fewer have compared SpO2 values in different positions. Oxygen saturation at high altitude was recently reviewed by Luks and Swenson (2011), but no mention is made of positional changes in saturation. In an earlier study (performed for other reasons), we observed frequent small positional differences in SpO2 along with one asymptomatic individual with normal upright saturation but marked desaturation when supine at 4342 m (Patel et al., 2013). Hultgren (1997) briefly mentions positional saturation changes in 10 healthy subjects at 3730 m but gives no details about the procedures used to obtain the data. Ward et al. (1968) studied seven asymptomatic patients (mean age 54 years) with polycythemia, but normal lung function, in Denver, CO (1609 m), and found lower arterial partial pressure of oxygen (PaO2) and arterial oxygen saturation (SaO2) values in the supine position compared with the sitting position. Recently, 50 native Peruvian highlanders were studied at 3800 m and found to have ∼1.0% higher SpO2 in the upright-seated position compared with the supine position in subjects aged 62.8 ± 11.4 years (Arias et al., 2019), suggesting that positional changes may occur even in fully acclimatized individuals.
Potential mechanisms for our findings
In a field study such as this study, it is impossible to determine all the mechanisms for our findings. Initially, we thought changes in alveolar ventilation would explain much of the observed positional changes. However, the results do not support our original hypothesis as no significant positional changes in VE or VA were observed. P
Others have found increased tidal volume (VT) during passive head-up tilting or standing (Chang et al., 2005). We did not observe changes in VT, possibly because our subjects were seated during the upright portion of our study, thus conceivably causing increased abdominal pressure on the diaphragm limiting changes in VT.
Excess fluid in the lungs might alter SpO2. To address this possibility, we were fortunate that lung ultrasonography and cardiac echocardiography were performed in a subset of our subjects for an unrelated project. Ultrasonography has shown utility for detection of increased lung water in a number of previous studies (Fagenholz et al., 2007; Pratali et al., 2010; Agostoni et al., 2013; Bouzat et al., 2013; Wimalasena et al., 2013). In the 12 subjects who had lung comets assessed at 5150 m, there was no correlation between these lung comets and the positional SpO2 changes. Nearly all our subjects had a slow ascent, which is known to mitigate increases in lung fluid (Taylor et al., 2017). These findings make increased lung water an unlikely explanation for the positional saturation differences we observed. Similarly, no correlation was found between PASP and positional SpO2 changes, suggesting that differences in hypoxic pulmonary vasoconstriction did not account for interindividual differences in positional SpO2 changes.
Supine versus prone
Unlike the wide body of clinical literature showing improved oxygen saturation in the prone position compared with the supine position, for example, in patients with acute respiratory distress syndrome (Guerin et al., 2013; Munshi et al., 2017), we observed no difference between SpO2 in the prone position compared with the supine position, either at sea level or at high altitude. Lack of any significant oxygen saturation change in the supine position compared with the prone position may seem odd given the extensive intensive care unit literature in patients with lung injury (Guerin et al., 2013; Fan et al., 2017; Scholten et al., 2017). These differences likely relate to the differences between injured lungs compared with normal acclimatized lungs at high altitude, without evidence of pulmonary edema.
One of our subjects had a marked fall in SpO2 in the supine position compared with the sitting position. This subject had a fall in SpO2 of 24% (Fig. 2) but did not have an unusually high number of lung comets (9 vs. median value of 8.5 for the 12 subjects studied). This individual was healthy and asymptomatic. Since all data were analyzed after the trek, there was no opportunity to restudy this individual while at high altitude. Elimination of this one outlier does not alter the major findings or statistical significance of our results.
We used standardized procedures for continuously measuring and recording pulse oximetry saturation, as recently recommended (Tannheimer and Lechner, 2019). SpO2 measurements can be affected by ambient light and finger blood flow, especially in the cold environment at high altitude. All SpO2 measurements were made inside a tent to reduce ambient light exposure that might contaminate the SpO2 signal and subjects wore sufficient clothing to ensure their warmth and limit hypoperfusion of the digit. Additionally, we asked subjects to remain awake throughout the testing session and to not talk since both sleep and talking alter SpO2 at altitude.
Limitations
A few limitations of this study should be mentioned. Of the 28 subjects in our study, 9 (32%) subjects had AMS at the time they were studied at 5050 m. None of the subjects had severe AMS or high-altitude pulmonary edema. It is possible that results would be different in less acclimatized subjects. Additionally, due to time constraints, it was not possible to study our subjects at intermediate altitudes during the ascent.
All subjects were healthy with no known heart or lung disease, but pulmonary function testing such as spirometry or diffusing capacity was not performed. Unfortunately, echocardiographic data were obtained only in the supine position so positional effects on cardiac output could not be determined.
The 3.0 L volume calibration syringe used for calibrating the COSMED K4b2 at high altitude was the same syringe used for the low-altitude studies, so we feel confident that the VE data from both altitudes is reliable. We were unable to obtain certified calibration gases in Nepal. As a result, the CO2 and O2 calibration gas mixtures used at altitude were not the same as the high precision-certified gases used at sea level, and we had no independent method to verify the contents of the gas cylinders, thus limiting the ability to make direct comparisons from the sea level studies to the high-altitude studies. Despite this issue, the K4b2 was calibrated with these gases before each individual test. Since subjects served as their own controls, we believe that the positional changes in P
Sea level studies have used a variety of methodologies including comparisons of standing versus supine or passively moving subjects from one position to the next. We arbitrarily chose to use the sitting position for upright testing, to help ensure subjects could be in a resting, nonactive, comfortable position. The luxury of passively moving subjects to different positions was unavailable in the remote area of Nepal where the altitude studies were performed. The active change in body position by the subjects undoubtedly lengthened the amount of time required to attain a new steady state. To minimize these effects, we chose to report only the data from the last full minute of collection before the subject moving to a new position.
Conclusions
At high altitude, SpO2 is lower in both the supine and the prone positions than in the sitting position in over three-fourths of individuals. SpO2 was unchanged in the prone position compared with the supine position. These positional changes in SpO2 did not result from changes in ventilation but likely reflect alterations in ventilation-perfusion matching.
Footnotes
Acknowledgments
We would like to thank the volunteers in the Medex 2015 expedition who made this study possible. We would also like to thank Claire Maufrais and Guillaume Walther for technical assistance in obtaining echocardiographic measurements.
Authors' Contributions
J.D.A.: study design. A.K., B.M., S.V., J.D.A.: performed all data collection. J.D.A.: data analysis. A.K.: drafted article. A.K., B.M., S.V., J.D.A.: edited and revised article. All authors reviewed and approved the final version of the article.
Author Disclosure Statement
The authors have no disclosures to report.
Funding Information
No funding was received for this article.