
Abstract
Moore, G.W.K., Paolo Cristofanelli, Paolo Bonasoni, Gian Pietro Verza, and J.L. Semple. Was an avalanche swarm responsible for the devastation at Mount Everest Base Camp during the April 2015 Nepal earthquake? High Alt Med Biol. 21:352–359, 2020.
Introduction:
An avalanche triggered by an earthquake on April 25, 2015, struck the Mount Everest Base Camp (EBC) resulting in 15 deaths and over 70 injuries. Despite the common occurrence of avalanches in this region, little is known about their intensity and the stability of the glaciers that ring the Mount Everest massif. Here we present unique observations from a nearby automatic weather station (AWS) in the minutes just after the earthquake.
Methods:
Several (AWS) were deployed along the Khumbu Valley in Nepal. The site at Kala Patthar (elevation 5,613 m asl) 3.5 km from EBC and 4 km from the col along the ridge between Pumori and Lingtren was active from 2010 to 2015 and recorded temperature, relative humidity, pressure, solar radiation, and wind speed and direction.
Results:
The sequence of wind direction anomalies indicated that multiple air blasts passed the AWS, each associated with a distinct avalanche source, suggesting that earthquake likely caused a number of distinct avalanches from different source regions along this ridge.
Discussion:
Results suggest that a swarm of avalanches collectively lead to the death and destruction at EBC, suggesting the need for improvement in our understanding of avalanches in the region as well as in our ability to model and forecast such events.
Introduction
At 11:56
Both the 2014 and 2015 avalanches originated on the steep mountainsides that surround the upper Khumbu Valley, the location of the EBC (Figs. 1–3). Avalanches from hanging glaciers along these mountainsides are common and are the source of ∼75% of the mass accumulation of the valley's main glacier (Inoue, 1977). These so-called glacier avalanches represent a distinct class of catastrophic mass flow characterized by the large amount of potential energy, resulting from the height of the source, that can be released leading to significant environmental impacts (Deline et al., 2015). Earthquake-induced glacier avalanches are a rare and relatively unstudied phenomenon in the Himalayas and elsewhere (Podolskiy et al., 2010). Reported cases include the large avalanche triggered on Nevado Huscarán in Peru by the Ancash earthquake in 1970 that resulted in over 18,000 fatalities (Plafker and Ericksen, 1978). Eyewitness reports indicate that the avalanche was “accompanied by rise [sic] of a white cloud of snow” (Plafker and Ericksen, 1978). A large number of glacier avalanches were also reported in the Chugach Mountains after the 1964 Alaska earthquake (Podolskiy et al., 2010).
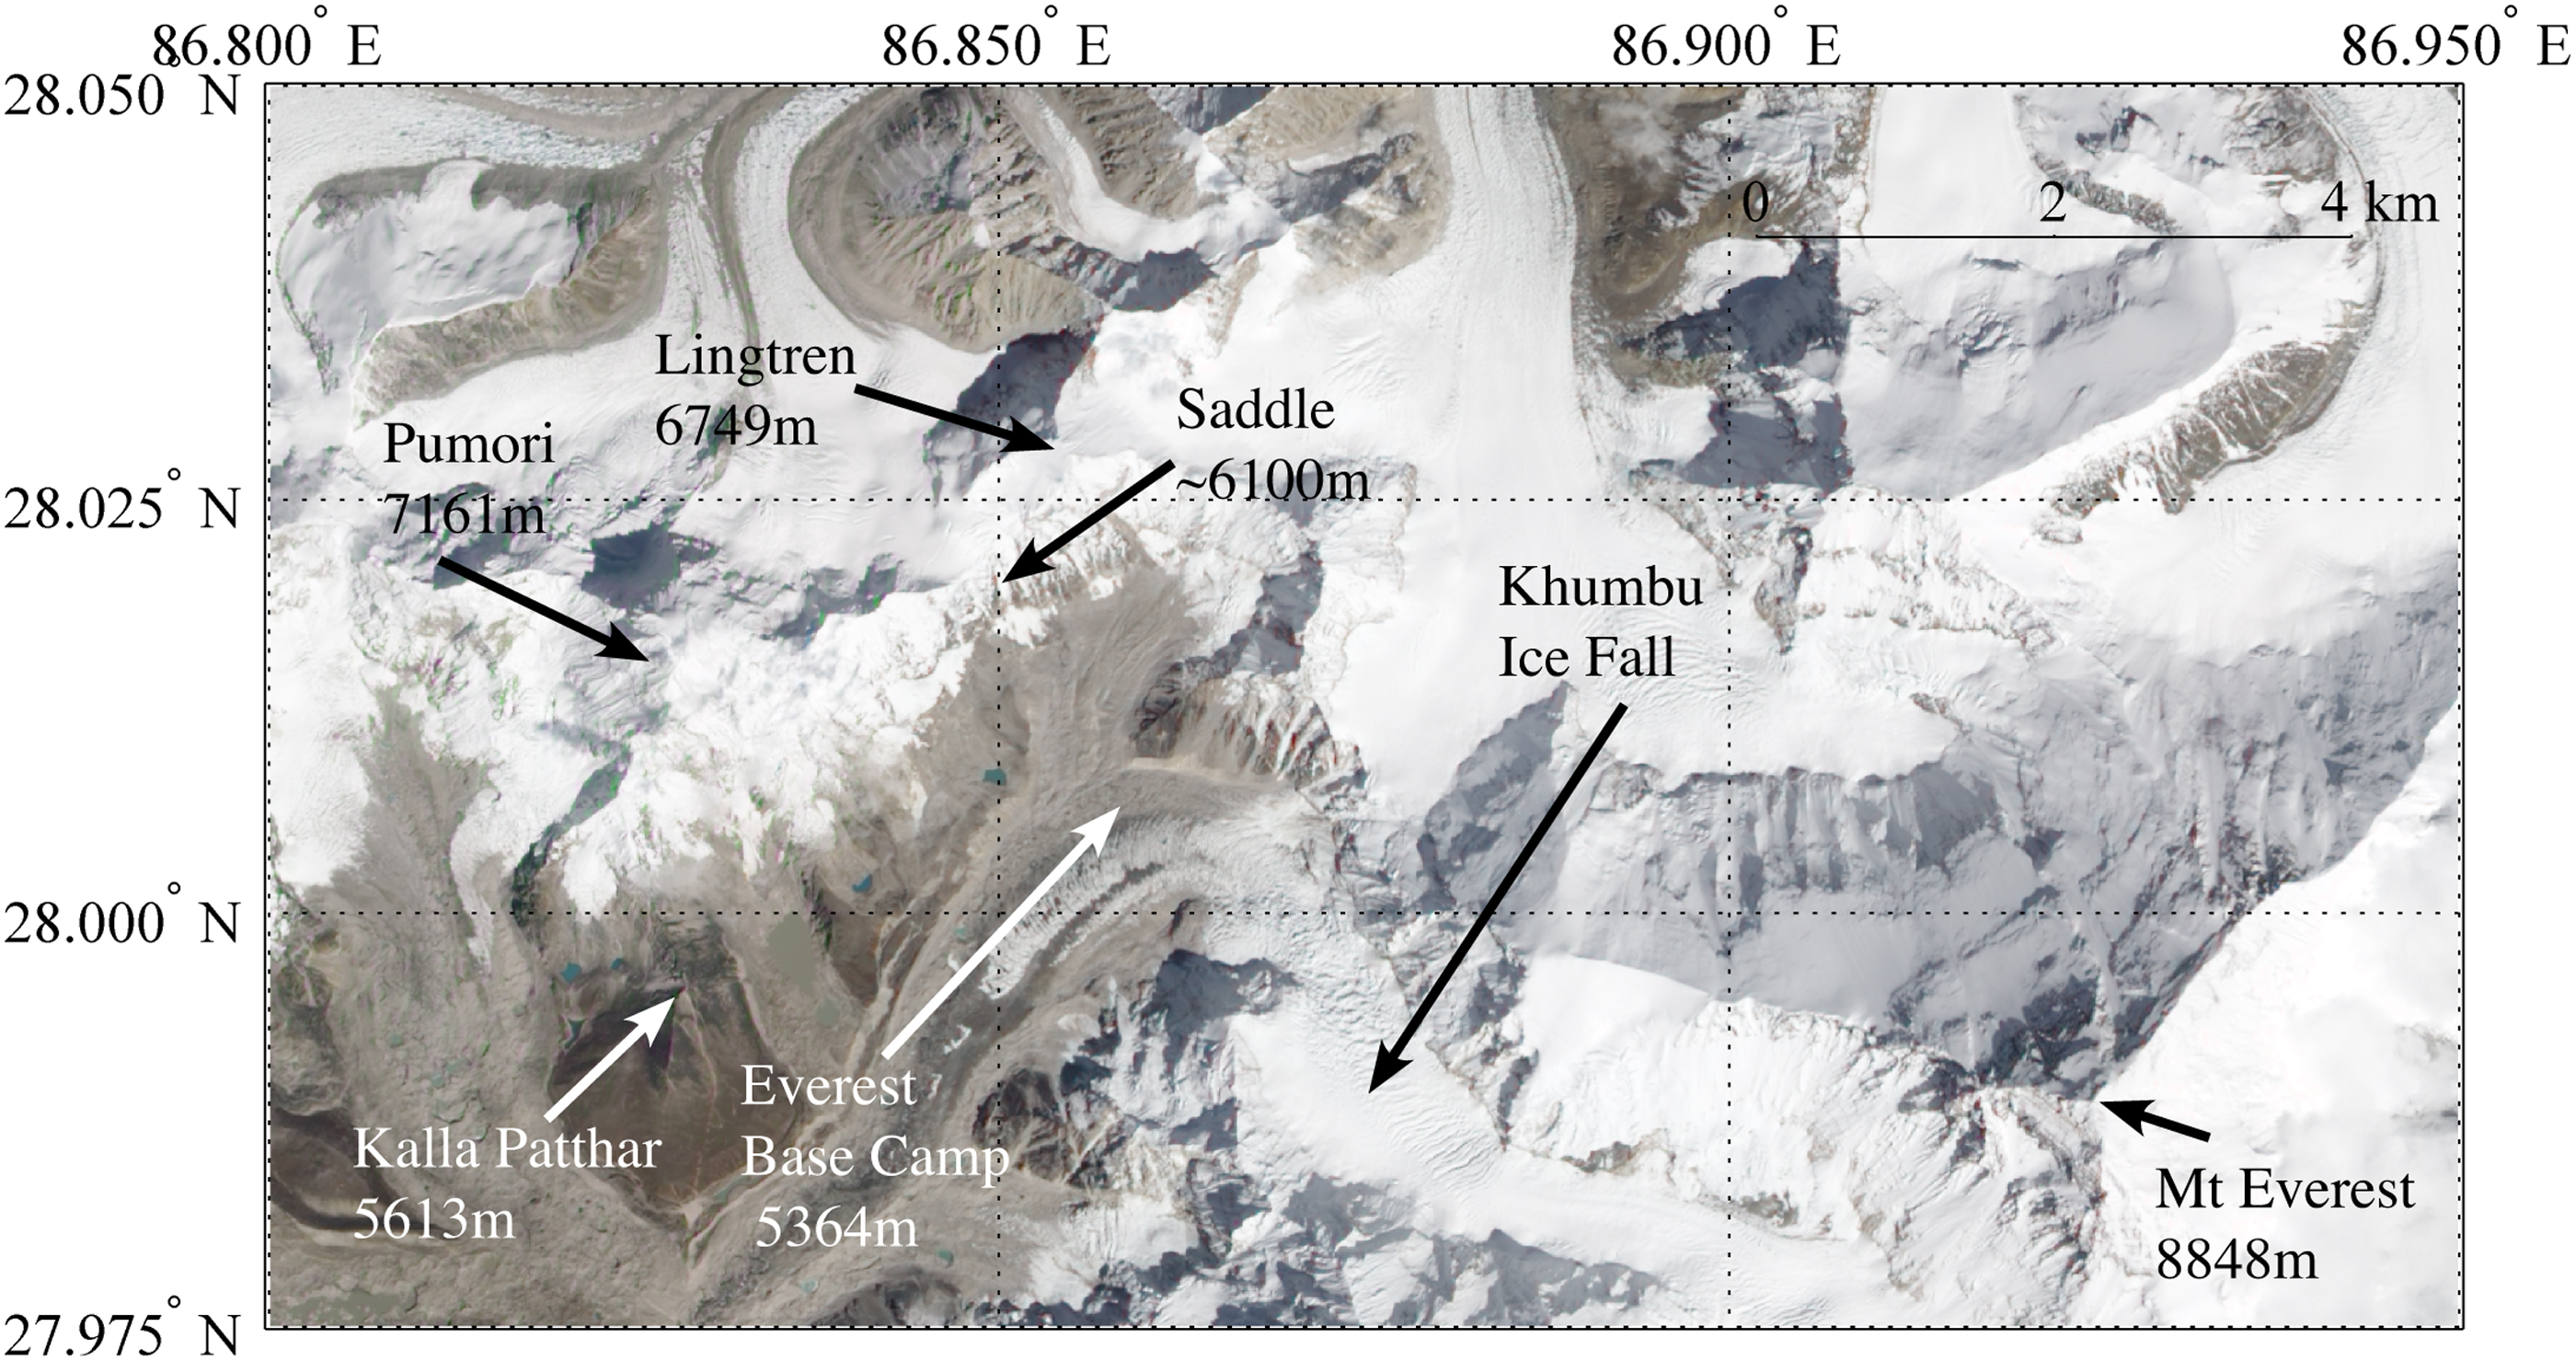
Advanced Land Imager (EO-ALI) true color satellite image of the Mount Everest region taken on October 4, 2010. Places of interest are indicated (image courtesy of NASA).

Photograph taken from the Khumbu Ice Fall in April 2002 showing the location of Everest Base Camp, Pumori, and Lingtren, as well as the location of the col or saddle between Pumori and Lingtren. Avalanche cones can be seen at the bottom of the ridge between Pumori and Lingtren (photograph courtesy of E. Simonson).
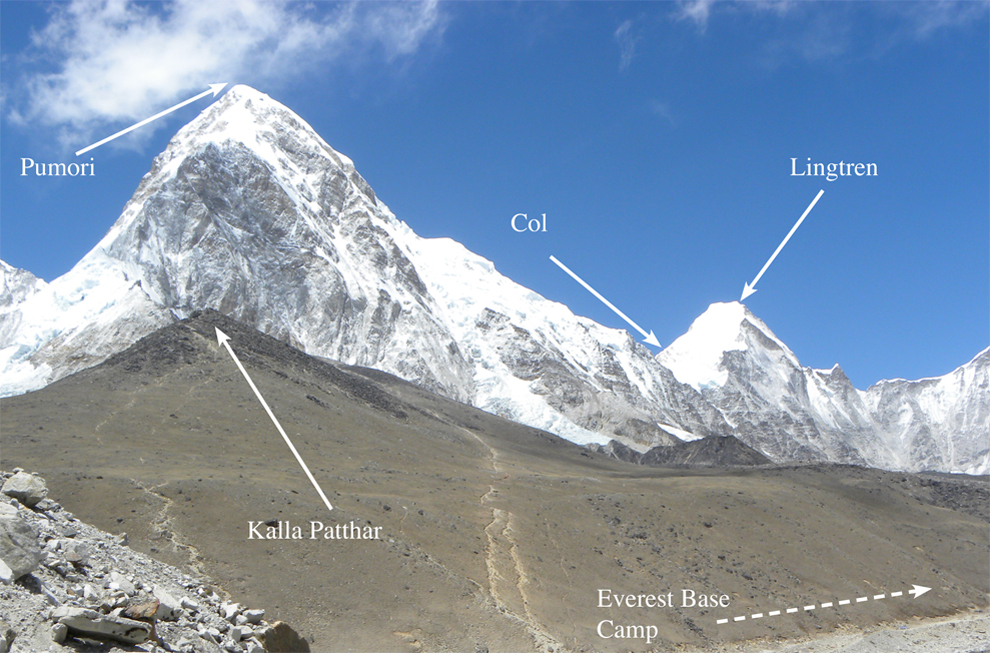
A photograph showing Kala Patthar, Pumori, and Lingtren, as well as the col between Pumori and Lingtren. The route toward Everest Base Camp is also indicated. The photograph was taken on May 9, 2007 (photograph courtesy of Dr. J.L. Semple).
As they move down a mountainside, glacier avalanches often transform into powder snow avalanches, which are a type of gravity current in which a dense core of snow and ice is surrounded by a less dense cloud of snow and/or ice crystals kept aloft by the turbulent flow associated with the core (Hopfinger and Tachon-Danguy, 1977; Bartelt et al., 2016). A decoupling of the plume from the denser core can occur leading to a so-called avalanche wind or air blast that can propagate downstream for large distances (Grigorian, 1975; Hopfinger and Tachon-Danguy, 1977; Bartelt et al., 2016).
Indeed such an avalanche wind was observed by an automatic weather station (AWS) situated ∼12 km down valley from EBC just after the 2014 event (Moore et al., 2017). A model simulation of the 2015 event suggests that such a decoupling also occurred (Bartelt et al., 2016). The destruction at EBC during the 2015 event was attributed to these winds (Fig. 4), estimated (Frankel et al., 2015) as well as modeled (Bartelt et al., 2016) to be in excess of 40 m/s (144 km/h). The existence of an avalanche wind is also in agreement with the trauma observed at EBC: “The injuries we saw were mainly caused by blast injury (blast waves, projectiles, etc.) not avalanche burial” (Tullet, personal communication, April 2016) and “Deaths and injuries were due to trauma caused by the blast force that toppled people and destroyed tents” (Zafren et al., 2018).
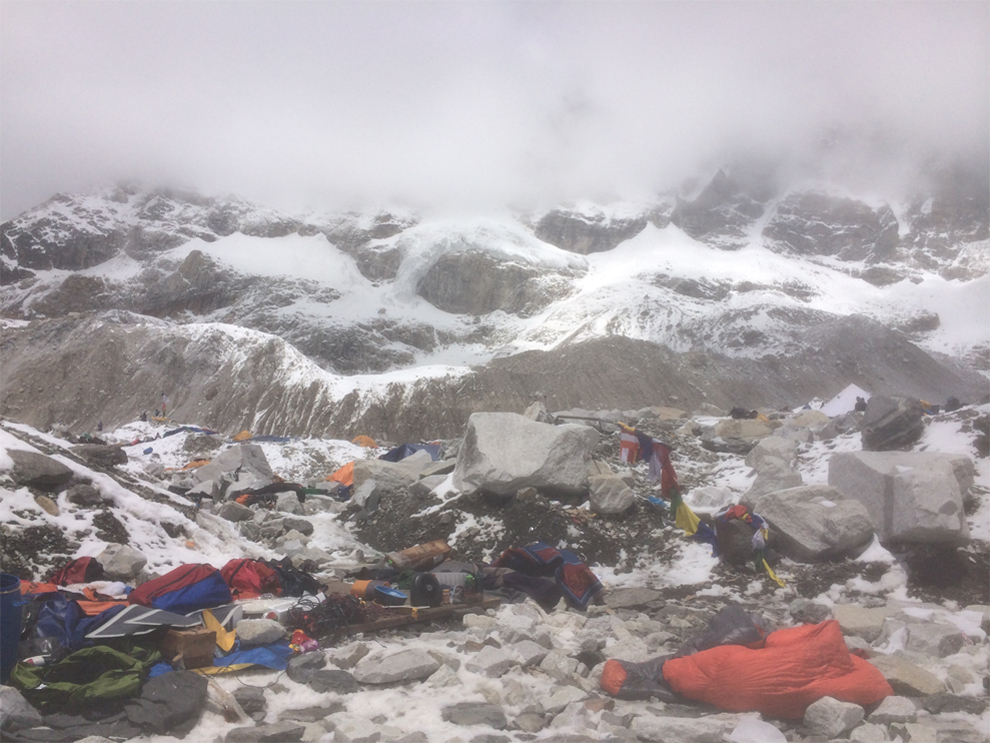
A photograph taken from Everest Base Camp on April 27, 2015, looking toward the ridge between Pumori and Lingtren showing the devastation resulting from the April 25 event. Snow deposited from the avalanche is visible as are avalanche cones along the bottom of the ridge (photograph courtesy of Dr. R. Tullet).
There is some uncertainty as to the source of the 2015 EBC avalanche. Eyewitness reports (Simonson, personal communication, March 2017) place the source as a glacier situated to the west of base camp in a col or saddle along the ridge between Pumori and Lingtren (Figs. 1 and 2). Figure 2, taken in 2002, also shows the presence of avalanche cones, conical regions of snow that remain after an avalanche, all along the bottom of this ridge indicating that the glaciers along this entire section tend to release avalanches. A photograph taken on April 17, 2015, shows a small avalanche in the region of the col (Fig. 5). A photograph taken on May 31, 2015, shows the expansion of this cone that was presumably the result of the April 25 event (Fig. 6). Examination of high-resolution satellite image before and after the event also indicated the loss of ice from a hanging glacier closer to Pumori (Bartelt et al., 2016). It should, however, be noted that there were saturation issues with the satellite imagery that may have precluded identification of the loss of ice from the col region and that the satellite imagery does show the presence of a large avalanche cone at the base of the col (Bartelt et al., 2016).
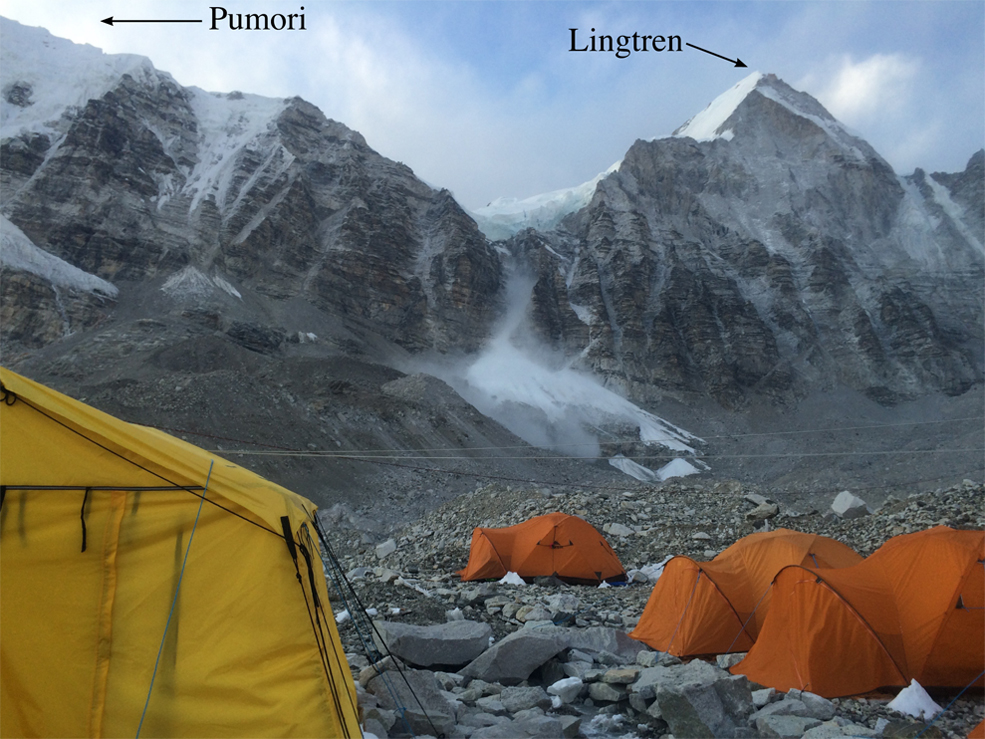
A photograph taken on April 17, 2015, looking toward the ridge between Pumori and Lingtren showing a small avalanche that originated in the col along this ridge (photograph courtesy of Dr. R. Tullet).

A photograph taken on May 31, 2015, looking toward the col along the ridge between Pumori and Lingtren showing the avalanche cone from the April 25, 2015, event (photograph courtesy of Dr. R. Tullet).
The 2014 avalanche originated on a hanging glacier in the vicinity of the Khumbu Ice Fall (Fig. 1) and all the deaths and injuries were Sherpas who were working in the Ice Fall with no loss of life occurring at base camp (Krakauer, 2014; Moore et al., 2017). This is consistent with a comprehensive study of mortality on Mount Everest that indicated a majority of Sherpa deaths occur low on the mountain as a result of objective hazards such as avalanches, while climbers tend to die higher on the mountain often on descent (Firth et al., 2008). In contrast, the deaths and injuries arising from the 2015 event were restricted to EBC and included both Sherpas and climbers (Wilkinson, 2015; Zafren et al., 2018). This anomalous mortality profile also speaks to the highly unusual nature of the 2015 event as well as its magnitude.
There are no known quantitative observations of the avalanche wind as it struck EBC, making it a challenge to fully characterize the event as well as validate modeling studies of it (Bartelt et al., 2016). However, as was the case for the 2014 event (Moore et al., 2017), a nearby weather station did record evidence of this event. In this article, we will make use of observations from this station to provide information on the intensity and source of the avalanche and propose that they are consistent with the triggering of an avalanche swarm by the earthquake.
Materials and Methods
As part of the Stations at High Altitude for Research on the Environment (SHARE) network, a number of AWS were deployed along the Khumbu Valley in Nepal (Stocchi et al., 2011). One of these sites was at Kala Patthar (elevation 5,613 m asl), a small promontory along the south ridge of Pumori (Figs. 1 and 2). The weather station was situated ∼3.5 km from EBC and ∼4 km from the col along the ridge between Pumori and Lingtren. The AWS was active from 2010 to 2015 and recorded temperature, relative humidity, pressure, solar radiation, as well as wind speed and direction (Stocchi et al., 2011). Please see Table 1 for additional details on the instrumentation. Up until 2014, the data were archived every 10 minutes with minimum, maximum, and mean values over this interval stored. In 2015, the archiving interval was reduced to 1 minute.
Characteristics of the Instrumentation Included on the Kala Patthar Automatic Weather Station
Results
Figure 7shows the solar radiation time series from 11:00 to 13:00 local time on April 25, 2015, as well as the climatological time series based on available data over the period April 16–27, 2010–2015. The minimum, mean, and maximum values as recorded each minute are shown, as well as the difference between the maximum and minimum value each minute. The day was overcast (Zafren et al., 2018), and so, the solar radiation levels were ∼50% lower than would be expected from the climatological values. There were a number of instances during this time period when there were rapid changes in the solar radiation that were presumably associated with variability in cloud cover. All were on the order of 50 W/m2 with the exception of the ∼400 W/m2 reduction in solar radiation that occurred between 11:59 and 12:04 local time. To put this reduction in perspective, it is of a magnitude typically associated with a partial solar eclipse but occurred on a significantly shorter timescale (Harrison et al., 2016). The magnitude of the solar radiation subsequently rose over the following 20 minutes reaching typical values for this day. The exceptional nature of the event that occurred around noon can be seen in the difference between the maximum and minimum values (Fig. 7b). This difference was usually less than 50W/m2 with the exception of the event just after noon, where it reached a value of 200 W/m2. The sampling period of the pyranometer was 0.1 second (Table 1), and so, the instrument's response was sufficiently fast as to resolve the changes observed around noon.
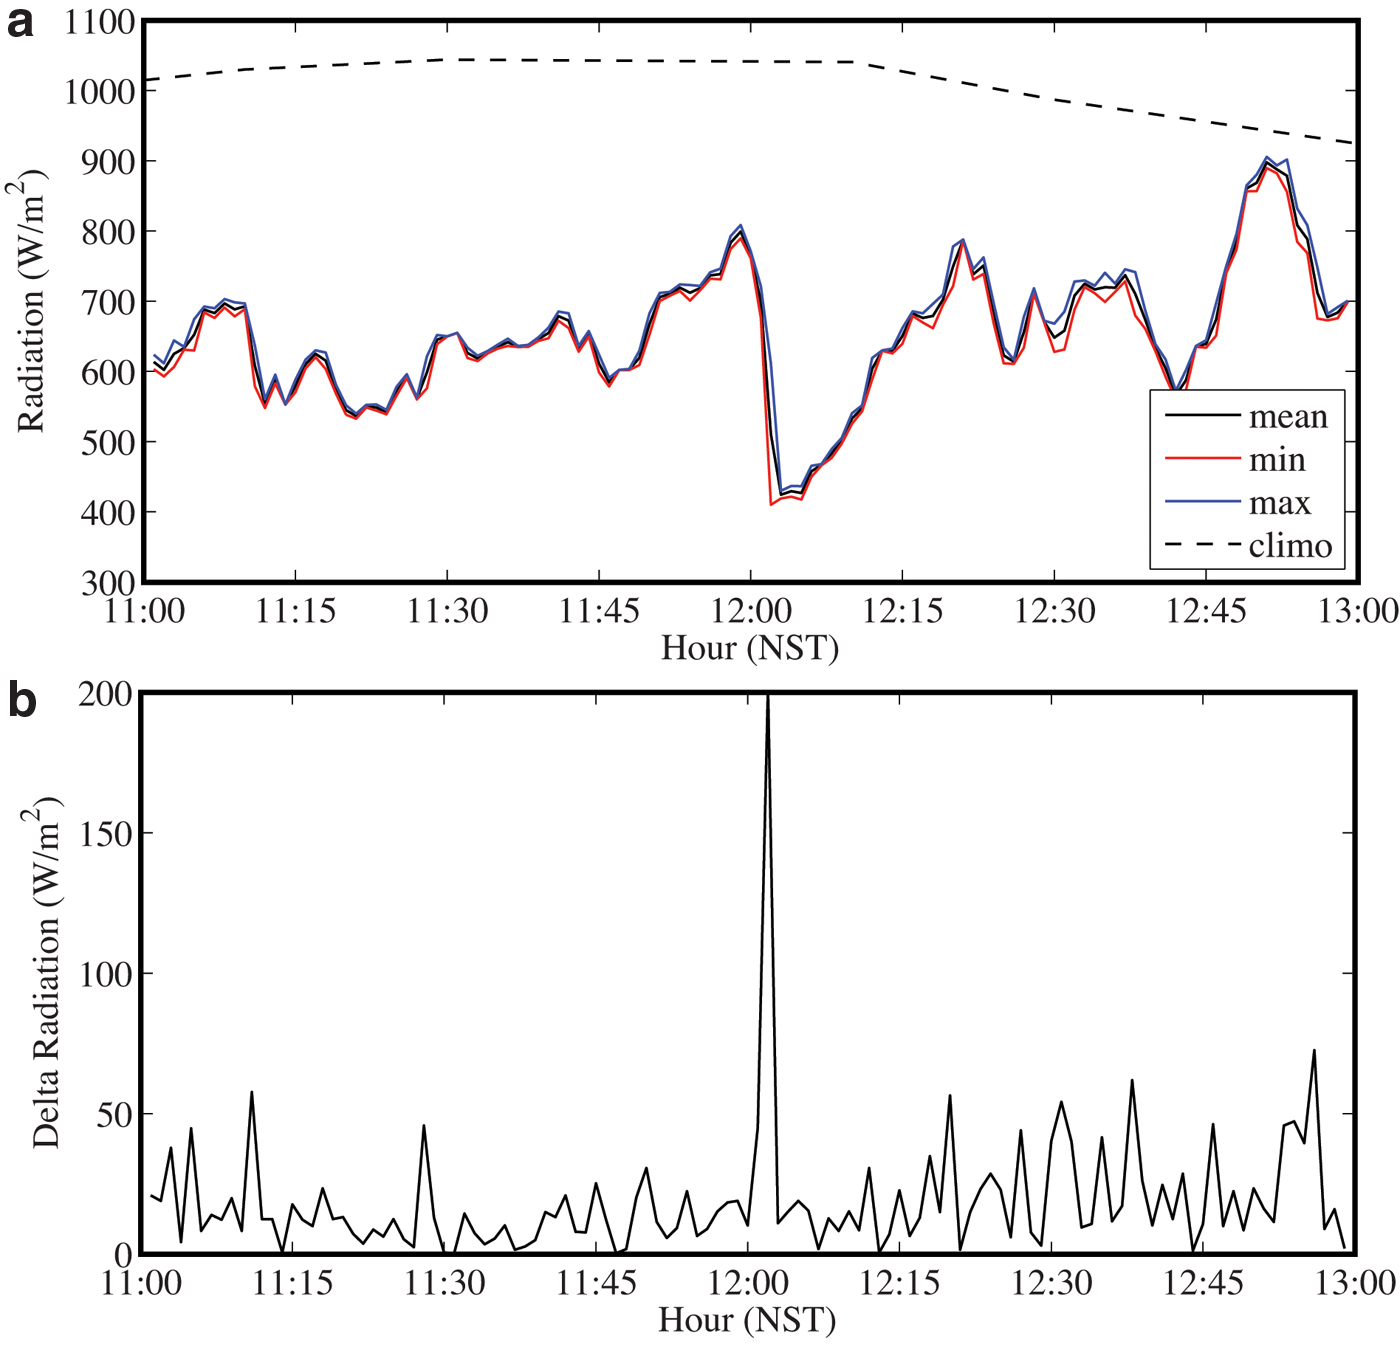
The incoming solar radiation (W/m2) as observed at the Kala Patthar AWS during the April 2015 Mount Everest avalanche.
Mean wind speeds on the 25th were slightly lower than climatological values (Fig. 8a), with the difference between maximum and minimum wind speeds typically on the order of 2 m/s. Soon after the avalanche, there was a period of ∼20 minutes, from noon to 12:20 local time, during which there was a pronounced and highly variable difference between maximum and minimum values that approached 8 m/s at 12:05 local time (Fig. 8b). During this period, there were three distinct instances in which high wind speeds were observed.
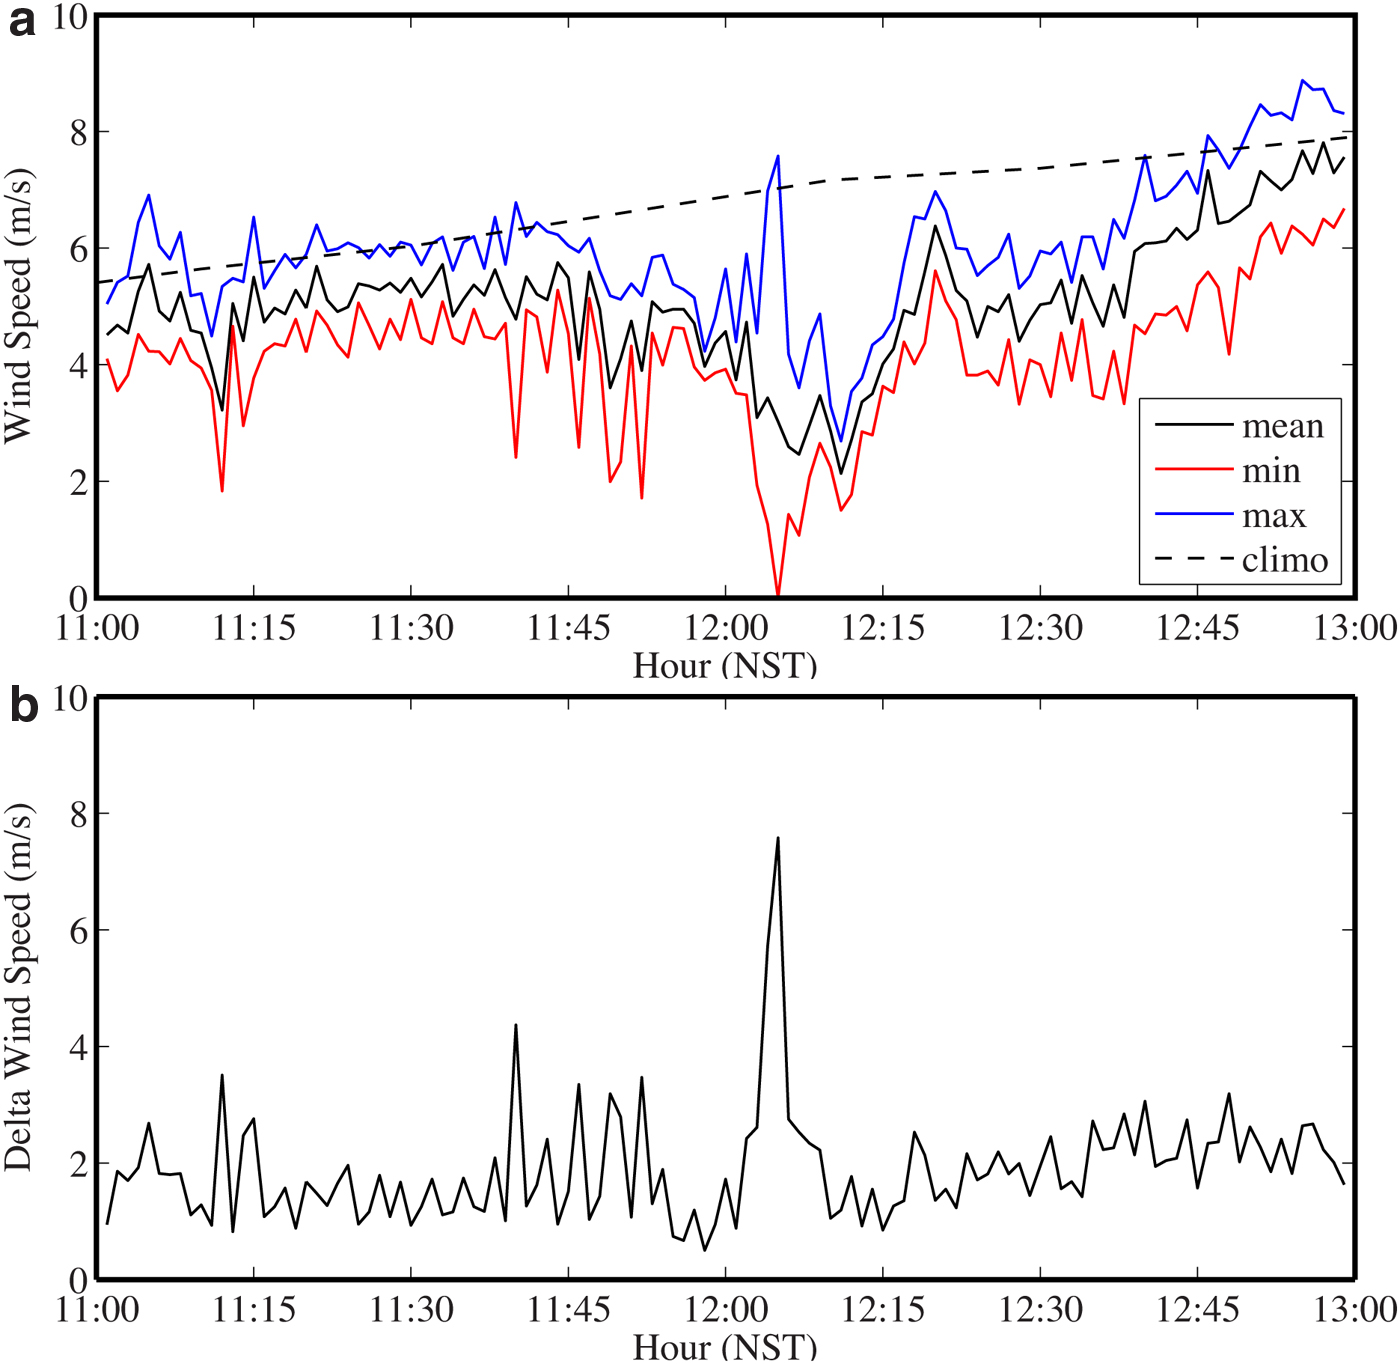
The wind speed (m/s) observed at the Kala Patthar AWS during the April 2015 Mount Everest avalanche.
The mean wind direction time series (Fig. 9a) shows that typically, as well as on the 25th, there is southwesterly flow during this time of the day that is the result of the mountain wind system that transports air up the Khumbu Valley during daylight hours in response to solar heating (Barry, 2008; Moore et al., 2017). During the period from noon to ∼12:20 local time, the period of anomalies in the solar radiation and wind speed noted above, there was a sequence of three events during which there was a rapid change in wind direction (Fig. 9a) that was associated with a reversal from the southwesterly to northeasterly flow (Fig. 9b, c).
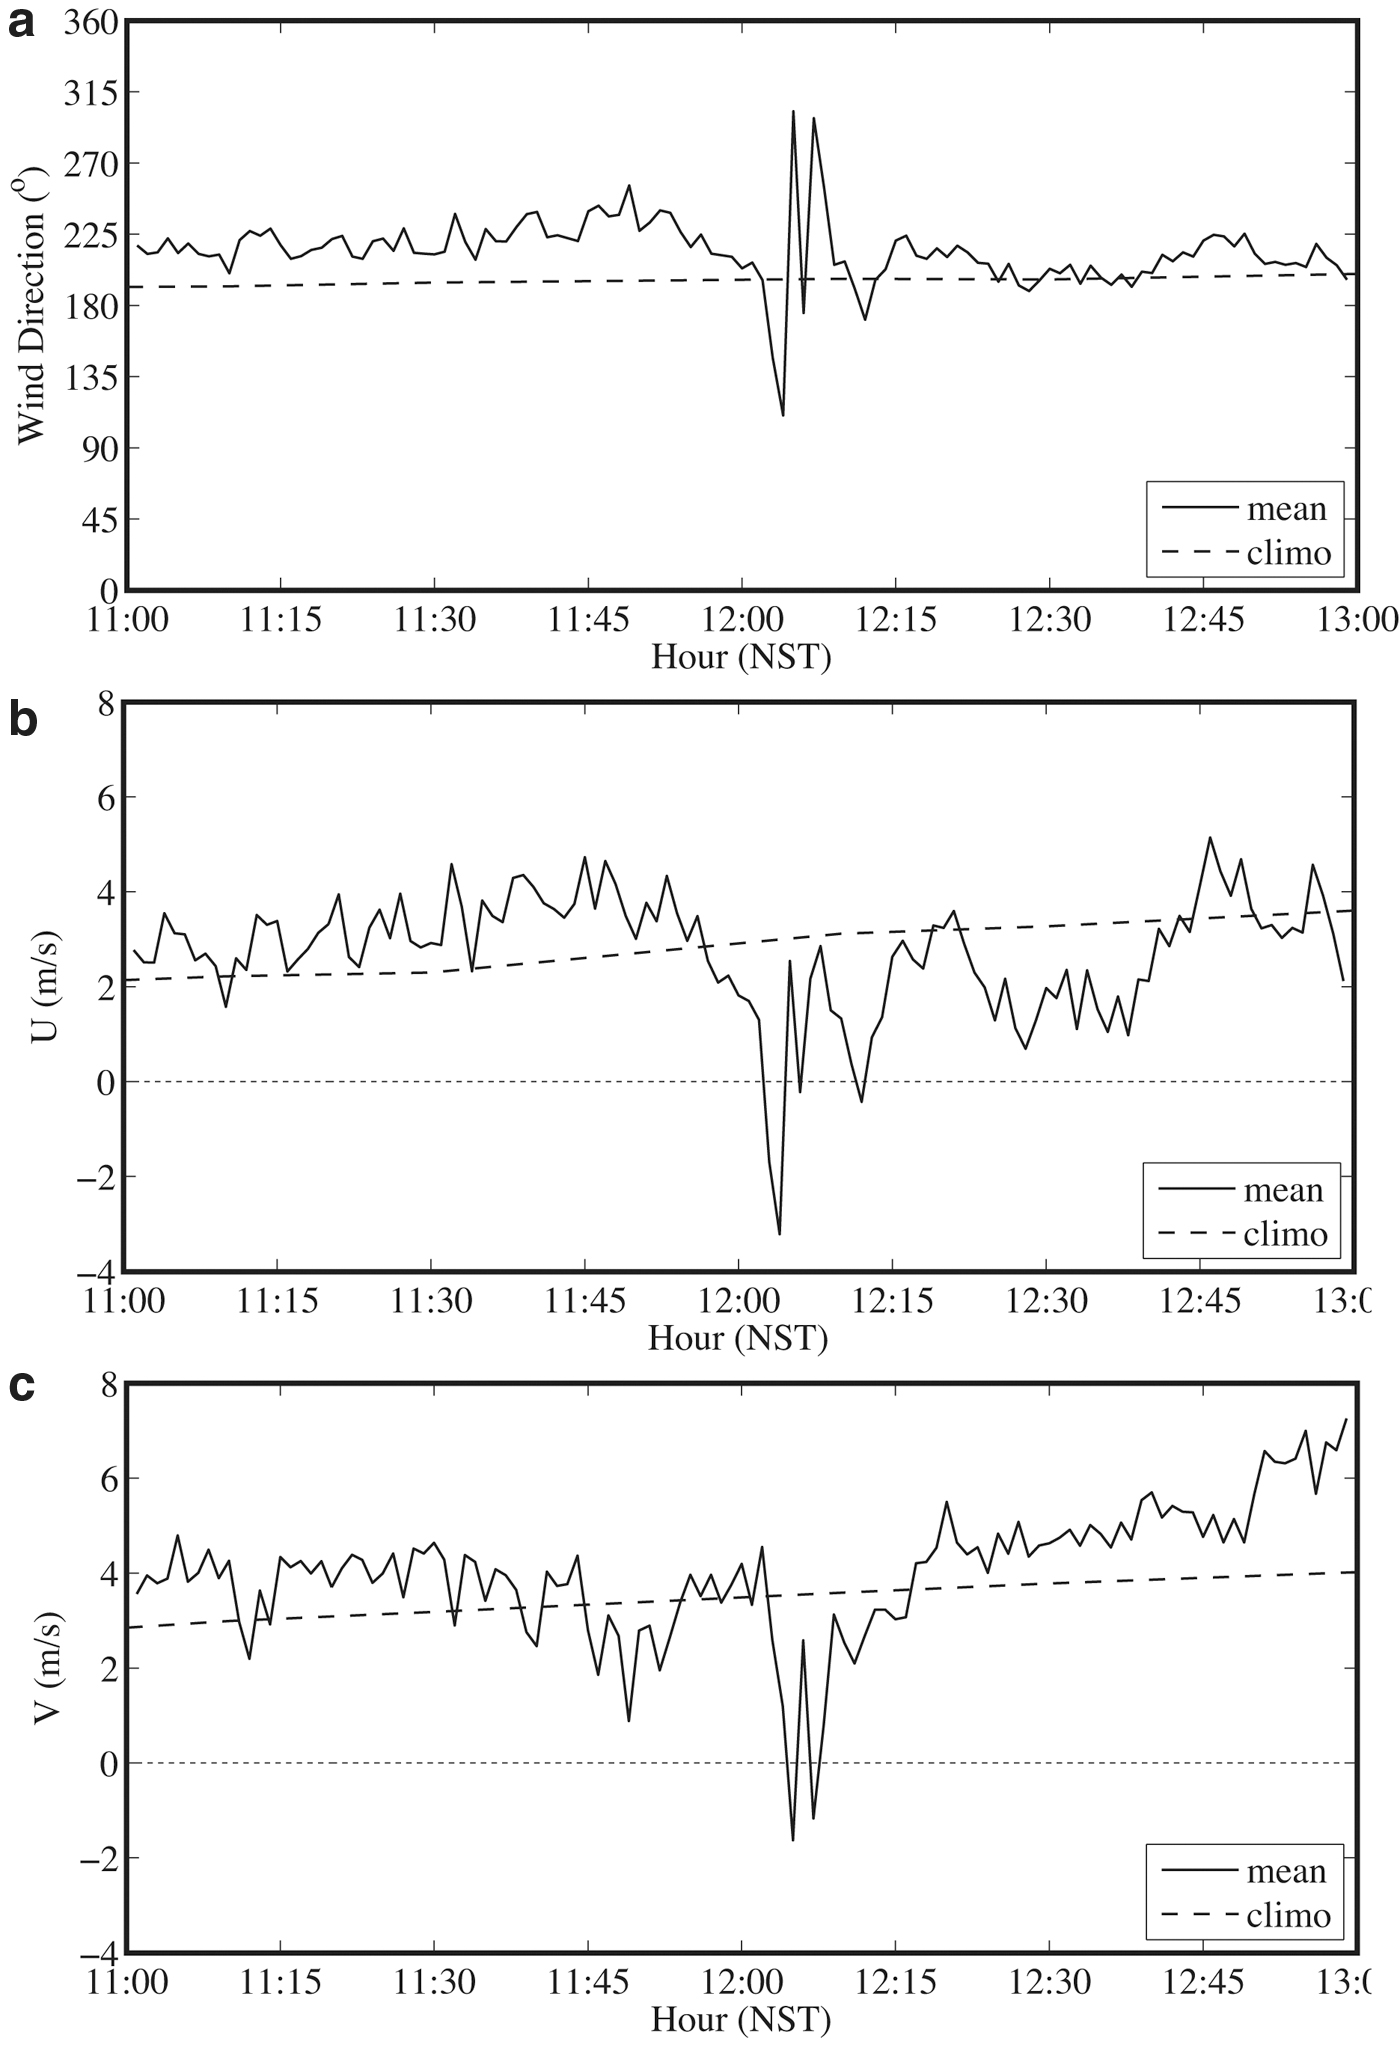
The wind direction observed at the Kala Patthar AWS during the April 2015 Mount Everest avalanche.
Discussion
Occurring a few minutes after the earthquake (Zafren et al., 2018), we attribute the anomalies in solar radiation observed at the AWS to the passage of the cloud of suspended snow and ice crystals associated with the avalanche. The high degree of variability between the maximum and minimum radiation values soon after the onset of the reduction suggests a chaotic initial period as the cloud began to pass by the site. The presence of such a cloud is consistent with observations of a snow cloud associated with the glacier avalanche on Nevados Huscarán triggered by the 1970 Peru earthquake (Plafker and Ericksen, 1978).
The anomalies in wind speed indicate that an avalanche wind was also associated with the event. Wind speeds at Kala Patthar were highly variable soon after the earthquake but only reached a maximum value of 6 m/s. This suggests that a significant drop-off in wind speeds occurred between the AWS site and EBC, where they were estimated to be in excess of 40 m/s (Frankel et al., 2015).
There was also a sequence of reversals in wind direction that were observed just after noon local time. There are at least two possible explanations. The first is that the avalanche wind reverberated across the Khumbu Valley several times before dissipating. The valley in the vicinity of Kala Patthar is ∼2.5 km wide (Fig. 1), and assuming a wind speed of 5 m/s, it would take ∼15 minutes for a wind pulse to cross the valley and return. This is inconsistent with the ∼5-minute period for the observed wind direction anomalies (Fig. 8a). Indeed, there is no topography in the immediate vicinity of Kala Patthar that could act as a reflector consistent with the observed time period. In addition, even if the wind speeds were higher, it is unlikely that any topographic barrier would be efficient at reflecting energy back along its incident path.
It is therefore more probable that this sequence of wind direction anomalies was indicative of multiple air blasts passing the AWS, each associated with a distinct avalanche event. The phasing of the reversals is then the result of the increasing distance from the source site to the AWS and/or differences in the timing of the events. The col is ∼4 km from the AWS and so the air blast associated with an avalanche from this location would take ∼15 minutes to arrive at the Kala Patthar site. This is consistent with the timing of the wind direction anomalies. The magnitudes of the wind anomalies are approximately the same, suggesting that the one farthest away, that is, the one with its source in the col between Pumori and Lingtren, was the largest.
It is therefore likely that the earthquake resulted in a number of distinct avalanches from one or more different source regions along this ridge, with the primary source being at the col (Simonson, personal communication, March 2017). This hypothesis that an avalanche swarm was responsible for the damage at EBC is consistent with a photograph taken on April 27, 2015, during a rescue mission, that indicated the presence of avalanche debris all along the ridge between Pumori and Lingtren, with the largest concentration at the bottom of the col (Fig. 10).
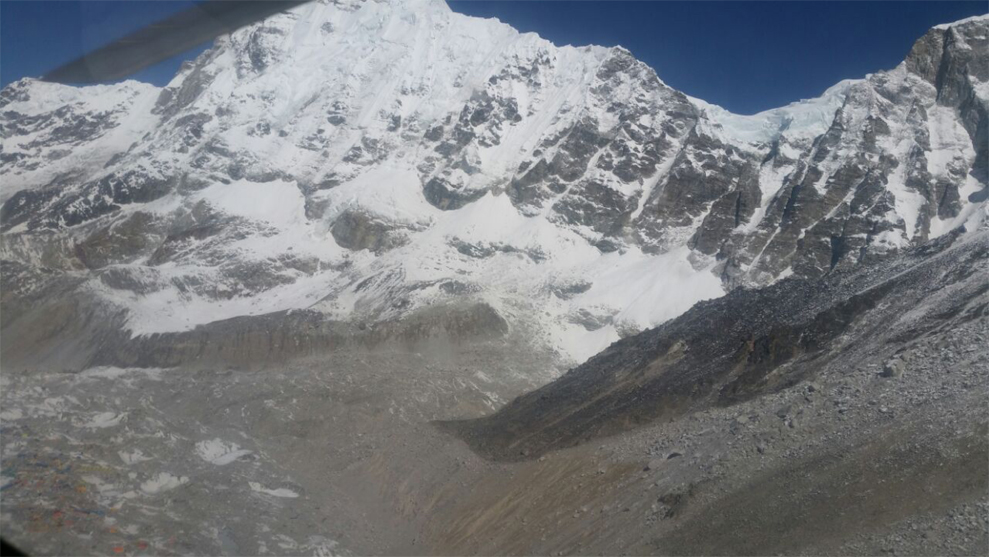
A photograph taken during a helicopter rescue mission on April 27, 2015, showing the numerous avalanche cones along the ridge between Pumori and Lingtren (photograph courtesy of G.P. Verza).
If there was indeed an avalanche swarm, why was there only a single reduction in solar radiation observed? The answer to this question is unclear, but it is likely that the large reduction in solar radiation that occurred just after noon local time on the 25th had as its source, the avalanche site, closest to Pumori (Bartelt et al., 2016). It is likely that the plumes of suspended snow and ice from the avalanches farther down the ridge did not pass the AWS or had already undergone some homogenization before passing it. As a result, the one large anomaly in solar radiation is not inconsistent with the multiple anomalies in wind direction.
A modeling study of the 2015 Everest avalanche assumed a source close to Pumori (Bartelt et al., 2016), and it is likely that this avalanche was the one that resulted in the solar radiation anomaly at Kala Patthar. In this regard, it should be noted that the AWS is ∼300 m above EBC (Fig. 1) and it follows that the cloud must have had a vertical extent of this magnitude or higher. This is significantly higher than the model estimates that also do not indicate that the cloud reached Kala Patthar (Bartelt et al., 2016). In addition, it is clear that the impact on EBC of avalanches from source regions closer than that assumed in this study (Bartelt et al., 2016) also needs to be considered.
Conclusions
The realization that there were most likely an avalanche swarm that led to the death, injuries, and destruction at EBC suggests that there is room for improvement in our understanding of avalanches in the region as well as in our capability to model and ultimately forecast such events. Based on available instrumental records, the Everest region has warmed by ∼0.8°C since the 1980s (Diodato et al., 2012). This warming has been associated with a 100–300 m rise in the elevation at which the ground is permanently frozen (Fukui et al., 2007), as well as a retreat and thinning of the glaciers in the region (Bolch et al., 2008; Thakuri et al., 2013). Future warming has the potential for further reductions in the extent of glaciers in the Everest region below heights of 7,000 m asl (Shea et al., 2015), suggesting that the Pumori-Lingtren ridge may be susceptible to avalanches in the future. Additional research into these glaciers and their stability should to be undertaken to reduce the risk to those who work at or visit EBC.
Footnotes
Authors' Contributions
All authors jointly conceived the study. P.C., G.P.V., and P.B. collected the AWS data. All authors jointly interpreted the results. G.W.K.M. wrote the article and all other coauthors provided feedback on it.
Acknowledgments
The authors would like to acknowledge the Ev-K2-CNR Committee and the National Project of Interest Nextdata for logistical and technical support of the automatic weather stations that were deployed in the Khumbu Valley. The authors would also like to thank Mr. E. Simsonson, Dr. K. Zafren, and Dr. R. Tullet for their photographs and recollections of the event.
Author Disclosure Statement
No competing financial interests exist.
Funding Information
GWKM would like to acknowledge support from the Canada Fulbright Foundation and the Natural Sciences and Engineering Research Council of Canada.