
Abstract
Huamaní, Charles, William Sarmiento, Golda Córdova-Heredia, Luz Cruz-Huanca, Paulina Damián-Saavedra, and Dario Antonio. Prediction of blood viscosity based on usual hematological parameters in a clinically healthy population living in a high-altitude city. High Alt Med Biol. 23:78–84, 2022.
Background and Aims:
Variations in blood viscosity are mainly determined by the hematocrit level, but in residents of high-altitude cities, the hemoglobin levels and blood viscosity values are often high. We aimed to determine the blood viscosity values in clinically healthy chronic hypoxia-acclimatized individuals and establish a predictive model based on the hematocrit level and other common hematological parameters.
Methods:
A prospective observational study was conducted in asymptomatic young adults living in Cusco (a city located at 3,399 m). Venous blood samples were collected to determine the hemoglobin, hematocrit, and albumin and serum protein levels and blood viscosity values.
Results:
Altogether, 253 volunteers were included, of whom 147 (58.1%) were women. The hematological values were mean values of hemoglobin, 16.32 ± 2.0 g/dl; hematocrit, 48.12% ± 5.24%; triglycerides, 130.68 ± 90.64 mg/dl; globulin, 3.07 ± 0.36 g/dl; and mean blood viscosity, 6.17 ± 0.94 centipoises. The prediction model with the highest explained variance (R2 = 68.07%) and parsimony conservation comprised hematocrit, globulin, and triglycerides [blood viscosity = hematocrit × (0.176) + globulin × (0.595) + triglycerides × (1.77/1,000) − 4.13].
Conclusions:
In a population living at high altitude, the blood viscosity level is extremely high and mainly determined by the hematocrit level. This population has chronic high blood viscosity levels, which can be predicted using other blood elements.
Introduction
Several studies have evaluated the impact of blood viscosity in certain diseases, such as stroke, heart disease, and cancer (Grotta et al., 1982; Yarnell et al., 1991; Mehta and Singhal, 2003; Cowan et al., 2012); however, the impact of blood viscosity on health has not been given considerable attention, being one of the analytical parameters rarely used in daily clinical practice. This could be due to the fact that direct measurement is difficult and can be time-consuming and resource-intensive; there remains a lack of consensus on reliable measurement parameters (Rosencranz and Bogen, 2006; Baskurt et al., 2009). Furthermore, additional understanding of several concepts in physics is required for its proper interpretation, and studies in this domain are ongoing (Secomb and Pries, 2013).
The complexity in the direct measurement of blood viscosity has led several authors to develop different methods to simplify prediction of the blood viscosity level using other hematological parameters that are requested in usual clinical practice, such as hemoglobin, hematocrit, cholesterol, and protein levels (Kharb and Singh, 1999; Eckmann et al., 2000; Carallo et al., 2013; Irace et al., 2014).
Hemoglobin and hematocrit are the most influential factors in determining blood viscosity. However, studies related to these factors were conducted in individuals living at sea level, where low levels of hemoglobin can be found and where prediction formulas might not be accurate. Even so, these formulas explain between 60% and 71% (Koenig et al., 1992; Crowley et al., 1994; Rosenson et al., 1996; Velcheva et al., 2006; Irace et al., 2014) of the viscosity variation and include elements such as fibrinogen, which is not easy to measure in cities such as Cusco.
On the contrary, for individuals who live at high altitudes (2,500 m) and who are naturally subjected to a chronic hypoxia condition, the physiological acclimatization process leads to an increase in the number of red blood cells and hematocrit and hemoglobin levels to compensate for the deficiency in oxygen transport (Wilson et al., 2009; Imray et al., 2011; Villafuerte and Corante, 2016), which increases blood viscosity.
The specific changes that the high-altitude population will experience might also cause changes in their usual risk factors; in these cases, measurement of blood viscosity may be necessary. Furthermore, it remains unclear whether certain mechanisms were developed during the physiological acclimatization process to avoid decompensation of blood viscosity.
Finally, due to the impracticality of blood viscosity measurement, the formulation of indirect methods is required to be clinically useful. In this regard, we aimed to determine blood viscosity values in individuals living in high-altitude cities and establish a predictive model for blood viscosity based on commonly measured hematological variables.
Methods
Design and population
An observational, cross-sectional, correlational, and prospective study was conducted. Young adults (aged 18–40 years) were invited to participate in the study. The participants reported that they had no symptoms and were residents of the city of Cusco (located 3,399 m), which according to Wilson et al. (2009) is a city located at high altitude. We chose young and healthy people to establish the basal levels of blood viscosity without the intervention of other modifying factors, such as chronic diseases or medication consumption.
Residents were regarded as those who lived in the Cusco region for more than 6 continuous months, although more than 70% of the participants indicated that they had lived in Cusco their entire lives. This period was considered because the time required for physiological acclimatization to this altitude is ∼3 months (Monge Cassinelli et al., 2003). Moreover, the residents were asked whether they had consumed nonsteroidal anti-inflammatory drugs, alcohol, or tobacco in the last 72 hours before the examination; those who consumed the latter were excluded.
Measurement of hematological parameters
After obtaining informed consent, two 3-ml venous blood samples (one with ethylenediaminetetraacetic acid [EDTA] and one without EDTA) were collected from all eligible individuals. This procedure was performed according to appropriate biosafety indications, with the patient in the sitting position, at the level of flexion of the left arm.
The hemoglobin/hematocrit level, platelet count, albumin/serum protein level, and lipid profile (triglyceride, high-density lipoprotein [HDL], low-density lipoprotein [LDL], and total cholesterol levels) were determined. These tests are commonly performed in clinical practice and could theoretically have the greatest impact on the blood viscosity level (Cowan et al., 2012). All these procedures were performed using automated equipment (Mindray BC-5300 and Mindray BS-600), with daily calibration, and according to the standard protocol in a certified laboratory.
Other elements, such as fibrinogen, are not routinely measured in Cusco due to the lack of necessary instruments, so they were not considered.
Blood viscosity measurement
A Brookfield AMETEK viscometer, model DV2T LV CP (cone–plate), was used for direct measurement of viscosity, which is expressed in centipoises (P). This viscometer has very high reliability parameters (viscosity range that can evaluate from 0.2 to 3,000 centipoises (cP), temperature range from 5°C to 80°C, and repeatability of ±0.2%); its use in evaluating blood viscosity has been reported in other studies and complies with international guidelines for measuring blood viscosity (Kovacs et al., 2018; Potanin and Marron, 2021). The venous sample with EDTA was used to measure blood viscosity.
All samples measured had a volume of 0.5 ml and were processed under controlled temperature (37°C). The daily calibration of the viscosity measurement was performed using a standard solution of 5 cP viscosity at a temperature of 25°C. Hemorheology determinations were performed according to the guidelines established by the International Society for Clinical Hemorheology (Baskurt et al., 2009).
After the homogenization process, the samples were processed at 10 revolutions per minute (RPM) with a 7.5-N spindle, which provided a share rate of 75 seconds−1. We chose 75 seconds−1 because when blood is evaluated at less than 10 seconds−1, the viscosity levels increase significantly and are not very predictable; however, when the values are close to 100 seconds−1, they remain stable and do not vary significantly, even when evaluated at 1,000 seconds−1 (Cho and Cho, 2011).
Measurement of plasma viscosity
The same procedures were performed, and the same equipment used to measure blood viscosity was applied, except for the following process: to obtain plasma, the venous sample without EDTA was used and plasma was extracted, which was centrifuged at 14,000 RPM for 7 minutes. The samples were processed at 750 seconds−1 to obtain more accurate results due to the lower plasma viscosity (PV) values (values below 2 cP).
Data processing
The hematological and viscosity parameters were recorded and exported to the statistical program, STATA/IC 16, where the variables were coded, reviewed, and analyzed. The statistical analysis included the description of variables such as absolute and relative frequencies as well as arithmetic averages with their respective confidence intervals. For independent data, Student's t-test was used to compare two means; a p-value of <0.05 was considered significant.
To obtain an equation that predicts the level of blood viscosity according to other evaluated parameters (hemoglobin, proteins, lipids, and platelets, etc.), a multivariate linear regression model was developed. To build this model, bivariate assessments were performed (e.g., viscosity–hemoglobin) and the assumptions of the normality of distribution of residuals and equality of variance (homoscedasticity) in distribution were evaluated.
A multivariate model was progressively established, verifying the increase in the explained variance (R2) of the initial bivariate model according to Akaike's information criteria (Kitagawa and Konishi, 2010).
Based on the above findings, the following two models were established: the first model comprised all variables that increase the explained variance and the second model comprised three variables that facilitate its use in clinical environments and have parsimony, without sacrificing too much of the explained variance. Finally, a sensitivity analysis was performed for prediction of the blood viscosity level, where the highest viscosity values were eliminated; initially, viscosity values greater than 10 cP were removed, followed by 9.5, 9, 8.5, and 8 cP, to identify the viscosity level at which the formula has its highest predictive performance.
Ethical statement
The study was conducted in clinically healthy young adults who voluntarily agreed to participate in the study, and the patients provided their informed consent. The study was approved by the Ethics and Research Committee of Hospital Nacional Adolfo Guevara Velasco, EsSalud Cusco (resolution No. 419-GRACU-ESSALUD-2020). All participants received the results of their tests, which were performed free of cost.
Due to the ongoing pandemic, in addition to the standard biosecurity measures, all study participants were required to wear masks and face shields and maintain social distancing; additionally, the exposure time was minimized by scheduling appointments for clinic visits.
Results
A total of 253 clinically healthy volunteers were included, of whom 147 (58.1%) were women. The mean age of patients was 26.29 ± 5.32 years (range: 20–40 years). The hematological values are presented in Table 1. For most of the parameters evaluated, significant differences were found according to sex; that is, men had a hemoglobin level of 18.04 ± 1.08 g/dl, while women had a hemoglobin level of 15.13 ± 1.52 g/dl (p < 0.001). The hemoglobin range was 10–19 g/dl for women and 15.8–19.9 g/dl for men.
Blood Viscosity, Plasma Viscosity, and Other Hematological Parameters in Healthy High-Altitude Residents
HDL, high-density lipoprotein; LDL, low-density lipoprotein.
Blood viscosity
In the bivariate analysis, blood viscosity was mainly influenced by variations in hematocrit levels (R2: 0.629), hemoglobin levels (R2: 0.617), or red blood cell count (R2: 0.514); other element measures have little or no explanation (Table 2).
Correlations Between Hematological Elements and Blood or Plasma Viscosity Values in High-Altitude Residents
In the multivariate analysis, collinearity was demonstrated in the measurement of hemoglobin/hematocrit/red blood cells, while the variable, sex, lost statistical significance when adjusted for hemoglobin levels. Several predictive models were constructed, of which the model with the highest explained variance consisted of hemoglobin, globulin, and triglyceride levels and platelet and red blood cell counts. This model had an explained variance of 69.99% and was determined using the following equation:
A second simpler model, with an explained variance of 68.07%, was constituted by the hematocrit, globulin, and triglyceride levels and determined using the following equation:
For example, to understand this formula, a person with 50% hematocrit, 3 g/dl globulins, and 150 mg/dl triglycerides, would have blood viscosity of 6.72 cP when substituting the values.
Based on this formula, Figure 1 was constructed, which illustrates the relationship between actual blood viscosity values and predicted values using the linear regression model. As can be observed from the confidence intervals, this formula can adequately express the values for blood viscosity levels ranging between 5 and 7, but higher viscosity values lie outside the prediction parameters.
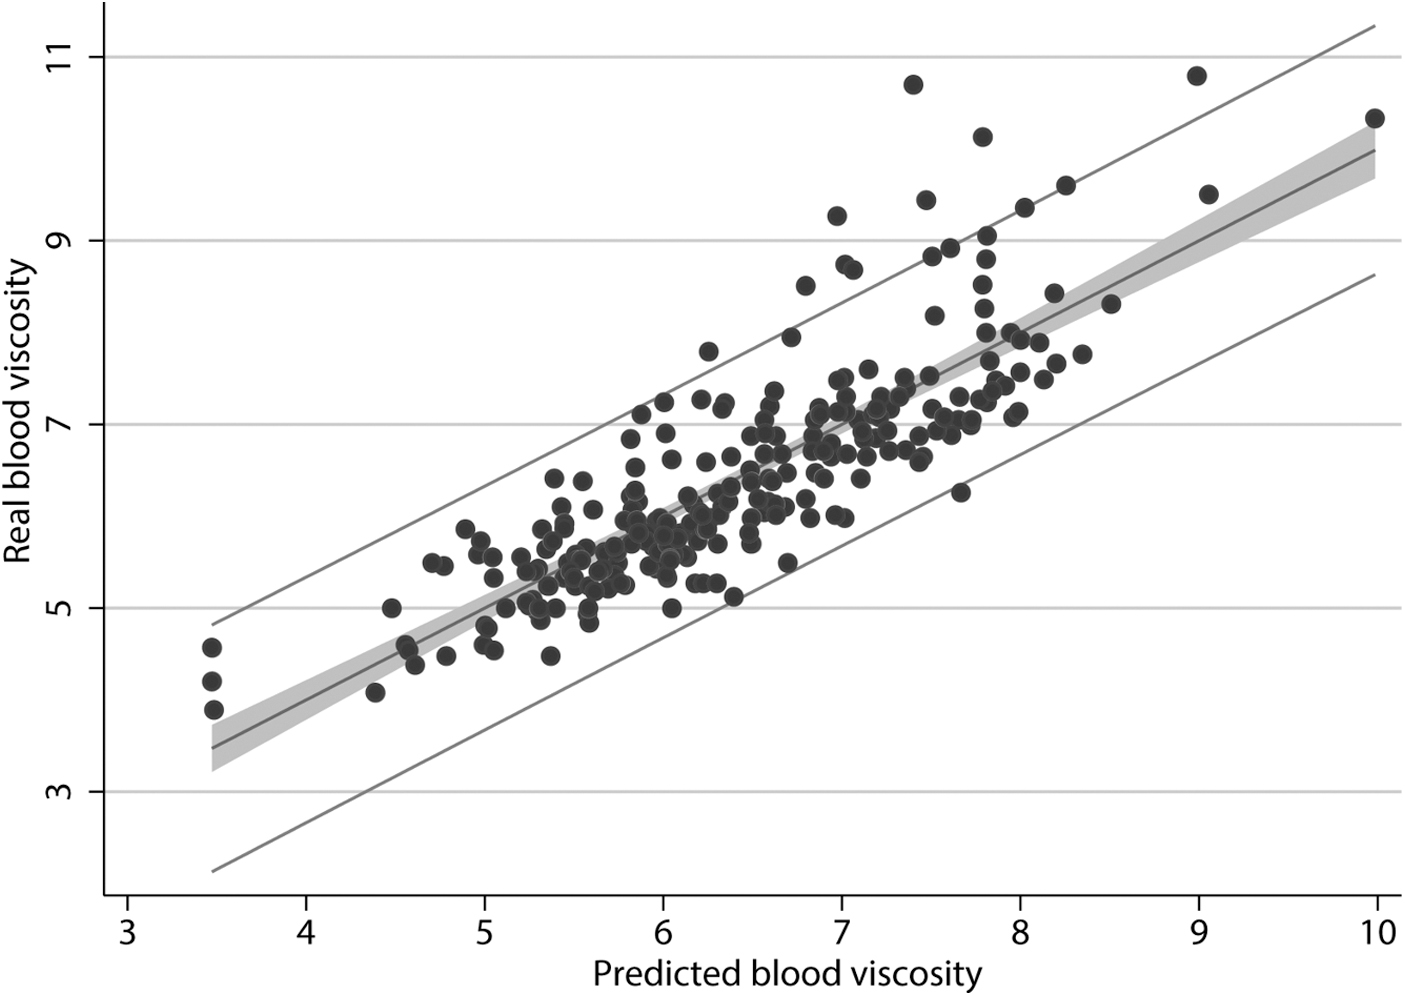
Comparison between predicted and real blood viscosity values.
Therefore, the sensitivity of the formula was evaluated by limiting the prediction to lower blood viscosity levels (Table 3); if the blood viscosity level is 8.5 cP, the explained variance is 71.57%.
Sensitivity Analysis to Determine the Best Prediction of Blood Viscosity Versus Hematocrit, Globulin, and Triglycerides
Blood viscosity = hematocrit × (0.176) + globulin × (0.595) + triglycerides × (1.77/1000) − 4.13
Plasma viscosity
In the crude models for PV, no hematological parameter had well-explained variance, globulin being the best parameter with an explained variance of 22.8% (Table 1). The best multivariate model was achieved by including values of globulin and triglyceride levels and platelet count, which revealed an explained variance of 28.2%, with a wide dispersion of predicted versus actual data (Fig. 2). This model was determined using the following equation:
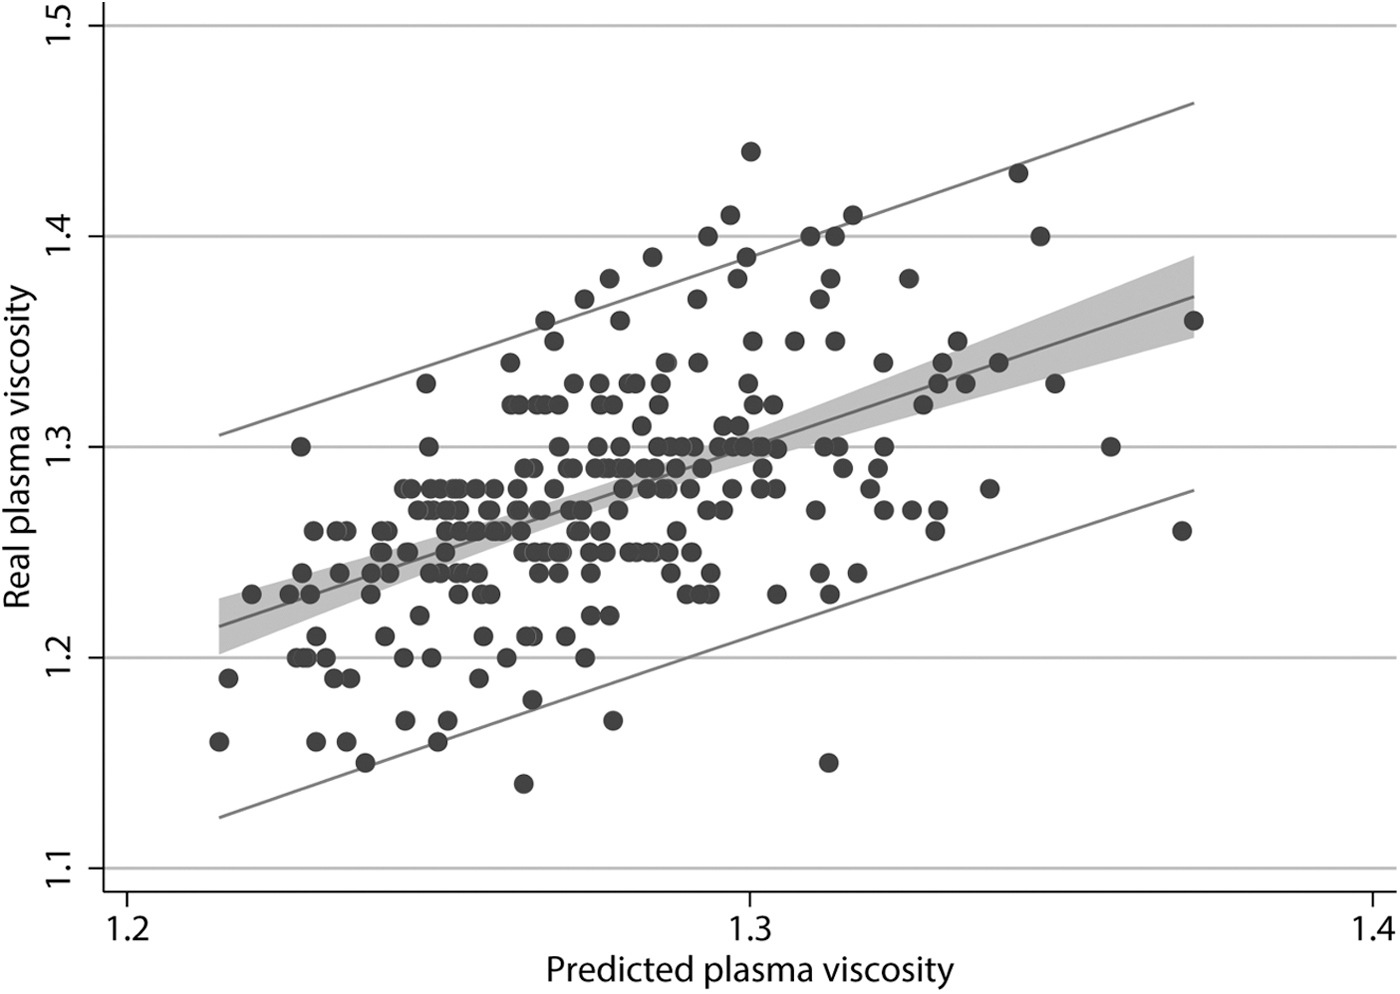
Comparison between predicted and real PV values. PV, plasma viscosity.
Discussion
The objective of our study was to determine the values of blood viscosity and PV in individuals acclimated to chronic hypoxia to establish a prediction model based on the hematocrit level, lipid profile, and other usual hematological variables. One of the main characteristics of our population is that due to one's acclimatization to the altitude, the average hemoglobin level is higher than that observed in participants living at sea level, which is the main variable in modification of viscosity.
In our study, the average hemoglobin level was 16.3 g/dl, while the hemoglobin level in individuals living at sea level was 14.3 ± 0.9 g/dl. By contrast, populations living at high altitudes (>3,800 m) had a hemoglobin level of 18.3 ± 1.3 g/dl (Stauffer et al., 2020). Although our population presents high levels of hemoglobin, these values do not exceed the limits established to consider “excessive erythrocytosis” (Villafuerte and Corante, 2016), and the other parameters measured are within normal limits; sex-based differences in hemoglobin levels were observed, and these have no major implication on the parameters measured after a multivariate adjustment.
Similarly, the level of blood viscosity reported in this study was higher than that indicated in other studies. In previous studies conducted in cities at sea level in apparently healthy individuals, the blood viscosity values were reported to be 3.31 ± 0.13 cP (Connes et al., 2004), 4.63 ± 0.45 cP (Rosenson et al., 1996), and 4.62 ± 0.5 cP (Irace et al., 2014), which were measured using methodologies similar to those employed in our study.
The present study reported an average blood viscosity level of 6.17 ± 0.94 cP. The main factor associated with these differences was the hemoglobin level since these studies involved individuals living at sea level, compared with the blood viscosity level (10.2 ± 5.9 cP) and hemoglobin level (21.1 ± 2.3 g/dl) of individuals living at 5,100 m (Stauffer et al., 2020). The increase in blood viscosity level can be due to multiple factors (increase in hemoglobin, circulating proteins, and macromolecules, etc., or chronic mountain sickness and acute mountain sickness).
Higher levels of blood viscosity increase the risk of cardiovascular diseases, such as myocardial infarction or cerebral infarction (Celik et al., 2016; Furukawa et al., 2016; Nader et al., 2019); hence, studies related to this topic are warranted. In addition, the study participants are already acclimated, but have not yet adapted, to this altitude. Acclimatization occurs when a person undergoes physiological changes as the environment changes for several days or years; meanwhile, adaptation to altitude involves genetic changes and results from an evolutionary process (Lui et al., 2015; Böning, 2019).
Our study showed that even apparently healthy young individuals living in high-altitude cities, where some of whom lived their entire lives, require high hemoglobin levels to compensate for hypoxia (Monge Cassinelli et al., 2003; Villafuerte and Corante, 2016).
Studies that evaluated factors associated with viscosity variations included measurement of the hemoglobin level as this factor has the greatest influence, as observed in our study. However, attempts have been made to develop equations that can predict viscosity using simpler hematological parameters. These equations include cholesterol, fibrinogen, serum protein, triglyceride, and LDL levels (Koenig et al., 1992; Crowley et al., 1994; Rosenson et al., 1996; Velcheva et al., 2006; Irace et al., 2014).
Prediction studies have been based on lower viscosity parameters; however, the levels of explanation using the same equations were also similar to those obtained in our study. These levels had an explained variance between 68% and 71%. For example, the study by Rosenson et al. (1996), in a model that included hematocrit, fibrinogen, and HDL levels, achieved a maximum explained variance of 63%. Similarly, the study by Crowley et al. (1994) achieved an explained variance of 62% using a model that included the hematocrit level, LDL level, platelet count, and fibrinogen level.
However, these models do not correctly predict blood viscosity values in people with high hemoglobin/hematocrit levels; for example, following the formula by Crowley et al. (1994) and considering a fibrinogen level of 200 mg/dl, the blood viscosity level would be 11 cP, while with the formula by Rosenson et al. (1996), it would be 4 cP, and with our formula, it would be 6.7 cP, which points to the inaccuracy of these formulas for scenarios such as ours. Our study achieved a higher level of explained variance without including the fibrinogen level, which is difficult to measure in our environment, and may provide greater practical utility in clinical settings.
An additional strength of our study is the inclusion of healthy individuals, but with viscosity levels higher than those reported in other studies; therefore, our equation can expand the limits of prediction and, likewise, it indicates that values above 8.5 cP have a lower predictive ability, possibly because higher values may be influenced by other factors that have not been measured or may be due to activation of other physiological mechanisms that alter them.
In our study, we identified a poor influence of platelets and lipoproteins such as HDL, LDL, or total cholesterol, which have minimal contribution to the explained variance since none of them exceeds 6%, while triglycerides have a contribution of 14%. Previous studies showed that the significance of all of these was minor and not very influential; for example, in the study by Crowley et al. (1994), the participation of platelets was 2.4%, similar to our study, while in the study by Irace et al. (2014), lipoproteins had a nonsignificant participation; finally, in this same study, they explained that triglycerides could contribute due to formation of chylomicrons and complex macromolecules that influenced viscosity. Therefore, the role of these other molecules is minor and only becomes noticeable when their values are very high.
With regard to PV, although the values reported in this study were similar to those reported in the study by Koenig et al. (1992), who obtained values of 1.26 ± 0.06 with few differences between sexes, we could not develop a predictive formula. This could be because the PV values are much lower and there may be other variables that have a greater influence on their determination. Therefore, although PV depends on the concentration of proteins, immunoglobulins, lipoproteins, and albumin, several studies have pointed out the effect of fibrinogen (Crowley et al., 1994; Rosenson et al., 1996; Nader et al., 2019); however, a limitation of our study is that we could not measure fibrinogen as it is not measured frequently and not available in all laboratories.
An elevated PV level is associated with several diseases, cardiovascular or neoplastic, hence it is recommended to measure it in clinical practice (Késmárky et al., 2008). However, our study only included young and apparently healthy individuals; hence, it is likely that the elevated values were not obtained. Another aspect to consider is that unlike blood viscosity, where large variations depend on the population evaluated, PV does not show large variations; this finding is similar to that observed in the population living at sea level, probably because the elements that may influence PV are not affected by the acclimatization process.
Limitations
Our study has limitations. First, some hematological parameters, such as fibrinogen, were not measured because they could not be easily evaluated in Cusco laboratories; however, we measured other parameters that are usually requested in the clinical setting. Second, although the viscometer is a precision instrument, PV measurement is less expensive and reproducible in various laboratories and its values are similar to those obtained in the present study; hence, developing a formula for predicting the PV level is not as important as that for predicting the blood viscosity level.
Third, family data that can be used for assessing whether acclimatization occurred for several generations were not obtained; however, Cusco is a city with high rates of miscegenation and few communities with native inhabitants for several generations. Fourth, our formula predicts blood viscosity well in healthy highlanders, but validation is still required in people with comorbidities or acute mountain sickness since in them, viscosity is increased by factors other than hemoglobin.
Finally, this study did not consider the effects of blood viscosity variation at different stress levels or variations according to vascular caliber; these variations and their possible impact on physiology were recognized. However, these variations cannot be used directly to measure blood viscosity levels; hence, multiple prediction models without a clear physiological impact should be developed (Ascolese et al., 2019).
Conclusions
In a population living at high altitude, the level of blood viscosity is extremely high and is mainly influenced by the hematocrit level. This finding indicates that this population has chronic high blood viscosity levels, which may be predicted using other commonly used blood elements, although the predictive ability increases when the viscosity level is lower than 8.5 cP.
Footnotes
Authors’ Contributions
All authors contributed to the conception or design of the work; acquisition, analysis, or interpretation of data; drafting of the work; critical revision of the manuscript for important intellectual content; and final approval of the version to be published.
Data Availability Statement
The data that support the findings of this study are available from the corresponding author upon reasonable request.
Author Disclosure Statement
No competing financial interests exist.
Funding Information
This work was supported by Fondo Nacional de Desarrollo Científico, Tecnológico y de Innovación Tecnológica (FONDECYT – Perú, code: 378-2019) and Universidad Andina del Cusco.