
Abstract
Bellovary, Bryanne N., Andrew D. Wells, Zachary J. Fennel, Jeremy B. Ducharme, Jonathan M. Houck, Trevor J. Mayschak, Ann L. Gibson, Scott N. Drum, and Christine M. Mermier. Could orthostatic stress responses predict acute mountain sickness susceptibility before high altitude travel? A pilot study. High Alt Med Biol. 24:19–26, 2023.
Purpose:
This study assessed head-up tilt (HUT) responses in relation to acute mountain sickness (AMS)-susceptibility during hypoxic exposure.
Materials and Methods:
Fifteen participants completed three lab visits: (1) protocol familiarization and cycle maximal oxygen consumption (VO2max) test; (2) HUT test consisting of supine rest for 20 minutes followed by 70° tilting for ≤40 minutes; and (3) 6 hours of hypobaric hypoxic exposure (4,572 m) where participants performed two 30-minute cycling bouts separated by 1 hour at a 50% VO2max workload within the first 3 hours and rested when not exercising. During HUT, systolic blood pressure (SBP), diastolic blood pressure, heart rate (HR), and variability (blood pressure variability [BPV] and HR variability [HRV]) were measured continuously. The AMS scores were determined after 6 hours of exposure. Correlations determined relationships between HUT cardiovascular responses and AMS scores. Repeated-measures analysis of variance (ANOVA) assessed differences between those with and without AMS symptoms during HUT.
Results:
Higher AMS scores correlated with greater change in SBP variability (r = 0.52, p = 0.048) and blunted changes in HRV (root mean square of successive differences between normal heartbeats r = 0.81, p = 0.001, percentage of adjacent normal sinus intervals that differ by more than 50 milliseconds [pNN50] r = 0.87, p < 0.001) during HUT. A pNN50 interaction (p = 0.02) suggested elevated cardiac sympathetic activity at baseline and a blunted increase in cardiac sympathetic influence throughout HUT in those with AMS (pNN50 baseline: AMS = 26.2% ± 15.3%, no AMS = 51.0% ± 13.5%; first 3 minutes into HUT: AMS = 17.2% ± 19.1%, no AMS = 17.1% ± 10.9%; end of HUT: AMS = 6.2% ± 9.1%, no AMS 11.0% ± 10.0%).
Conclusions:
The results suggest autonomic responses via HUT differ in AMS-susceptible individuals. Changes in HRV and BPV during HUT may be a promising predictive measurement for AMS-susceptibility, but further research is needed for confirmation.
Introduction
During head-up tilt (HUT), cardiovascular homeostasis is challenged as venous blood pools in the lower extremities impairing venous return and sympathetic nervous system (SNS) activity increases to maintain blood pressure (BP) (Freeman et al, 2011). This represents the orthostatic stress response. Tolerance to an orthostatic challenge is reduced at high altitude (HA; >2,500 m above sea level), resulting in SNS vasoconstriction failure and syncope in healthy, young adults (Basnyat et al, 2004; Blaber et al, 2003; Fulco et al, 1985; Mytton et al, 2008).
Reduced orthostatic tolerance was observed as a shorter time to presyncope (e.g., feeling faint) at 3,660 m and a greater fall in systolic blood pressure (SBP) at 5,200 m than at sea level (Blaber et al, 2003; Mytton et al, 2008). This decreased tolerance may be related to hypoxia-induced vasodilation in the lower extremities at rest (Huang et al, 2009). At sea level and HA, the inability to respond to an orthostatic challenge can result in dizziness, lightheadedness, weakness, fatigue, headache, presyncope, and syncope (Freeman et al, 2011). Many of these symptoms are also present in those suffering from acute mountain sickness (AMS) following ascent to HA (Beidleman et al, 2013; Sampson et al, 1983).
Literature is sparse in comparing responses with orthostatic stress at HA between those who do and do not develop AMS. Of the researchers investigating orthostatic challenges in hypoxic environments (Blaber et al, 2003; Davis et al, 2013; Mytton et al, 2008; Thomas et al, 2010), only Mytton et al (2008) determined differences in SBP within 15 seconds of standing between those with and without AMS using the Lake Louise scale (LLS) (Roach et al, 2018). However, there were no differences in SBP reductions between the two groups.
This could be because participants stood upright after lying supine for 2 minutes such that the lower extremity muscle contractions and assisted with venous return compared with HUT that minimizes a muscle pump (Mytton et al, 2008). Though orthostatic challenges were previously performed at sea level and HA, researchers have yet to determine whether orthostatic stress responses at sea level correlate with AMS scores (Blaber et al, 2003; Davis et al, 2013; Fulco et al, 1985; Mitchell et al, 2018; Mytton et al, 2008; Thomas et al, 2010). There may be a link regarding blunted SNS-mediated heart rate (HR) and vasoconstrictive responses leading to symptoms displayed in orthostatic hypotension and AMS, respectively (Freeman, 2008; Turner et al, 2021).
If HUT responses differ between those who are and are not AMS-susceptible, then cardiovascular changes during HUT observed in those with AMS may predict AMS-susceptibility before HA exposure. The purpose of this study was to determine whether different cardiovascular responses during HUT occurred in AMS-susceptible individuals. If so, this would be the first study to suggest HUT responses as a predictor of AMS-susceptibility before HA travel.
Materials and Methods
Participants
Twenty-one people volunteered to participate in this study; however, six withdrew due to the SARS-CoV-2 (COVID-19) pandemic. This left 15 (10 males) participants aged 20–29 years who completed the study protocol (Table 1). Participants were in good health, defined as answering “no” to all PARQ+ questions (Bredin et al, 2013) and having no known diseases or symptoms according to the American College of Sports Medicine pre-participation screening guidelines (Liguori et al, 2021).
Participant Descriptors
Significant difference (p < 0.001).
50% PO, workload at 50% of VO2max; AMS, acute mountain sickness; %BF, percent body fat; F, females; M, males; PPO, peak power output; VO2max, maximal oxygen consumption; W, watts.
Inclusion criteria required that participants were residents in the Albuquerque, NM area (1,610–1,620 m, low altitude; Bärtsch and Saltin, 2008) for at least the past year, non-smokers, and not pregnant. BP was measured via auscultation before starting each testing session to confirm that participants' SBP was <130 mmHg and diastolic blood pressure (DBP) was <80 mmHg after 5 minutes of seated rest. Each participant provided written informed consent approved by the University of New Mexico's Office of the Institutional Reviews Board for human subject research.
Experimental design
All participants completed three testing sessions. The first visit was baseline testing and familiarization. Participants completed a maximal oxygen consumption test (VO2max) on an electronically braked cycle ergometer (Excalibur Sport, Lode B.V., Lode Medical Technology, Groningen, Netherlands). Participants were familiarized with the tilt table and a 70° tilt. On the second visit, participants performed the HUT test to determine their orthostatic stress response and time to presyncope, if present.
On the third visit, participants were exposed to hypobaric hypoxia at 4,572 m, similar to previous research (Davis et al, 2013; Huang et al, 2009; Roach et al, 2000), for 6 hours. In the hypobaric chamber, participants performed two, 30-minute cycling bouts at the workload corresponding to 50% of their VO2max on a mechanically braked cycle ergometer (Monark 828E, Sweden). The cycling bouts were completed within the first 3 hours of hypoxic exposure, with at least 1 hour separating the bouts. Exercise bouts were performed to increase the likelihood of AMS in 6 hours of HA exposure (Roach et al, 2018; Roach et al, 2000). Participants could read or interact with video screens while seated during the resting periods. They were also permitted to eat a standardized light snack (380 calories) and drink water ad libitum.
There were at least 48 hours between testing sessions. Participants were instructed to refrain from alcohol for 24 hours, strenuous exercise for 12 hours, and caffeine for 4 hours before each session. They were instructed to maintain their regular daily living activities throughout the duration of their participation.
Procedures
Maximal oxygen consumption test
Before the VO2max test, participants' height and body weight were measured and body composition was estimated by the Jackson-Pollock three-site, sex-specific skinfold method (Jackson and Pollock, 1978; Jackson et al, 1980). A VO2max test to volitional fatigue was performed on an electronically braked cycle ergometer. The test was terminated when the pedal cadence could no longer be maintained above 60 rpm (considered volitional fatigue).
Participants performed an individualized ramp protocol, based on sex, body weight, and self-reported fitness level, designed to result in exhaustion in 8–12 minutes (Yoon et al, 2007). A metabolic cart (TrueOne 2400 Metabolic System; ParvoMedics, Sandy, UT) collected expired gases, VO2max was determined using 11-breath averaging from breath-by-breath data (Robergs, 2001), and peak power output was recorded. The primary criterion to verify VO2max was a change in VO2 < 150 ml/min with increasing workload during the last minute of the test. Secondary criteria (RER >1.10, HR within ±10 bpm of participants' age-predicted maximum [220 − age], and RPE >17) were used if the primary criterion was not met (Beltz et al, 2016).
HUT test
Participants were strapped across the chest and above the knee during supine rest on the tilt table to limit contraction of leg muscles during HUT. After 20 minutes of rest, participants were rapidly tilted to 70° head-up and remained in this position up to 40 minutes, or until presyncope (e.g., verbal expression of feeling faint) (Kenny et al, 2000). Time to presyncope was from start of tilt to end of tilt. Participants were instructed to remain still and refrain from voluntary muscle contractions.
Cardiovascular measurements
A noninvasive continuous BP monitor ([NCBPM] Caretaker 4; Empirical Technologies Corporation, Charlottesville, VA) recorded beat-to-beat BP and HR via automated finger cuff positioned on the index or middle finger of either hand. This device was previously determined to produce reliable and accurate beat-to-beat measures compared with central arterial BP (Baruch et al, 2014; Kwon et al, 2022). The NCBPM was manually calibrated before each trial using a sphygmomanometer and stethoscope per the manufacturer guidelines. Oxygen saturation (SpO2), by finger pulse oximetry (Shanghai Berry Electronic Tech Co., Shanghai, China), was wirelessly transmitted to the NCBPM.
Autonomic nervous system measurements
A chest strap HR transmitter (H1; Polar USA) wirelessly transmitted HR to a Polar receiver (V800; Polar USA) to only obtain HR variability (HRV). The data were downloaded and analyzed using Kubios software (HRV Standard, Kubios version 3.3.1) (Tarvainen et al, 2014). During HUT, samples included baseline (5-minute sample after 10 minutes of supine rest), first 3 minutes of HUT, and end of HUT (final 5 minutes of the HUT protocol). A low threshold was set to remove artifact. The low threshold was used because HR was expected to increase above resting levels during HUT (Tarvainen and Niskanen, 2012).
The Kubios software indicates that HRV samples may be inaccurate due to low-quality data when >5% of the data need correction. If any participant required a >5% correction, they were excluded from analysis. Time-domains were used to determine the standard deviation (SD) of normal sinus-initiated inter-beat intervals (SDNN), root mean square of successive differences between normal heartbeats (RMSSD), and percentage of adjacent normal sinus intervals that differ by more than 50 milliseconds (pNN50). A lower SDNN, RMSSD, and pNN50 indirectly suggest greater sympathetic (SNS) cardiac tone (Shaffer and Ginsberg, 2017).
Blood pressure variability (BPV) was defined as the SD of continuous BP data from baseline supine rest to the end of HUT. SBP, DBP, and MAP data were averaged over 5-minute intervals (Stergiou et al, 2016). If the HUT test lasted 60 minutes (supine rest = 20 minutes, tilt = 40 minutes), there were a total of 12 mean values for each variable. The SD of the first four mean values was calculated to yield the variability during supine rest. The following eight mean values (if the tilt lasted 40 minutes) yielded the SD for variability during the tilt. A greater SD suggest greater BPV during the respective time points (di Rienzo et al, 1983; Stergiou et al, 2016).
High-altitude protocol
Participants were exposed to hypoxia simulating 4,572 m during cycling exercise (total 1 hour) and rest (5-hour) in a customized hypobaric chamber (6 hours total). Simulated ascent increased by ≤305 m per minute to prevent confounding symptoms related to a rapidly simulated ascent (e.g., ear pain, dizziness, lightheadedness). During the first 3 hours of exposure, participants performed two, 30-minute cycling bouts at 50% of their normobaric VO2max at 75 rpm (Roach et al, 2000). Cycling bouts were separated by at least 1 hour. Participants were not allowed to sleep.
AMS assessment
The AMS was assessed using the modified LLS (AMS score [Roach et al, 2018]). The AMS scores were recorded after 6 hours of hypobaric hypoxic exposure and were correlated with the hemodynamic changes measured during HUT. Classification as being positive for AMS required scores ≥3 with headache as opposed to being negative for AMS (scores <3) (Roach et al, 2018).
Statistical analysis
All statistical analyses were performed using SPSS (version 26.0, IBM SPSS Statistics). All data were reported as mean ± SD. Data were visually free of outliers, normally distributed, and did not violate any assumption tests. Independent t-tests identified differences in participant characteristics, time to presyncope during HUT, and AMS scores from hypobaric hypoxic exposure between those with and without AMS.
Mixed-effects analysis of variance (ANOVA) determined differences between those with and without AMS for cardiovascular changes from supine rest, first 3 minutes of HUT, and end of HUT. Cohen's d effect sizes (ES) were calculated for all pairwise comparisons (Sullivan and Feinn, 2012) where values of 0.2, 0.5, and 0.8, were small, medium, and large effects, respectively (Cohen, 2013). Mean differences between the HUT time points were correlated with AMS scores. The a priori alpha level was set to p < 0.05.
Results
Participant descriptors
The baseline group descriptors (Table 1) were not significantly different between those with AMS (n = 8) and those without AMS (n = 7). For HRV (SDNN, RMSSD, pNN50), three individuals were excluded from statistical analyses as their data had >5% artifact (with AMS n = 1, without AMS n = 2). All of those with AMS experienced at least a mild headache and ≥1 other self-reported symptom(s). There were four males and four females categorized as with AMS and six males and one female categorized as without AMS.
Physiological responses to HUT test
Mean, SD, and ES for cardiovascular responses to HUT are shown in Table 2. The SBP, DBP, and MAP variability increased whereas HRV measures (SDNN, RMSSD, and pNN50) decreased from baseline to end of HUT for all participants (p < 0.04). There were large, non-significant differences between those with and without AMS at end of HUT for BPV and at baseline for HRV as indicated by Cohen's d (Table 2).
Comparisons Between Those With Acute Mountain Sickness (AMS) (n = 8) and Without AMS (n = 7) During the Head-Up Tilt Test and Correlations with Physiological Responses to AMS Scores
Cohen's d classifications: 0.2 = small, 0.5 = medium, 0.8 = large.
Blood pressure variability (mmHg): SD of the respective blood pressures averaged over 5-minute intervals. Baseline = duration of supine rest. End of HUT = duration of tilt.
HRV: with AMS n = 7; without AMS n = 5, participant data removed due to >5% artifact accumulation.
p within = significant difference between end of HUT and baseline and for all subjects.
p between = significant difference for all values for with AMS and without AMS.
Interact. = interaction, indicating the significant difference from baseline to end of HUT change between with AMS and without AMS.
Significant difference for time to presyncope tested by independent t-test (p > 0.05).
Significant difference (p < 0.05).
DBP, diastolic blood pressure; ES, effect size; HR, heart rate; HUT, head-up tilt; MAP, mean arterial pressure; pNN50, percentage of adjacent normal sinus intervals that differ by more than 50 milliseconds; RMSSD, root mean square of successive differences between normal heartbeats; SBP, systolic blood pressure; SDNN, standard deviation of normal sinus-initiated interbeat interval; SpO2, oxygen saturation.
In addition to BPV and HRV, many measures (SBP, DBP, MAP, SpO2, and time to presyncope) had medium to large, non-significant differences at end of HUT. Six participants ended the HUT test before 40 minutes expired due to presyncope (four males and two females; three with AMS and three without AMS). SpO2 was lower in those with AMS compared with those without AMS. SBP, DBP, and MAP decreased, HR increased, and SpO2 did not change with HUT for all subjects.
The only interaction suggested that pNN50 started off higher during supine rest, decreased to a greater degree when HUT started, and decreased to a lesser degree by the end of HUT in those without AMS compared with those with AMS (p = 0.02). Mean differences (Table 3) during HUT for SBP variability, RMSSD, and pNN50 positively correlated with AMS scores (p = 0.048, 0.001, < 0.001, and 0.018, respectively, Fig. 1).
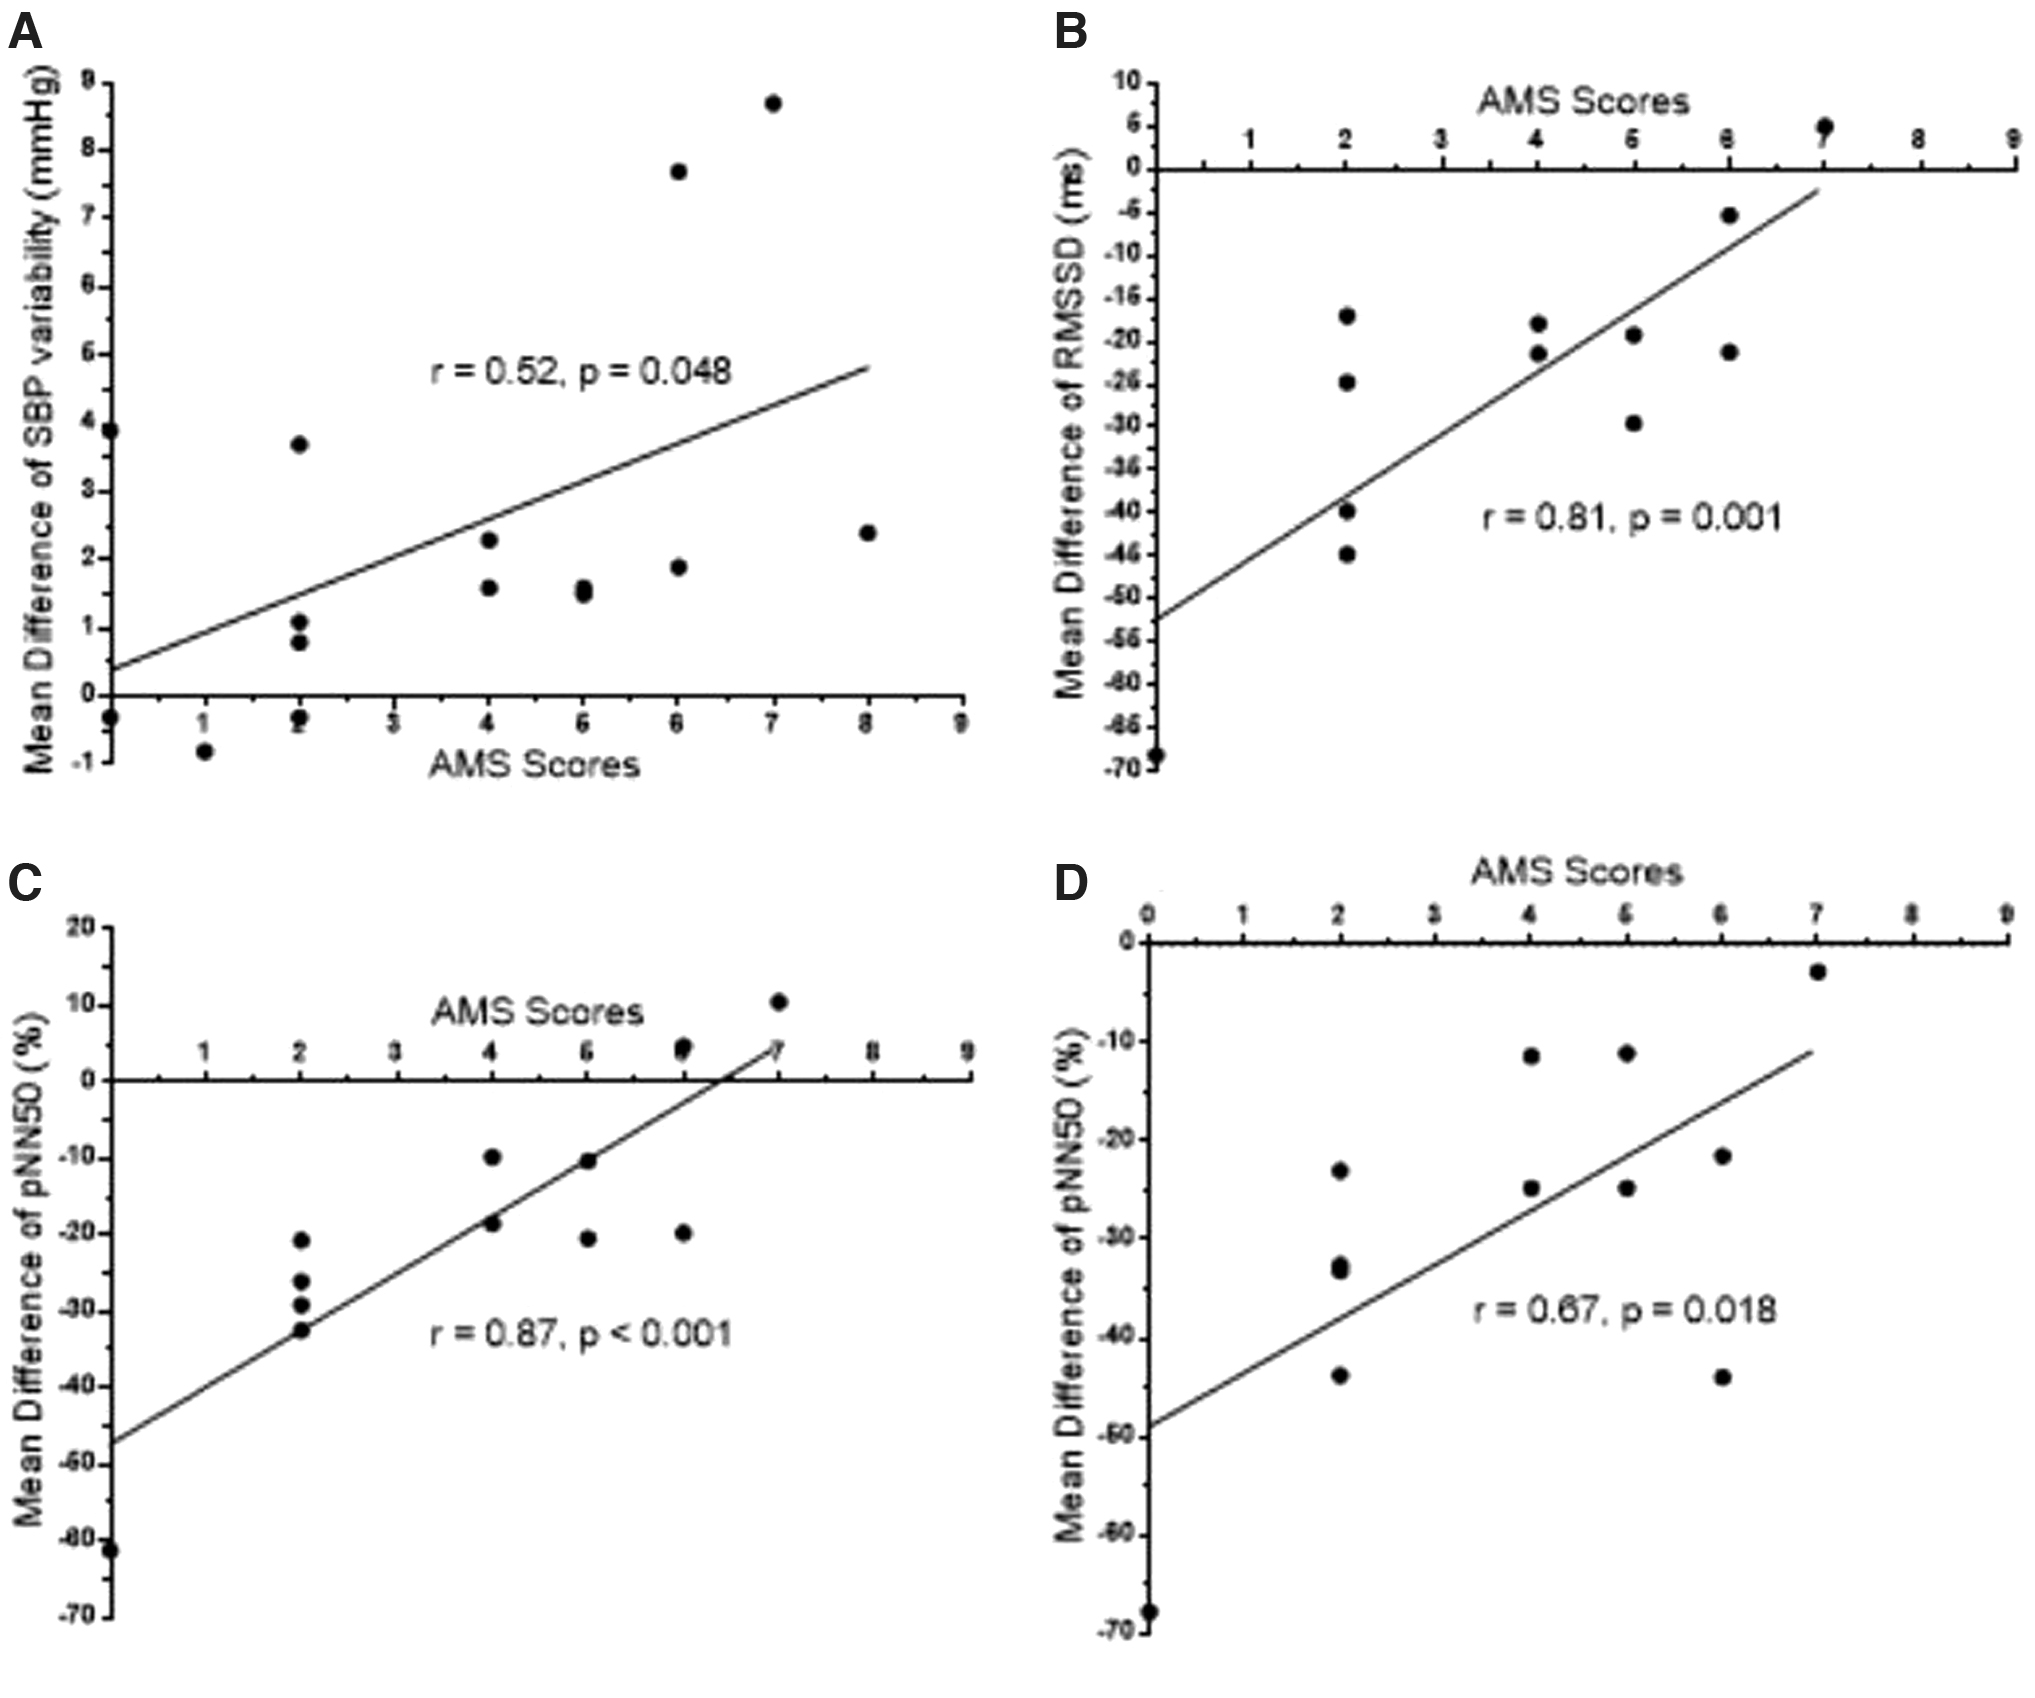
Correlations between AMS scores and mean differences for
Mean Differences Over Time During the Head-Up Tilt Test Correlated to Lake Louise Scale Scores (With Acute Mountain Sickness [AMS] n = 8; Without AMS n = 7)
Mean difference = first 3 minutes of tilt minus baseline, end of HUT minus first 3 minutes of tilt, end of HUT minus baseline.
Blood pressure variability (mmHg): SD of the respective blood pressures averaged over 5-minute intervals. Baseline = duration of supine rest. End of HUT = duration of tilt.
HRV: with AMS n = 7; without AMS n = 5, participant data removed due to >5% artifact accumulation.
r = correlation coefficient between change from baseline to end of HUT and AMS scores.
Significant correlation with AMS scores (p < 0.05).
Discussion
The purpose of this study was to determine whether cardiovascular responses to HUT could be used to identify AMS-susceptible individuals during hypobaric hypoxia exposure simulating 4,572 m. The major finding was blunted cardiac SNS activity at onset of HUT in those who developed AMS. Secondarily, higher AMS scores correlated with a larger SBP variability and smaller HRV changes during HUT.
The interaction effect of time and group (those with and without AMS) on pNN50 indicated that those with AMS had fewer adjacent long R-R intervals (≥50 milliseconds) during supine rest compared with those without AMS, suggesting that there was a blunted SNS response during HUT in those with AMS. This trend was also observed with RMSSD, which had a strong, positive correlation with AMS scores (same as pNN50) when HUT began. This suggests that those with AMS had greater SNS tone, leading to higher HRs at supine rest. This high SNS activity may mean there was less cardiovascular reserve for these individuals, leading to a greater decrease in HR when HUT began for those with AMS (Blaber et al, 2003).
Though HRV (pNN50 and RMSSD) is an indirect assessment of autonomic responses, a noninvasive approach may yield less confounding SNS input for participants uncomfortable with direct assessment although at the risk of losing measurement sensitivity (Blaber et al, 2003). In the future, determining mechanistic reasonings for the HRV trends during HUT observed in the present study may better provide casual effects that better link to AMS-susceptibility.
The SBP, DBP, and MAP were lower during HUT compared with supine rest; however, those without AMS may experience a faster return to baseline by the end of HUT compared with those with AMS as suggested by medium, non-significant differences. An expected response to orthostatic stress, without additional stressors (e.g., hypoxia), is increased SNS activity and peripheral vasoconstriction as MAP attempts to be maintained (Blaber et al, 2003; Freeman, 2008; Freeman et al, 2011).
The SNS-mediated vasoconstriction can be indirectly assessed via BPV (Lanfranchi et al, 2005; ten Harkel et al, 1993). Accordingly, we have shown that individuals with higher AMS scores demonstrated greater oscillations in SBP upon postural shift (r = 0.52). The oscillations are represented by frequent increases and decreases in peripheral SNS burst activity, leading to a corresponding increase and decrease in vasoconstriction (Burke et al, 1977).
Despite the possible increase in SNS-mediated vasoconstriction, average BP decreased by the end of HUT with medium to large, non-significant differences between those with and without AMS. This suggests a difference in autonomically controlled cardiovascular function. Future researchers should consider more direct assessments of vascular SNS activity to help determine whether the HUT BP responses observed in those with AMS were the result of a blunted baroreflex sensitivity leading to disrupted BP control and insufficient and non-sustainable vasoconstriction (Niebauer et al, 2020), along with other influential BP mechanisms (e.g., neural vasoconstrictive mechanisms, adrenergic vasodilatory mechanisms, and nitric oxide production) (Lanfranchi et al, 2005).
Initially, it seemed there were SpO2 differences between those with and without AMS independent of HUT. However, this may be because of the equipment used. The SpO2 difference between groups was 1%–2%, which could be due to the manufacturer reported margin of error (±2%) of the pulse oximeter. This suggests that baseline SpO2 may not predict AMS-susceptibility.
Limitations
This study is limited by a) participants all residing at ∼1,600 m (Bärtsch and Saltin, 2008), b) measuring HA responses over only 6 hours, and c) the limited sample size of this pilot study. Though all participants were acclimatized to 1,600 m for at least 1 year before taking part in this study, adults living at sea level may respond differently to HUT and HA exposure. The authors acknowledge that AMS may take longer than 6 hours of HA exposure to develop for some individuals. To partially offset this, all participants exercised during HA exposure.
Yet, longer bouts of hypoxic exposure may yield different results. Ten out of 12 measures at end of HUT had medium to large, non-significant differences (Cohen, 2013) between those with and without AMS; however, this study was underpowered due to the COVID-related health crisis during data collection. With additional participants, it is likely that significant differences would be realized between those with and without AMS.
Future directions
This pilot study provides a basis for future research projects due to the medium to large, non-significant differences demonstrated between groups during HUT. When larger sample sizes can be recruited, it would be ideal to stratify AMS categorizations between none, mild, moderate, and severe to better illustrate potential predictability of HUT responses. Researchers could focus on autonomic-mediated cardiac and vasculature responses, and the impact of altered central nervous system (i.e., brain) control on HR and BP changes. This could yield threshold cut-offs for predicting AMS severity and allow for testing sensitivity and specificity.
Conclusion
In conclusion, HRV and BPV during HUT may be promising measurements to determine AMS-susceptibility before HA exposure. Those with AMS tended to have reduced HRV and higher BPV. Future research should address more detailed mechanistic connections for HRV and BPV during HUT and hypoxic exposure.
Footnotes
Authors' Contributions
Study concept and design (B.N.B., C.M.M.); data acquisition (B.N.B., A.D.W., Z.J.F., J.B.D., J.M.H., T.J.M.); data analysis (B.N.B.); drafting of the article (B.N.B.); critical revision of the article (all authors); and approval of final article (all authors).
Author Disclosure Statement
No competing financial interests exist.
Funding Information
Partial funding provided by the University of New Mexico's Graduate and Professional Student Association's New Mexico Research Grant; University of New Mexico Exercise Science program.