
Abstract
Medical countermeasure stockpiles in the United States are designed to support healthcare workers and the public during public health emergencies; they include supplies of personal protective equipment (PPE). As part of typical PPE manufacturing processes, appropriate test methods are used to ensure that the devices provide adequate protective performance. At the time of manufacture, performance is often measured and weighed against an objective standard of quality, resulting in a pass or fail attribute being assigned to individual PPE items and thence to production lots. Incorporating periodic performance testing for stockpiled PPE can ensure that they maintain their protective qualities and integrity over time while in storage. There is an absence of guidance regarding how to design quality assurance programs for stockpiled PPE. The applicability of the Lot Quality Assurance Sampling (LQAS) approach to stockpiled PPE was examined in a previous study that compared and contrasted different sample sizes in recovering the true percentage of defective units in large lots in the LQAS framework. The current study carries this line of inquiry forward by integrating PPE degradation over time and comparing different sampling time intervals in recovering the true underlying degradation rate. The results suggest that product degradation is more easily detected when tested at shorter time intervals and for higher degradation rates. They further suggest that sampling interval groupings can be made based on the proficiency with which they recover the true underlying degradation rate.
Medical countermeasure stockpiles in the United States, including supplies of personal protective equipment, are designed to support healthcare workers and the public during public health emergencies. Incorporating periodic performance testing for stockpiled PPE can ensure that they maintain their protective qualities and integrity over time while in storage.
In the United States, stockpiles of medical supplies and equipment at the federal, state, and local levels were created with funding and initiatives associated with the Public Health Security and Bioterrorism Preparedness and Response Act of 2002. 1 Since then, large volumes of personal protective equipment (PPE) have been acquired. PPE such as respirators, surgical gowns, and gloves are intended to protect healthcare and emergency responders from the hazards of caring for individuals with contagious diseases and contain the spread of such diseases.2-4 Predictions of the amount of PPE and the rate at which it will be needed during a public health emergency suggest that PPE consumption will exceed the amount of product that manufacturers can produce.3,5-14 Therefore, millions of units of PPE are stored across the country in readiness for rapid response in facility-level and public health (local, state, federal) stockpiles.
While it is reasonable to assume that PPE provided through the normal supply chains will give the promised protection, component materials may degrade while in a stockpile.15-22 An example is the commonly stockpiled N95 filtering facepiece respirator (FFR), recommended for protection against a variety of hazards that may be faced during public health emergencies. Most N95 FFRs incorporate filtering media embedded with electrostatic charges. The embedded electrostatic charge may dissipate during extended stockpiling, thereby potentially decreasing the filtration efficiency.21,23-25 Thus, stockpiled N95 FFRs, as well as other PPE, may degrade to an unacceptable level while in the stockpile, at a rate influenced by variations inherent in varying designs, materials of construction, materials used in packaging, and stockpile storage conditions.
Given the likelihood of long-term storage, the potential for degradation, and the possible lack of control over storage conditions, many PPE manufacturers provide shelf-life and expiration guidelines. However, when stored in a suitable environment, stockpiled products may be effective well beyond their labeled expiration dates, and development of a suitable shelf-life extension program would be beneficial.
Unsubstantiated stockpile testing schemes may prove unnecessarily expensive. In addition to the costs of performing the tests and the PPE used in the testing, over-testing without careful sampling plan design may lead to discarding an excessive number of relatively good lots due to sampling variation. 26
In a previous study, we examined the applicability of a Lot Quality Assurance Sampling (LQAS) approach to stockpiled PPE and posited it as a mechanism to manage the quality of stockpiled PPE over time and potentially realize a PPE-specific shelf-life extension program. 27 Given the potential stability of PPE when stored in a suitable environment, our previous article compared and contrasted different sample sizes in terms of their ability to accurately estimate a fixed true quality level over a restricted number of samples. However, in light of the potential for PPE to degrade over time, true levels of lot quality can be dynamic and a potentially moving target. Identifying stockpiled PPE that are degrading, and accurately identifying the rate of degradation, may be a desirable component to a stockpiled PPE LQAS. For example, degradation of numerous models and lots in a localized area in the stockpile may indicate localized storage conditions that are less than adequate. Additionally, identification of unacceptable levels of degradation in a single model and/or a single lot can allow for targeted recycling, thereby limiting waste.
Therefore, questions remain regarding how often sampling should be done in order to detect degradation processes and to estimate the rate at which the PPE is degrading. The current study addresses this missing piece by integrating PPE degradation over time and comparing the consistency of different sampling time intervals in recovering the simulated degradation rate. The primary research questions of the current study are:
Can repeated performance testing of PPE samples detect degradation in stockpiled PPE? Do the trends seen over repeated sampling accurately reflect the rate of degradation? Do different time intervals of repeated performance testing differ in terms of the proficiency with which they recover the degradation rate?
Methods
Computer Simulation
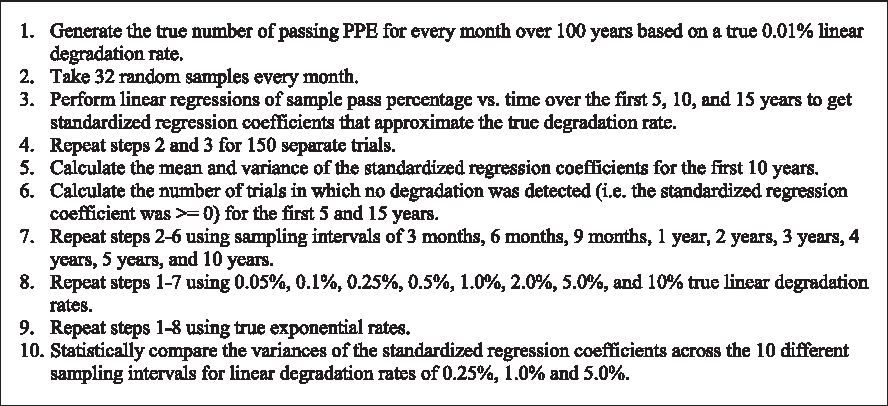
The research questions posed were answered through a series of statistical simulations. The study used a computer simulation to “create” batches of stockpiled PPE over the course of their lifetime with known quality levels at each stage in their life cycle. It also allows for the simulated PPE samples to be sampled to determine if the parameters that were “created” can be recovered. This technique makes it possible to vary applicable quality parameters (ie, the actual percent of passing units in a lot and the rate at which that percent declines as degradation occurs over time) and create real-life stockpile contexts. A common desktop mathematical software package, R version 3.5.0, was used to conduct the simulation and analyze the results. 28 The steps taken in the simulation are briefly summarized in Figure 1.
Simulation Steps
In order to integrate PPE degradation over time, lots or batches of stockpiled PPE were created and tracked over the course of their lifetime. Lots over time were simulated through the use of sets containing the total number of PPE items out of lots of 100,000 that would pass a performance test. A set for each degradation parameter was generated, containing entries for the true number of passing units every month over a 100-year lifespan. At year zero, all PPE in each lot were considered to have “passed” an applicable performance test (eg, the tests used by NIOSH for respirator certification or the tests designated by the FDA for clearing surgical or isolation gowns). At subsequent times, a proportion of the lot was set to “fail” the performance test. In total, 9 different linear degradation rates were simulated in which a fixed number of additional units become defective each year. These rates were 0.01%, 0.05%, 0.1%, 0.25%, 0.5%, 1.0%, 2.0%, 5.0%, and 10% and corresponded to an additional 10, 50, 100, 250, 500, 1,000, 2,000, 5,000, and 10,000 units becoming defective every year. The choice of using a linear degradation model was made for conceptual simplicity. Exponential degradation was also modeled as a comparison, but other forms of nonlinear degradation could have been selected instead.
Once these series of sets were created to represent the PPE lots with known degradation rates over the course of their lifetime, it was then possible to collect random samples from them over time. Sampling time intervals of 1 month, 3 months, 6 months, 9 months, 1 year, 2 years, 3 years, 4 years, 5 years, and 10 years were examined. Although some of the time intervals examined are not likely to be selected for use in actual stockpiles, they were chosen for comparison purposes. A fixed sample size of 32 PPE units was selected to be used for each sample. As such, 32 random numbers from the lot of 100,000 (representing single units of PPE) were selected from each designated time point with replacement. The sample fail rate was then computed according to Equation 1:
where
Results
Detecting and Determining Degree of Degradation
In response to the first research question posed, concerning the utility of periodic testing, the results of the simulation suggest that repeated performance testing of PPE samples can detect degradation in stockpiled PPE, but it depends on the time interval of repeated testing along with the magnitude of the degradation. In order to examine this research question, linear regressions were performed on sample results over a 15-year period. For each individual trial, the percent of PPE passing for each sample was used as the dependent variable, and time was used as the independent variable. The standardized regression coefficients, or slopes of the fitted lines, directly measured the predicted degradation rate. Because each lot was simulated to degrade over time, the measured pass rate would be expected to decrease in consecutive samples, and a negative regression slope should result. A negative regression slope in any given trial of repeated testing, therefore, suggests that the simulated degradation was detected. A slope of zero, or a positive slope, would denote a trial in which there was no detection of any degradation—even though degradation did exist. This does not necessarily mean that no defective units were found, but rather that linear regression did not find a consistent increase in defective units over time. These failures to detect the applied degradation could be considered “false negatives”—in other words, testing did not discern the decrease in the quality of the lot. If the entire lot were tested at each time, the regression slope would recover the degradation rate applied to the lot. For smaller samples, variability due to sampling will affect the accuracy of the recovered slope. Figure 2 provides an illustration of one of the regressions derived from the study in which a negative standardized regression coefficient was found.
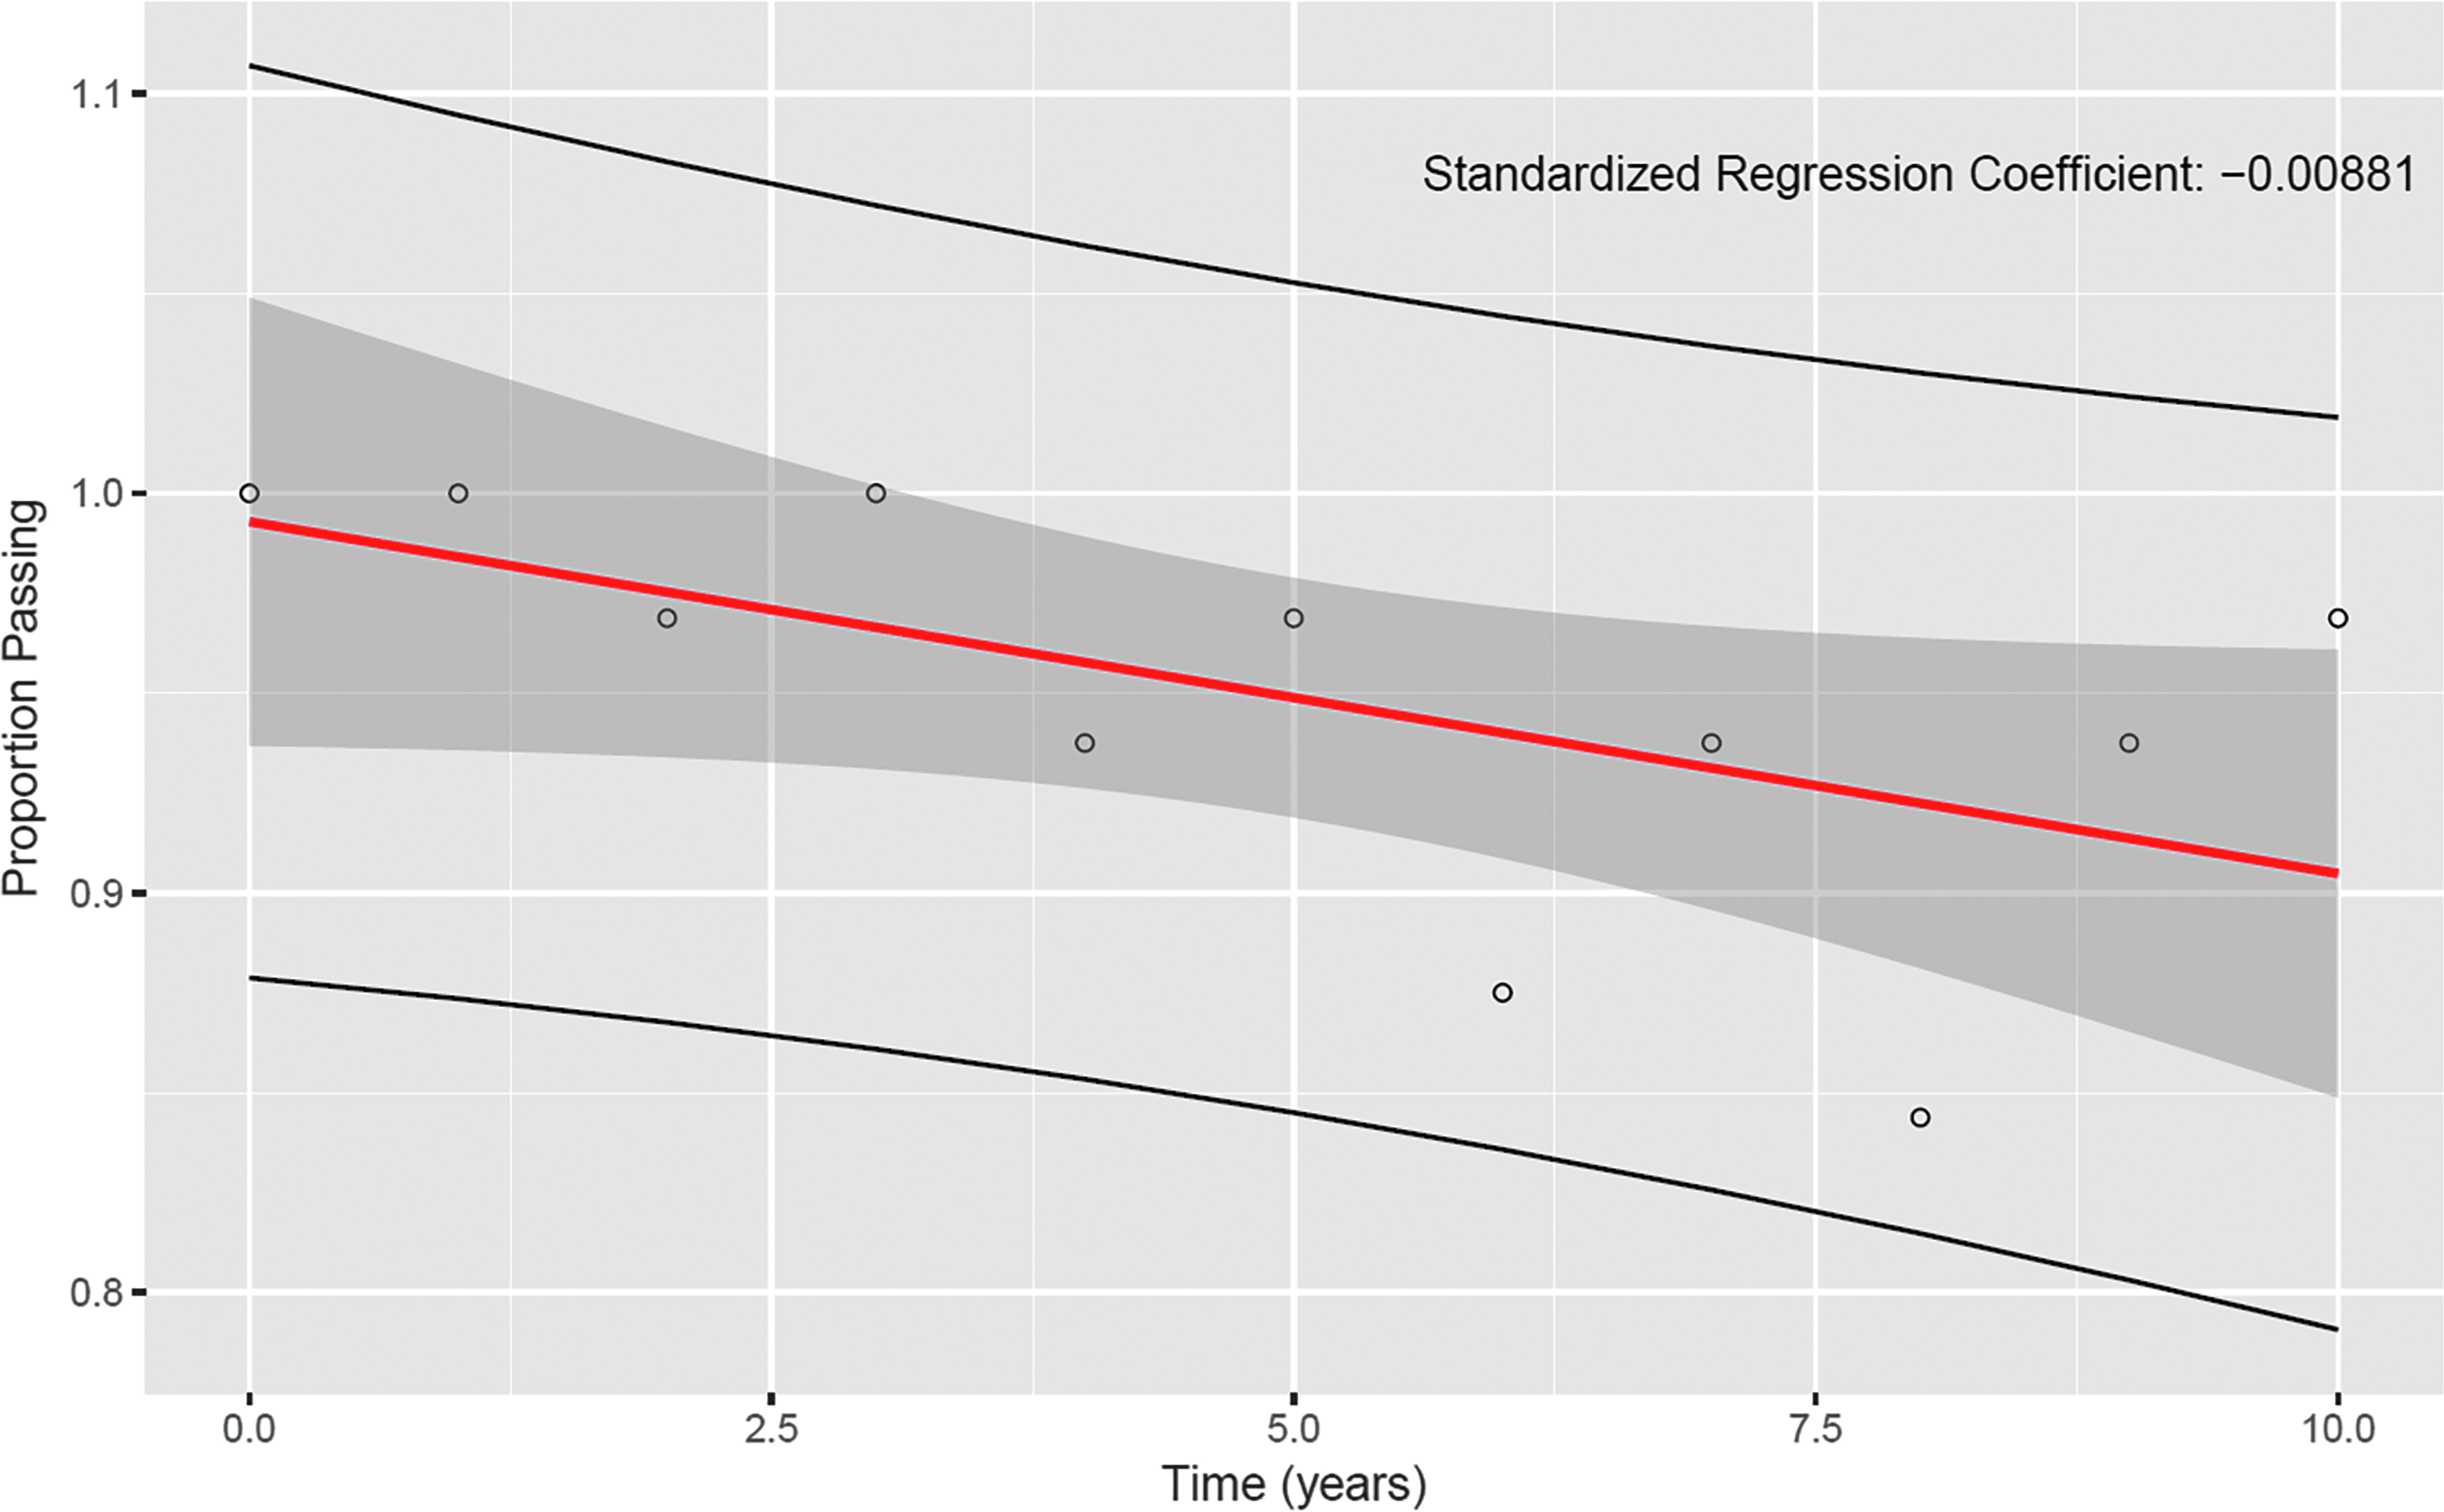
An example linear regression over 10 years for yearly sampling intervals and 1.0% linear degradation rate
Table 1 reports the number of trials out of 150 in which sampling failed to detect degradation for specific sampling intervals, denoted by the rows, and the true linear degradation rate, denoted by the columns. This table clearly shows that degradation is detected more often as the sampling interval gets smaller and the true degradation rate increases.* For the degradation rates of 2% and higher, each of the sampling intervals was able to “see” the lot degradation through sample-to-sample trends in every trial. When degradation was very low, it was undetectable by most sampling intervals. For example, the 0.01% degradation was not detected in some trials for each of the sampling intervals studied. This is partially a symptom of the duration of time examined. The 0.01% annual degradation lot results in an additional 10 failing units every year for the 100,000-item lot. At the end of the regression period—15 years—the 0.01% annual degradation results in only 150 failing items in the entire lot after 15 years, a 0.15% failure or 99.85% pass rate in the lot after aging. Hence, the lack of degradation detection is not automatically concerning for this low degradation rate considering the very small amount of degradation over just 15 years.
Number of times simulation did not detect degradation (the “false negatives” described in the text) in 150 trials over 15 years for various sampling intervals and true linear degradation rates
Worth considering, however, is the potential impact of degradation rates that some sampling intervals effectively recover while others do not. For example, a linear annual degradation rate of 0.25% results in an additional 250 PPE items failing each year from the lot. Over the course of the 15-year period, this adds up to 3,750 defective PPE items out of the lot. Depending on the type of PPE and the intended use, this level of degradation can be consequential. Therefore, it may be important to consider that the linear regression on annual sampling detected this level of degradation in 98% of the trials, with only 3 false negatives out of 150 trials, as seen in Table 2. This can be compared to 89% of the trials when samples are taken every 2 years (17 false negatives out of 150 trials) and 79% of the trials when sampling is done every 4 years (with 32 false negatives).
Number of times simulation failed to detect degradation in 150 trials over 5 years for various sampling intervals and true linear degradation rates
Table 2 presents linear regressions over the first 5 years (instead of 15 as seen in Table 1). As with the 15-year period shown in Table 1, degradation is detected more often with smaller sampling intervals and higher true degradation rates. But with less data gathered over time and higher true pass percentages at the end of the period, it is not surprising that the number of trials in which no degradation was detected generally increased for each sampling interval considered. Still, a sampling interval of 1 year and a linear degradation rate of 1%, both values in the middle of the ranges examined, resulted in just 6 out of 150 trials failing to detect degradation, or a 96% detection success rate. It should also be noted that degradation cannot be detected on a 5-year period for the 10-year sampling interval, since this interval includes only the initial sample set, with no testing of degraded samples.
Having shown that degradation can be detected through repeated sampling of PPE stockpiles, it follows to examine how well the degradation rates recovered through sample-to-sample trends conform to the specified rates. Table 3 contains the mean standardized regression coefficients for regressions performed over a 10-year period across 150 trials for each sampling interval and linear degradation rate. The values are all close to the true degradation rate simulated for each lot. In practical terms, when using repeated testing as a component of a stockpiled PPE LQAS, this finding suggests that the sample-to-sample trends seen (ie, the difference in the proportion passing from sample to sample) can be used to estimate the underlying degradation rate with some degree of confidence. Higher confidence can be placed in sampling intervals that consistently recovered degradation across the simulated degradation rates (shown in Tables 1 and 2).
Mean standardized regression coefficients in 150 trials over 10 years for various sampling intervals and true linear degradation rates
The third research question posed was whether different time intervals of repeated sampling differ in terms of the consistency with which they recover the true lot degradation rate. The answer to this research question is “yes”: Time intervals did differ in terms of the consistency with which they estimated the degradation rate in the lot. Greater consistency (ie, lower variance in the estimated degradation rate) would imply more confidence in the predicted degradation rate.
Table 4 reports the results of pairwise comparisons of the variances for the standardized regression coefficients taken from regressions over the first 10-year period for 150 trials of each sampling interval and linear degradation rates of 0.25%, 1.0%, and 5.0%. An informal visual inspection of the table suggested that rough groupings of testing time intervals displayed similar characteristics. Based on the pairwise comparisons of the variance in regression coefficients, the following time interval groupings emerged: Group 1: 6 months, 9 months, and 1 year; Group 2: 2 years and 3 years; and Group 3: 4 years and 5 years. These groupings are more pronounced in the 1.0% and 5.0% degradation rate contexts and suggest that there are similarities in consistency among the time intervals within the same group. They also suggest that some gains in reliability can be expected as the group number decreases. Omitted from the table, the time intervals of 1 month, 3 months, and 10 years produced unique reliability patterns and were not amenable to grouping with other time intervals.
Pairwise comparisons of the regression coefficient variances across 150 trials of different sampling intervals. Groupings of intervals with visually similar features are separated with dashed lines
Additional Analysis
As discussed, the primary research questions were answered using PPE lots that degrade in a linear fashion. Given the possibility that PPE degradation can be nonlinear, an exponential function was also used to set the degradation curve over time, and linear regressions were performed to predict a rate of degradation. Figure 3 depicts the results of this process for a particular trial.
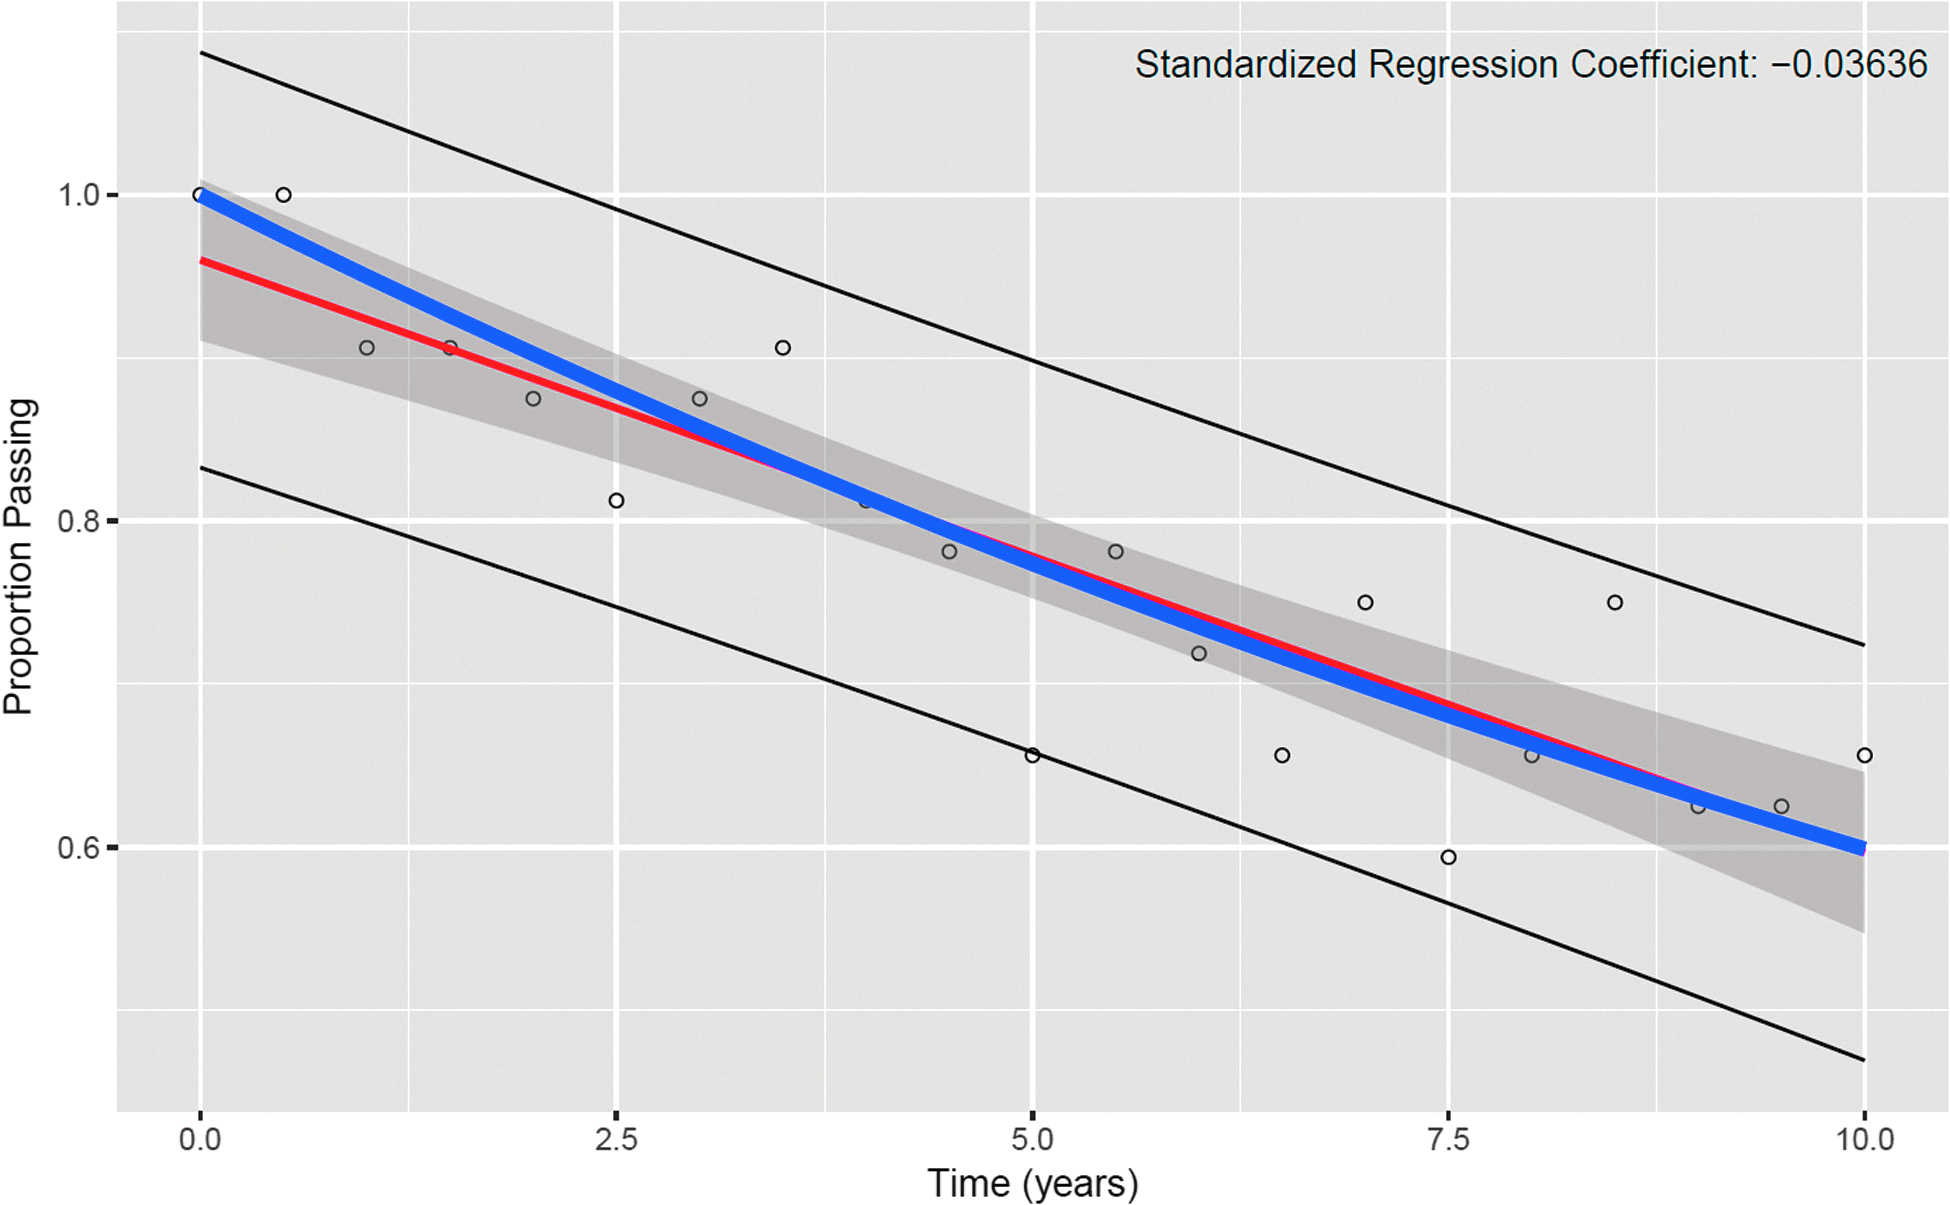
An example linear regression over 10 years for 6-month sampling intervals applied to an underlying exponential rate of 5.0%
Tables 5 and 6 report the same results as Tables 2 and 3, but with exponential degradation rates. The similar results suggest that degradation can still be detected and that similar patterns in sampling intervals hold for nonlinear degradation.
Number of times simulation failed to detect degradation in 150 trials over 15 years for various sampling intervals and true nonlinear degradation rates
Number of times simulation failed to detect degradation in 150 trials over 5 years for various sampling intervals and true nonlinear degradation rates
Discussion
The fundamental purpose of stockpile quality assurance is to detect potential problems with the stored supplies arising from degradation, ideally before users are put at risk. Stockpile quality assurance programs must balance economy with the need for quality assurance. Over-testing can also lead to excessive discarding of relatively good PPE lots due to random sampling variability and, thus, can prove expensive and potentially wasteful, in both the costs of performing the tests and the number of PPE units used in the tests.
By contrast, in a well thought out quality assurance process, the costs associated with the early disposal and frequent replacement of stockpiled equipment can be balanced against the costs of testing, while providing adequate evidence that stockpiled equipment will provide the expected level of protection when needed. The current study has shown that well-designed periodic testing schemes can detect degrading product in stockpiles before tolerable limits are exceeded, allowing better replacement planning in stockpile management.
With appropriate care, a stockpile quality tracking scheme—incorporating both current and prior testing results—could provide continued assurance of stockpile performance, improving confidence and economy over a single sample of LQAS testing results. The simulation presented here shows the ability of one such evaluation protocol. In many cases, trends observed in quantitative test results could be incorporated into continuing stockpile evaluations. Simulations such as the ones presented here could incorporate observed real-world degradation rates to further refine sampling rates and criteria. For instance, criteria could be developed to identify lots with testing results that significantly differ from the average, potentially allowing identification of poor storage conditions or other issues. A wide variety of PPE would need to be covered by a comprehensive stockpile monitoring protocol, and our work demonstrates that it is possible to develop such guidelines.
Conclusions
In this article and our previously published article, 27 we sought to provide evidence to determine if stockpiled PPE quality can be reasonably estimated by testing a single sample, to determine if repeated sampling can detect degradation, and to provide some initial guidance to stockpile managers in choosing between possible sample sizes and sampling intervals as they consider testing stockpiled PPE. The current study focused on determining the reliability of different time intervals in recovering rates of PPE lot degradation. It was found that degradation can be seen through trends in repeated sampling over time. Time intervals, other than 1 month, 3 months, and 10 years, were broken into groups in terms of how reliably the actual degradation rates were predicted. Group 1—6 months, 9 months, and 1 year—was comprised of intervals that were similar and had the best reliability in recovering the true degradation rates, while Group 2 had less reliability and Group 3 had the least.
It is recognized that stockpile resource availability, the volume of PPE at individual stockpiles, and the number of lots per manufacturer/model can vary widely, and these parameters may heavily influence the time interval options appropriate for individual stockpiles. As such, the conclusions provided are not recommendations or guidelines, but rather information and tools to help inform stockpile managers when developing plans for testing the quality of their stockpiles. It is also recognized that the administration of an LQAS for stockpiled PPE can be costly and time consuming. However, the alternative—replacing massive amounts of expired, unused, and potentially good quality PPE—will be even more costly in many cases.
Footnotes
Acknowledgments
The authors would like to acknowledge Dana Grau, Jeff Ballard, Joseph Reppucci, David Balbi, Ron Shaffer, and Mark Nicas for critical reviews of earlier versions of this manuscript. The findings and conclusions in this article are those of the authors and do not necessarily represent the official position of the National Institute for Occupational Safety and Health (NIOSH), Centers for Disease Control and Prevention. In addition, citations to websites external to NIOSH do not constitute NIOSH endorsement of the sponsoring organizations or their programs or products. Furthermore, NIOSH is not responsible for the content of these websites. All web addresses referenced in this document were accessible as of the publication date.