
Abstract
Since 2016, Joint External Evaluations (JEEs) help countries assess their health security preparedness and capacity to respond to public health risks. JEEs are 1 of 4 components of the International Health Regulations 2005 (IHR) Monitoring and Evaluation Framework. Compared with the mandatory State Party Self-Assessment Annual Reporting tool, JEEs use a transparent, rigorous, and collaborative process with international and in-country experts to evaluate IHR implementation. Because it is voluntary and not all States Parties have completed JEEs, we conducted a multiple linear regression model using publicly available JEE data to estimate global IHR implementation. We extracted JEE scores from the published JEE reports for 78 States Parties to the IHR and 12 sociodemographic, economic, and health indicator variables from 3 official reports and 3 official databases for all 194 World Health Organization Member States. Our final model consisted of 4 variables that significantly account for the variance of JEE score: total score from IHR annual reporting, lost disability-adjusted life years due to communicable diseases, gross domestic product, and health professional density (adjusted R2 = 0.833; P < .0001). We estimated only 1 in 10 countries (n = 19, 9.7%) worldwide had achieved average scores indicating demonstrated capacity or sustainable capacity across the 19 technical areas in the JEE tool. All 19 of these countries were in the high-income group, according to the World Bank classification, and were ranked very high on the Human Development Index, according to the United Nations Development Programme. These findings highlight the importance of ongoing efforts toward advancing global health security, especially in middle- to lower-income countries with limited resources.
Introduction
Increasingly, the international community has recognized its inevitable interconnectedness and the need for each country to invest in preparedness, early detection, and response for emerging and reemerging infectious disease threats. Under the revised International Health Regulations (2005) (IHR), which came into force on June 15, 2007, all 194 World Health Organization (WHO) Member States and 2 other States Parties (Liechtenstein and the Holy See) are required to have core capacities to detect, assess, report, and respond to emerging infectious diseases threats and potential public health emergencies of international concern.1,2
Since the revision of IHR, implementation has been assessed by self-evaluation with what is now known as the annual State Party Self-Assessment Annual Reporting (SPAR) tool, which requires each State Party to complete a questionnaire covering the 13 IHR core capacities.3,4 However, questions have been raised as to whether self-assessment is sufficient to assess country-level IHR core capacities.3,5 During the meeting on November 13-14, 2015, in Geneva, Switzerland, attended by the Review Committee on Second Extensions for Establishing National Public Health Capacities and on IHR Implementation, it was recommended for the Secretariat to “move from exclusive self-evaluation to approaches that combine self-evaluation, peer review and voluntary external evaluations involving a combination of domestic and independent experts.” 3 Based on these recommendations, WHO proposed an IHR Monitoring and Evaluation Framework in 2015, which included the existing mandatory SPAR tool along with new voluntary components. 6
In February 2016, a Joint External Evaluation (JEE) was introduced as 1 of 4 components of the IHR Monitoring and Evaluation Framework, along with after-action reviews, simulation exercises, and the mandatory SPAR.7-9 During a JEE, team of national experts first conducts a self-assessment and writes a report, and then a team of international external experts visits the country and jointly assesses IHR implementation in a transparent, rigorous, and collaborative manner.7,8 At the end of the JEE, the international and national teams jointly score 48 indicators across the 19 technical areas of the JEE tool—from a score of 1 (no capacity) to 5 (sustainable capacity) 10 (Figure 1). The JEE team also jointly proposes recommended priority actions for each of the 19 technical areas to the States Parties to guide the development of their National Action Plan for Health Security, to help countries with their progress toward IHR implementation. 7
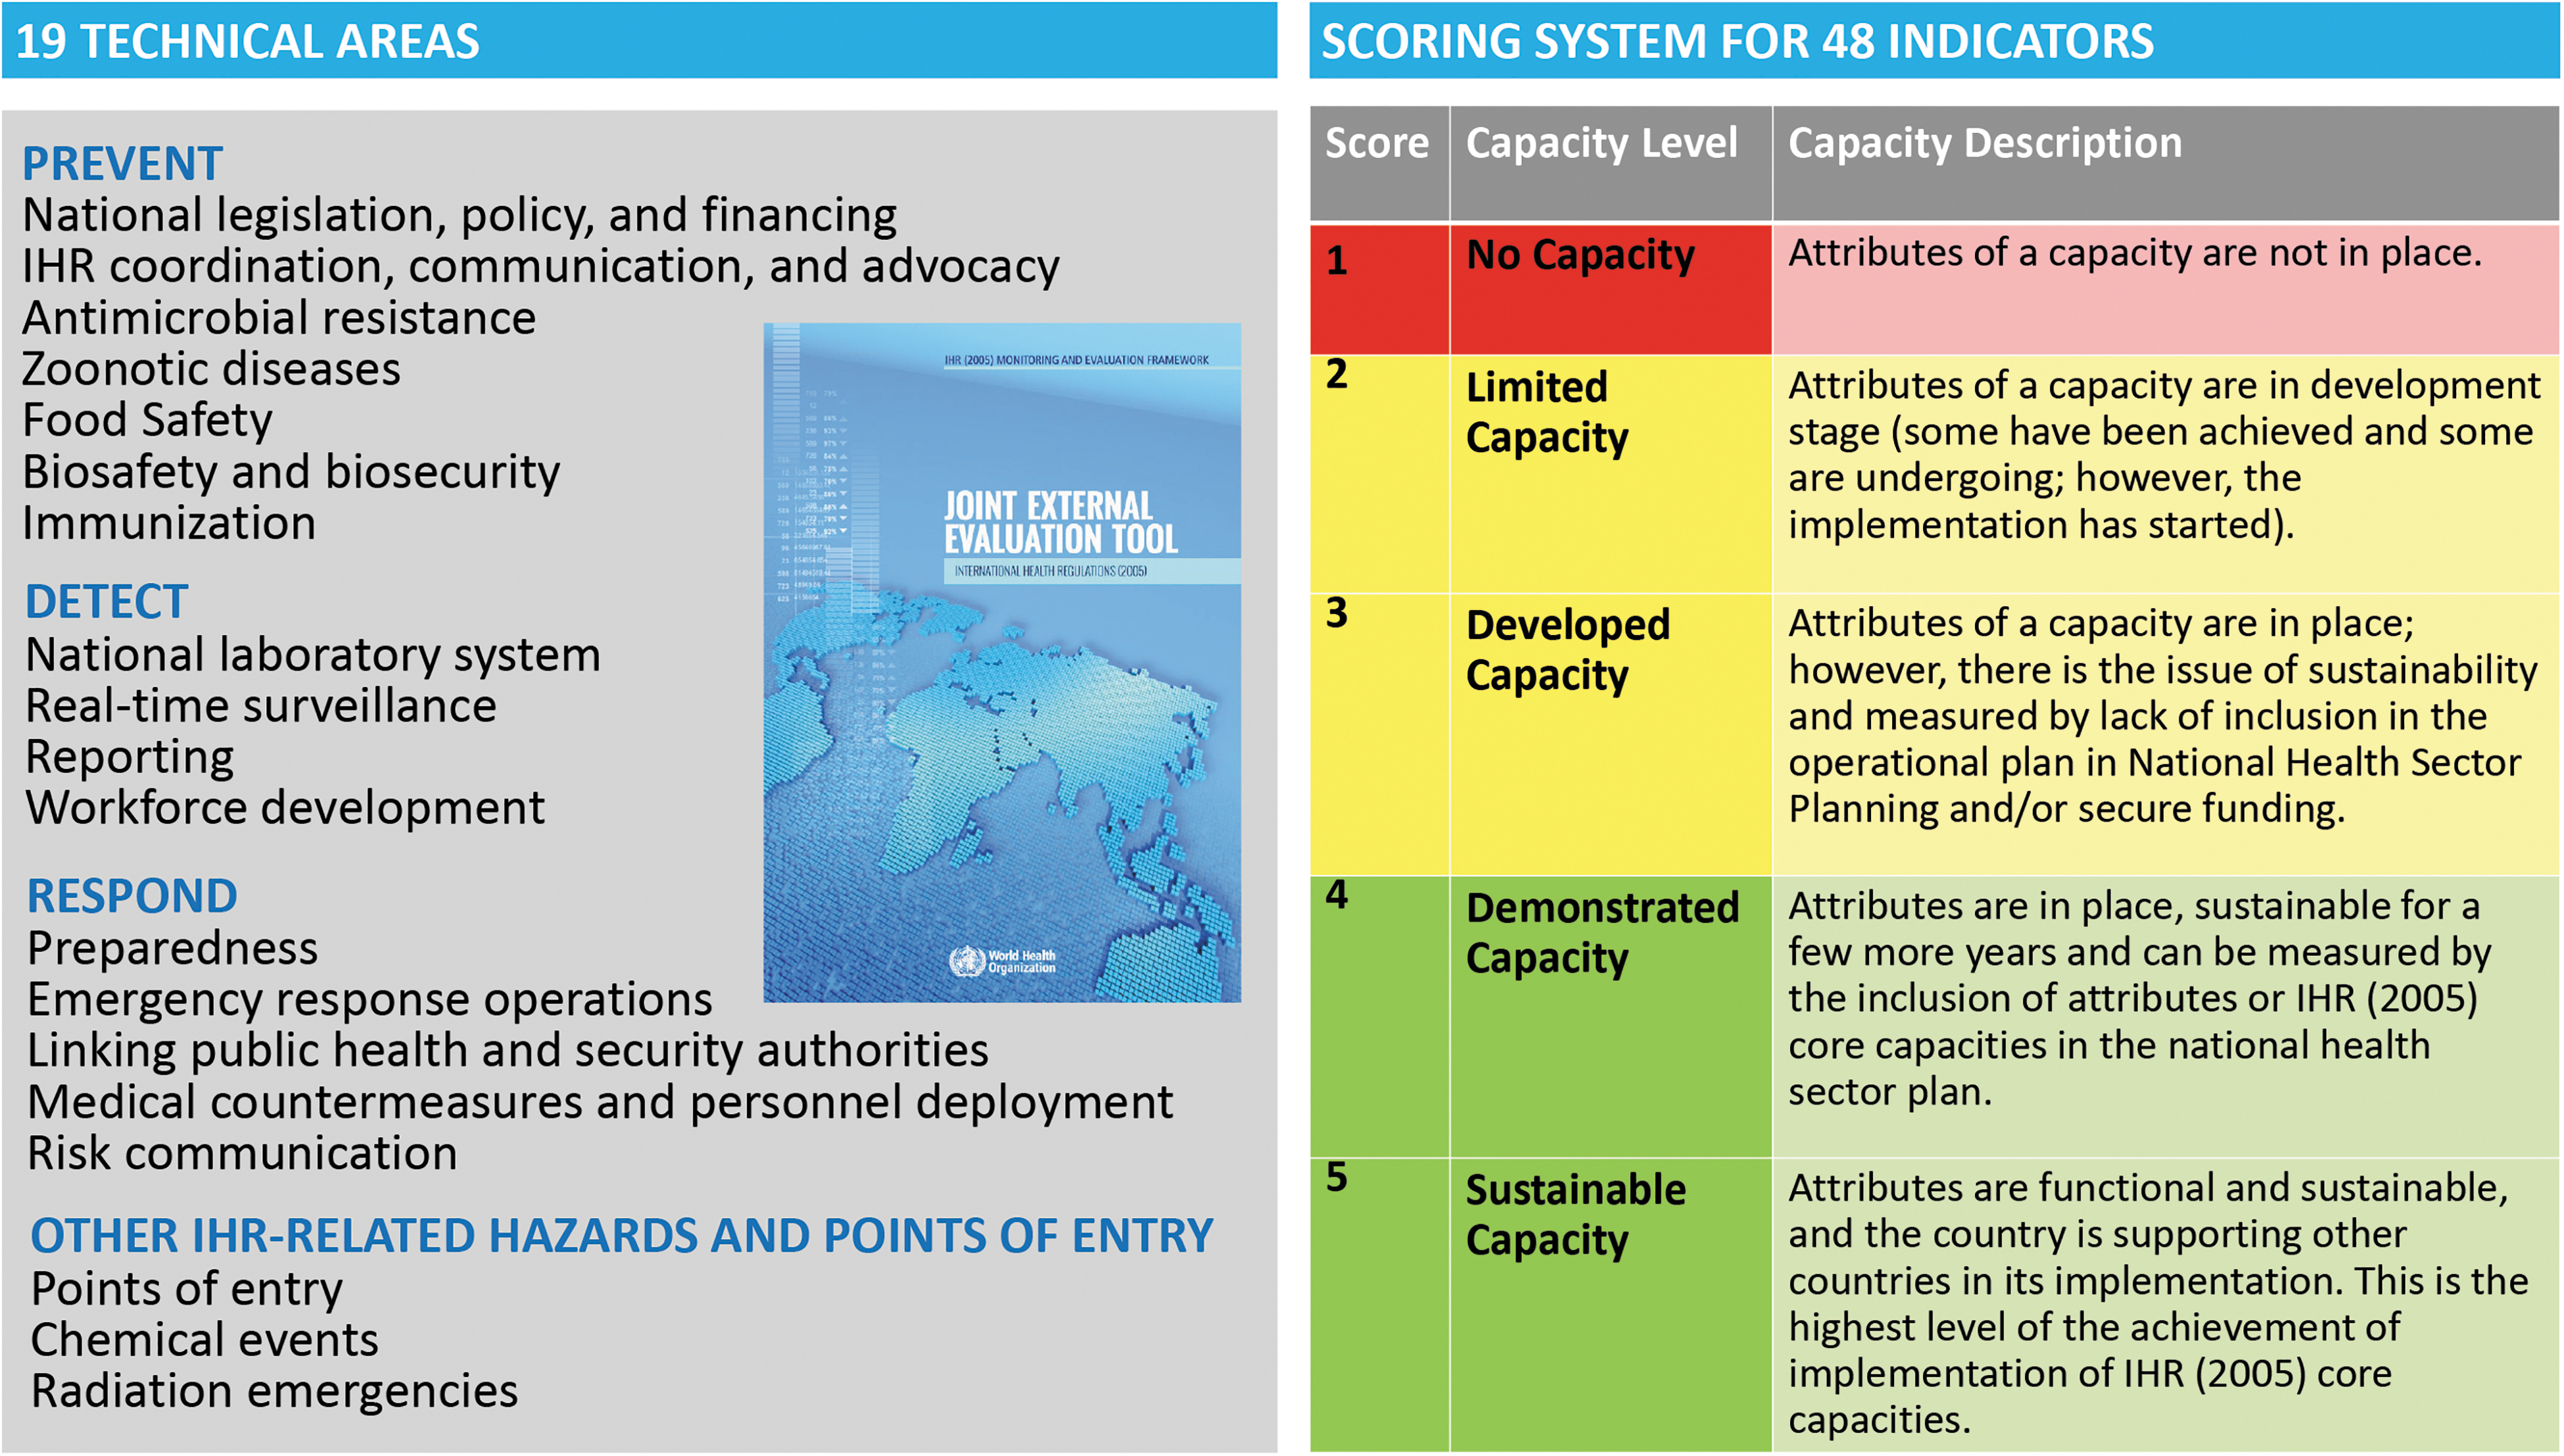
Overview of JEE technical areas and scoring system. A country can only progress to the next level after it achieves all attributes at the prior capacity level. Figure adapted from the JEE tool version 1. 10
JEE is considered a more objective measure of IHR implementation, and scores for JEE have been shown to be 18% to 20% lower than scores for the equivalent SPAR.11,12 However, the voluntary nature of JEEs means it is difficult to obtain an accurate view of global IHR implementation using JEE alone. We used multiple linear regression modeling of the publicly available JEE data from 77 countries 13 to estimate global IHR implementation in a 2-step process. In the first step, we used the JEE scores from 77 countries and other national sociodemographic, economic, and health indicators to develop a model for estimating JEE scores. In the second step, we used the model to estimate JEE scores for the remaining countries that have not yet completed a JEE. By combining existing and estimated JEE scores, we hope to obtain an estimate of global IHR implementation.
Material and Methods
Data Sources
In this study, we extracted JEE scores and other variables from available published JEE reports for 77 WHO member states plus Liechtenstein as of February 14, 2019. 13 We also extracted 12 sociodemographic, economic, and health indicator variables from 3 reports and 3 databases for all 194 WHO member states using the most recent data available. The 12 indicator variables were: (1) gross domestic product (GDP); (2) Global Peace Index; (3) Human Development Index; (4) health professional density; (5) IHR total score; (6) life expectancy; (7) literacy rate; (8) lost disability-adjusted life years (DALYs) per 100,000 people due to communicable, maternal, neonatal, and nutritional diseases (hereafter referred to as “DALYs due to communicable diseases”); (9) public health expenditure per GDP; (10) rural population; (11) under-5 mortality; and (12) World Bank Income Grouping.
Most data sources were from organizations and agencies under the United Nations, and, therefore, it was not possible to obtain all indicator data for non-Member States, including Liechtenstein; non-Member States were, therefore, not included in the multiple linear regression model. We extracted data on the 12 indicator variables from the following sources: (1) World Bank DataBank 14 —GDP per capita (current US$), life expectancy for both sexes at birth, rural population (percentage of total population), and under-5 mortality rate (per 1,000 live births); (2) WHO Global Health Observatory data repository 15 —average of 13 IHR core capacity scores from 2016 to 2017 (n = 175, 90.2%), skilled health professional density (per 10,000 people), and World Bank income grouping data; (3) Institute for Health Metrics and Evaluation database 16 —lost DALYs due to communicable diseases; (4) United Nations Development Programme (UNDP) Human Development Indices and Indicators 17 —Human Development Index and literacy rate (among those aged 15 years or older); (5) UNDP Human Development Report 18 —public health expenditure as a percentage of GDP; and (6) Institute for Economics and Peace Global Peace Index 2018 report 19 —Global Peace Index ranks.
The 12 indicator variables were selected a priori based on previous work conducted by Gupta et al 20 and Samhouri et al. 21 It has been shown that the IHR scores (later named SPAR after the introduction of the IHR Monitoring and Evaluation Framework 6 ) on average overestimate a country's IHR core capacities.11,12 However, we believe we could better estimate countries' actual capacities by incorporating key determinants and results of core public health capacities in-country (including health, socioeconomic and health system indicators), in combination with existing JEE scores. All data were entered by 1 team member and verified by a second team member.
Data Analysis
Descriptive Analysis
We described JEE implementation, such as participation rate by WHO regions in 2016-2018 and the length of JEE missions, to see how the JEE in practice aligned with the JEE tool, version 1. 10 We presented results either as frequency and percentages for categorical data or mean and standard deviation for continuous data.
Multiple Linear Regression Analysis
Missing Data Imputation
Multiple regression analysis was used for missing data imputation, with 5 iterations using SPSS version 25.0 (IBM Corp., Armonk, NY) to examine the robustness of the results for 12 predictor variables for all countries. Data imputation was used to build the regression model and estimate JEE scores for 116 member states that had not completed a JEE. Of all the data points used for our regression model (12 predictors for each of the 77 countries), 12 (1.3%) data points were imputed out of a total of 924 (Supplementary Table 1, www.liebertpub.com/doi/suppl/10.1089/hs.2019.0135). The imputed data points were for health professional density (n = 6, 7.8%), Global Peace Index (n = 4, 5.2%), Human evelopment Index (n = 1, 1.3%), and public health expenditure per GDP (n = 1, 1.3%) (Table 1). These missing data span 10 of the 77 countries used to build the model. Missing data imputation was not conducted for the remaining 8 predictor variables because these data were available.
Univariate and Bivariate Analysis of Predictor Variables with JEE Scores During Model Building, 2016-2018
Note: Lost DALYs due to communicable diseases and GDP was adjusted by 3 decimal places.
Abbreviations: DALY, disability-adjusted life year; GDP, gross domestic product; IHR, International Health Regulations (2005); SD, standard deviation; t, t statistic.
Model Building
We used the JEE final score for the 77 countries with available data to build a multiple linear regression model. We conducted a descriptive analysis of the 12 predictor variables and the outcome variable (JEE final score). To ensure the reliability of the imputed data, we verified and compared data before and after imputation. We also examined the association between each of the 12 selected predictor variables and JEE final score, before and after data imputation, using scatterplots and Pearson correlations (Supplementary Table 2, www.liebertpub.com/doi/suppl/10.1089/hs.2019.0135; Figure 2). Statistical significance was set at .05.
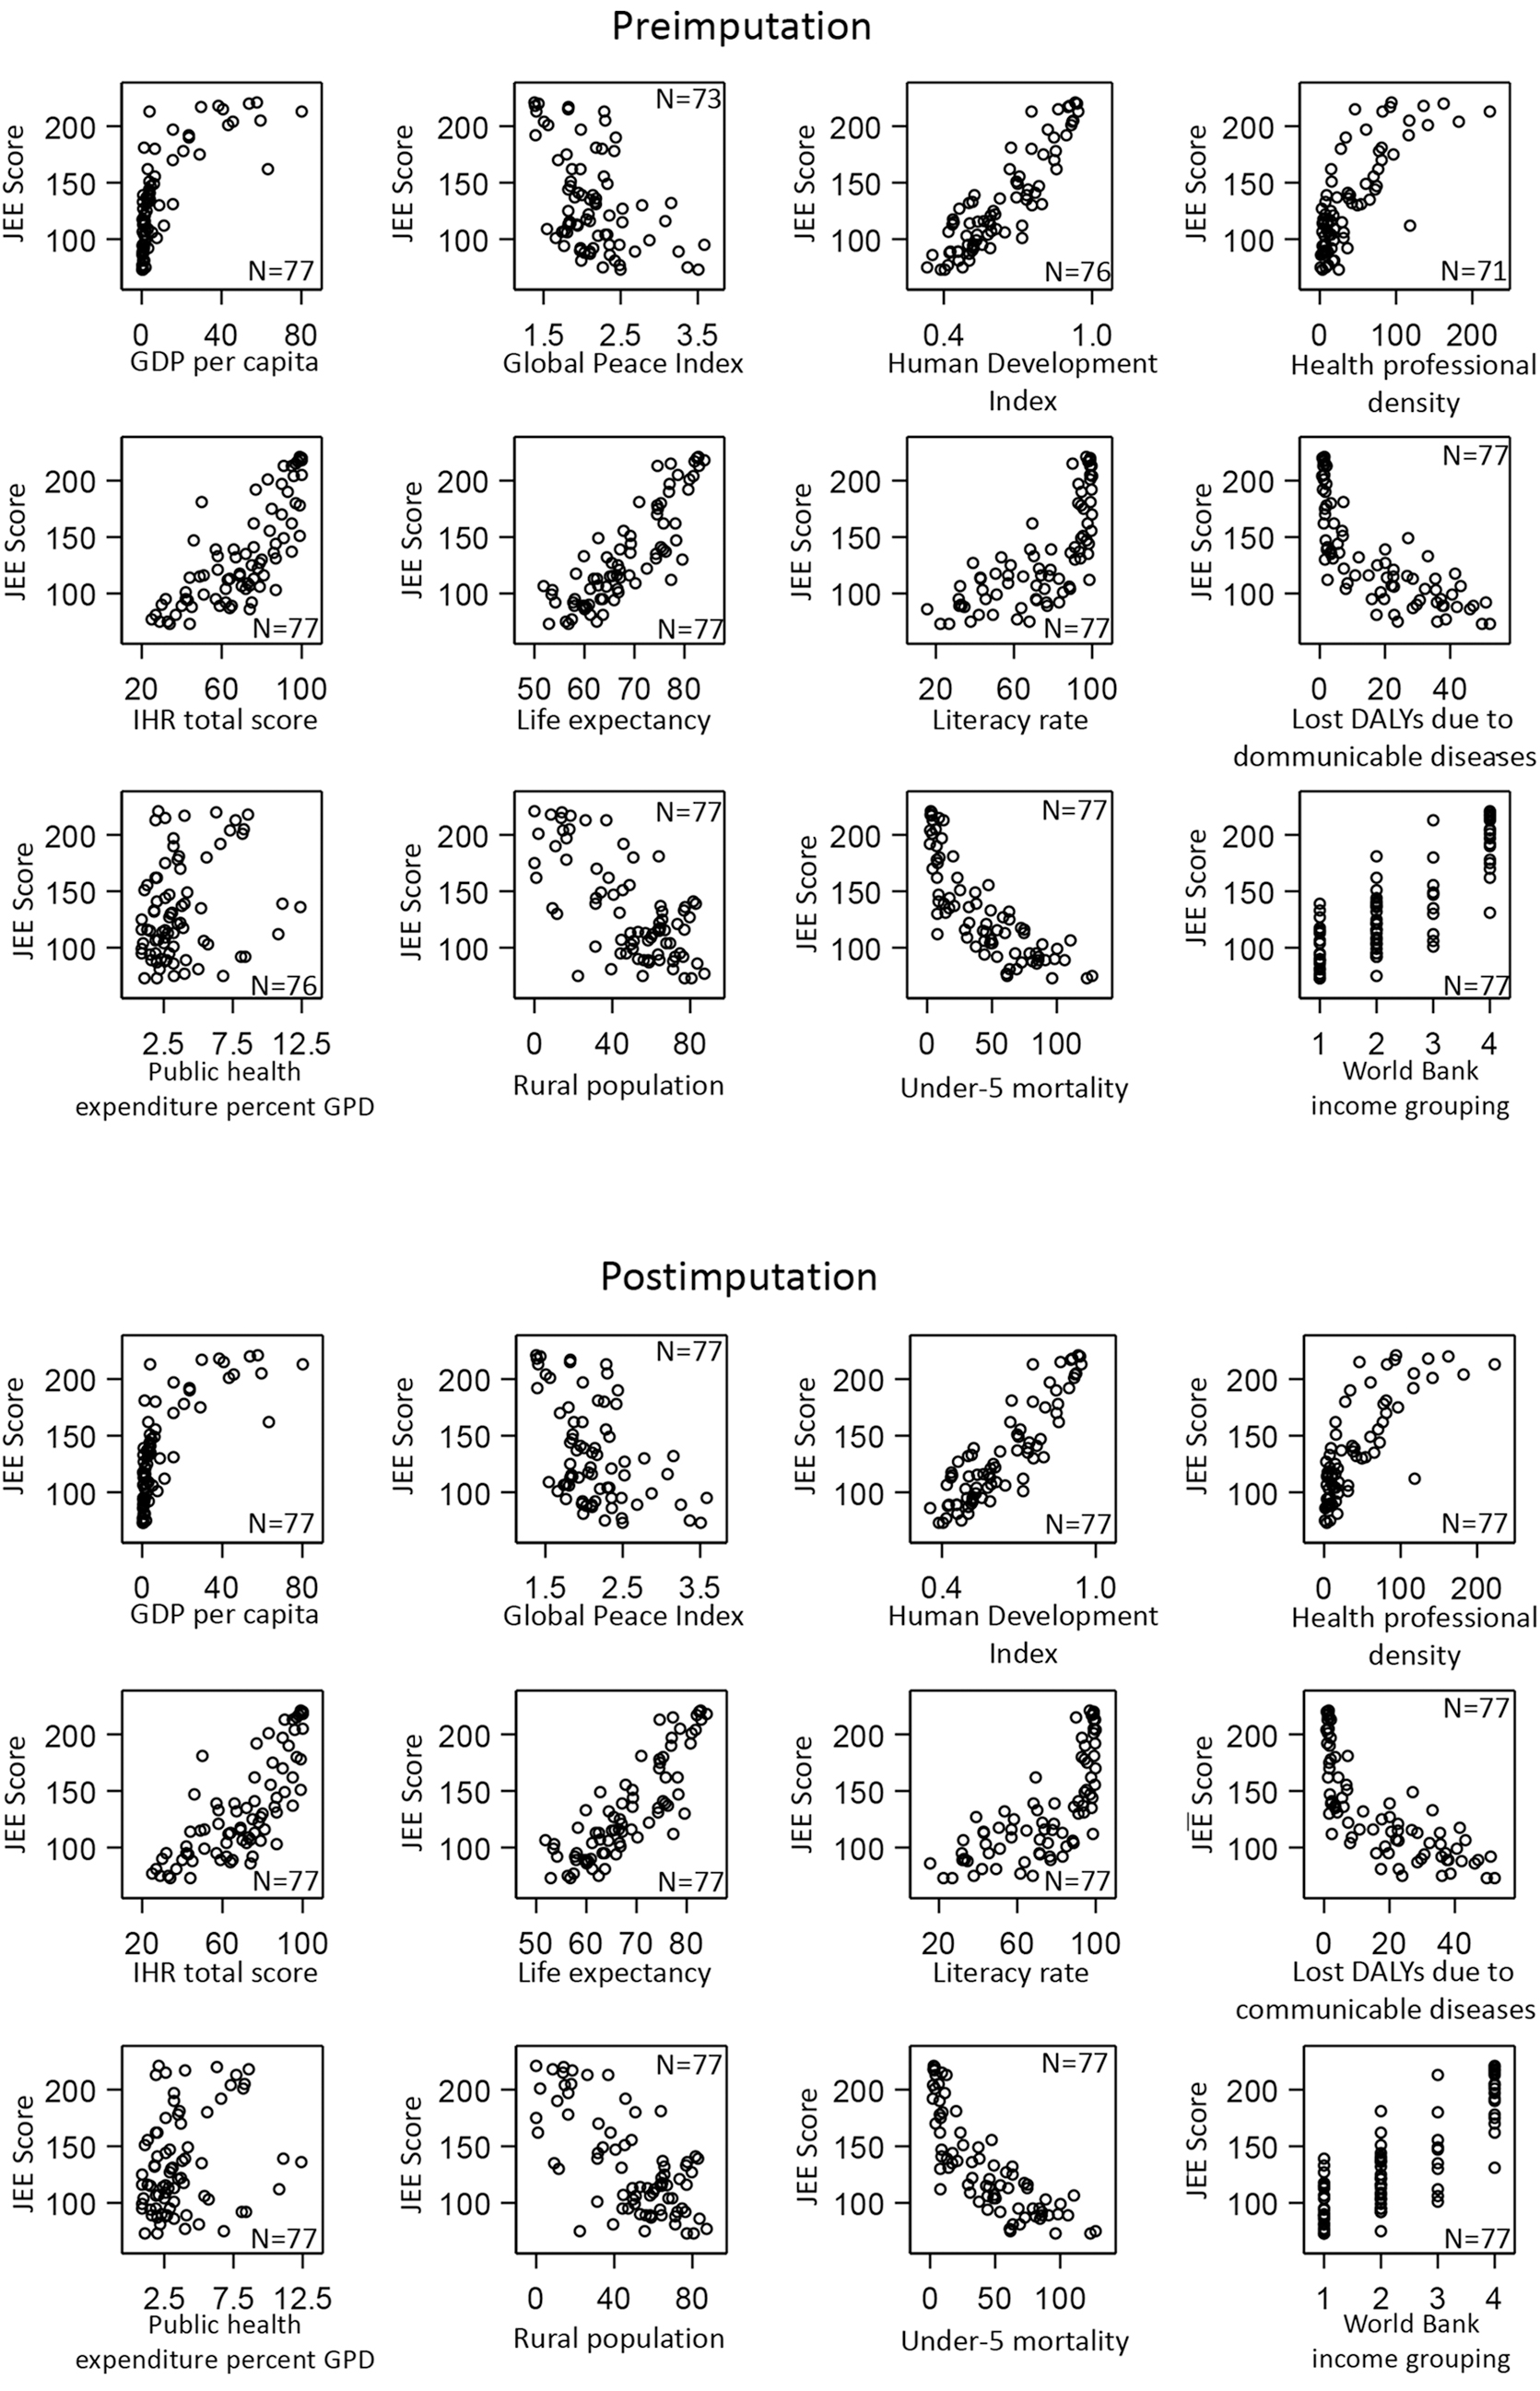
Scatterplots depicting the correlation between 12 predictor variables and JEE scores before and after imputation, 2016-2018.
Summary of JEE Implementation Worldwide, 2016-2018
Abbreviations: AFRO, Regional Office for Africa; AMRO, Regional Office for the Americas; EMRO, Regional Office for the Eastern Mediterranean; EURO, Regional Office for Europe; JEE, Joint External Evaluation; SEARO, Regional Office for South-East Asia; WHO, World Health Organization; WPRO, Regional Office for the Western Pacific.
We conducted a stepwise backward elimination approach for the multiple linear regression analysis. First, we conducted bivariate analysis and screened the strength of association between each predictor variable and the outcome variable. All 12 predictor variables met this requirement and were therefore included in our base model (Model 13). To address multicollinearity, we sequentially removed all variables from the highest to the lowest variance inflation factor (VIF) until no variables with VIF greater than 10 remained. Finally, we assessed effect modification and confounding. Interaction terms between IHR total score and all other predictor variables were created, given IHR total score from SPAR was defined as the main associating variable with JEE score a priori. Each set of interaction terms was then assessed using the TEST statement in SAS version 9.4 (SAS Institute, Inc., Cary, NC). Interaction terms (IHR total score times each of the other 11 predictor variables) were sequentially removed using a significance level of .05 as the cut-off to determine whether there is evidence of effect modification with IHR total score present in these data. Using the model with interaction terms added, we continued to assess the significance and confounding of each remaining predictor variable. We determined whether each remaining predictor variable was a potential confounder by assessing the percentage of absolute difference in their regression coefficients between the univariate model and the regression model, with a 10% difference being the cutoff point. After the assessment of potential confounder, predictor variables were fitted to create our final model (Model 28).
The lost DALYs due to communicable diseases and GDP were large values that generated a coefficient that approached zero, although they were statistically significantly correlated to the JEE score. To correct for this artifact, we scaled these values by a factor of 1,000 to generate a reasonable coefficient for our model. All data analysis, except missing data imputation, was conducted in SAS version 9.4.
Model Validation and Estimating JEE Scores
Using the final regression model, we calculated the scores for the 77 countries with existing JEE scores to assess the difference between estimated and actual scores to validate the model. We also applied a bootstrap resampling method to our regression analysis with 5,000 replicates to estimate the confidence interval of coefficients in the final regression model. All analysis steps were conducted using preimputation and postimputation data to assess any possible error introduced by the missing data imputation process.
After validating the final model, we then estimated the JEE scores for the remaining 116 member states that had not yet completed a JEE at the time of our study (February 2019). We also examined the proportion of countries that were estimated to have achieved at least an average of demonstrated or sustainable capacity (score of ≥4) across the 19 technical areas in the JEE tool—within the WHO regions, by income grouping, and by Human Development Index. This was done by calculating the total score for the 19 technical areas and subsequently dividing it by the 48 indicators to achieve an overall average score across all technical areas. No weighting by technical area was done in this study.
Results
Of the 196 States Parties to the IHR, 2 91 (46.4%) had completed a JEE between 2016 and 2018 (Figure 3), with 28 (30.8%) completed in 2016, 39 (42.9%) in 2017, and 24 (26.4%) in 2018. Participation in JEEs varied by WHO region; the African Region (AFRO) (n = 38, 41.8%), Eastern Mediterranean Region (EMRO) (n = 17, 18.7%), and South-East Asia Region (SEARO) (n = 8, 8.8%) completed the greatest number of JEEs of the 6 WHO regions (Table 2). The global participation rate increased from 14.3% (n = 28) by the end of 2016, to 34.2% (n = 67) by the end of 2017 and to 46.4% (n = 91) by the end of 2018 (Figure 4). JEE missions involved an average of 12 (range = 8 to 20) international multidisciplinary experts and took place over an average of 5 days (range = 4 to 10). The majority of the JEE reports were written in English (n = 67, 78.8%), followed by French (n = 17, 20.0%), and Russian (n = 1, 1.2%).
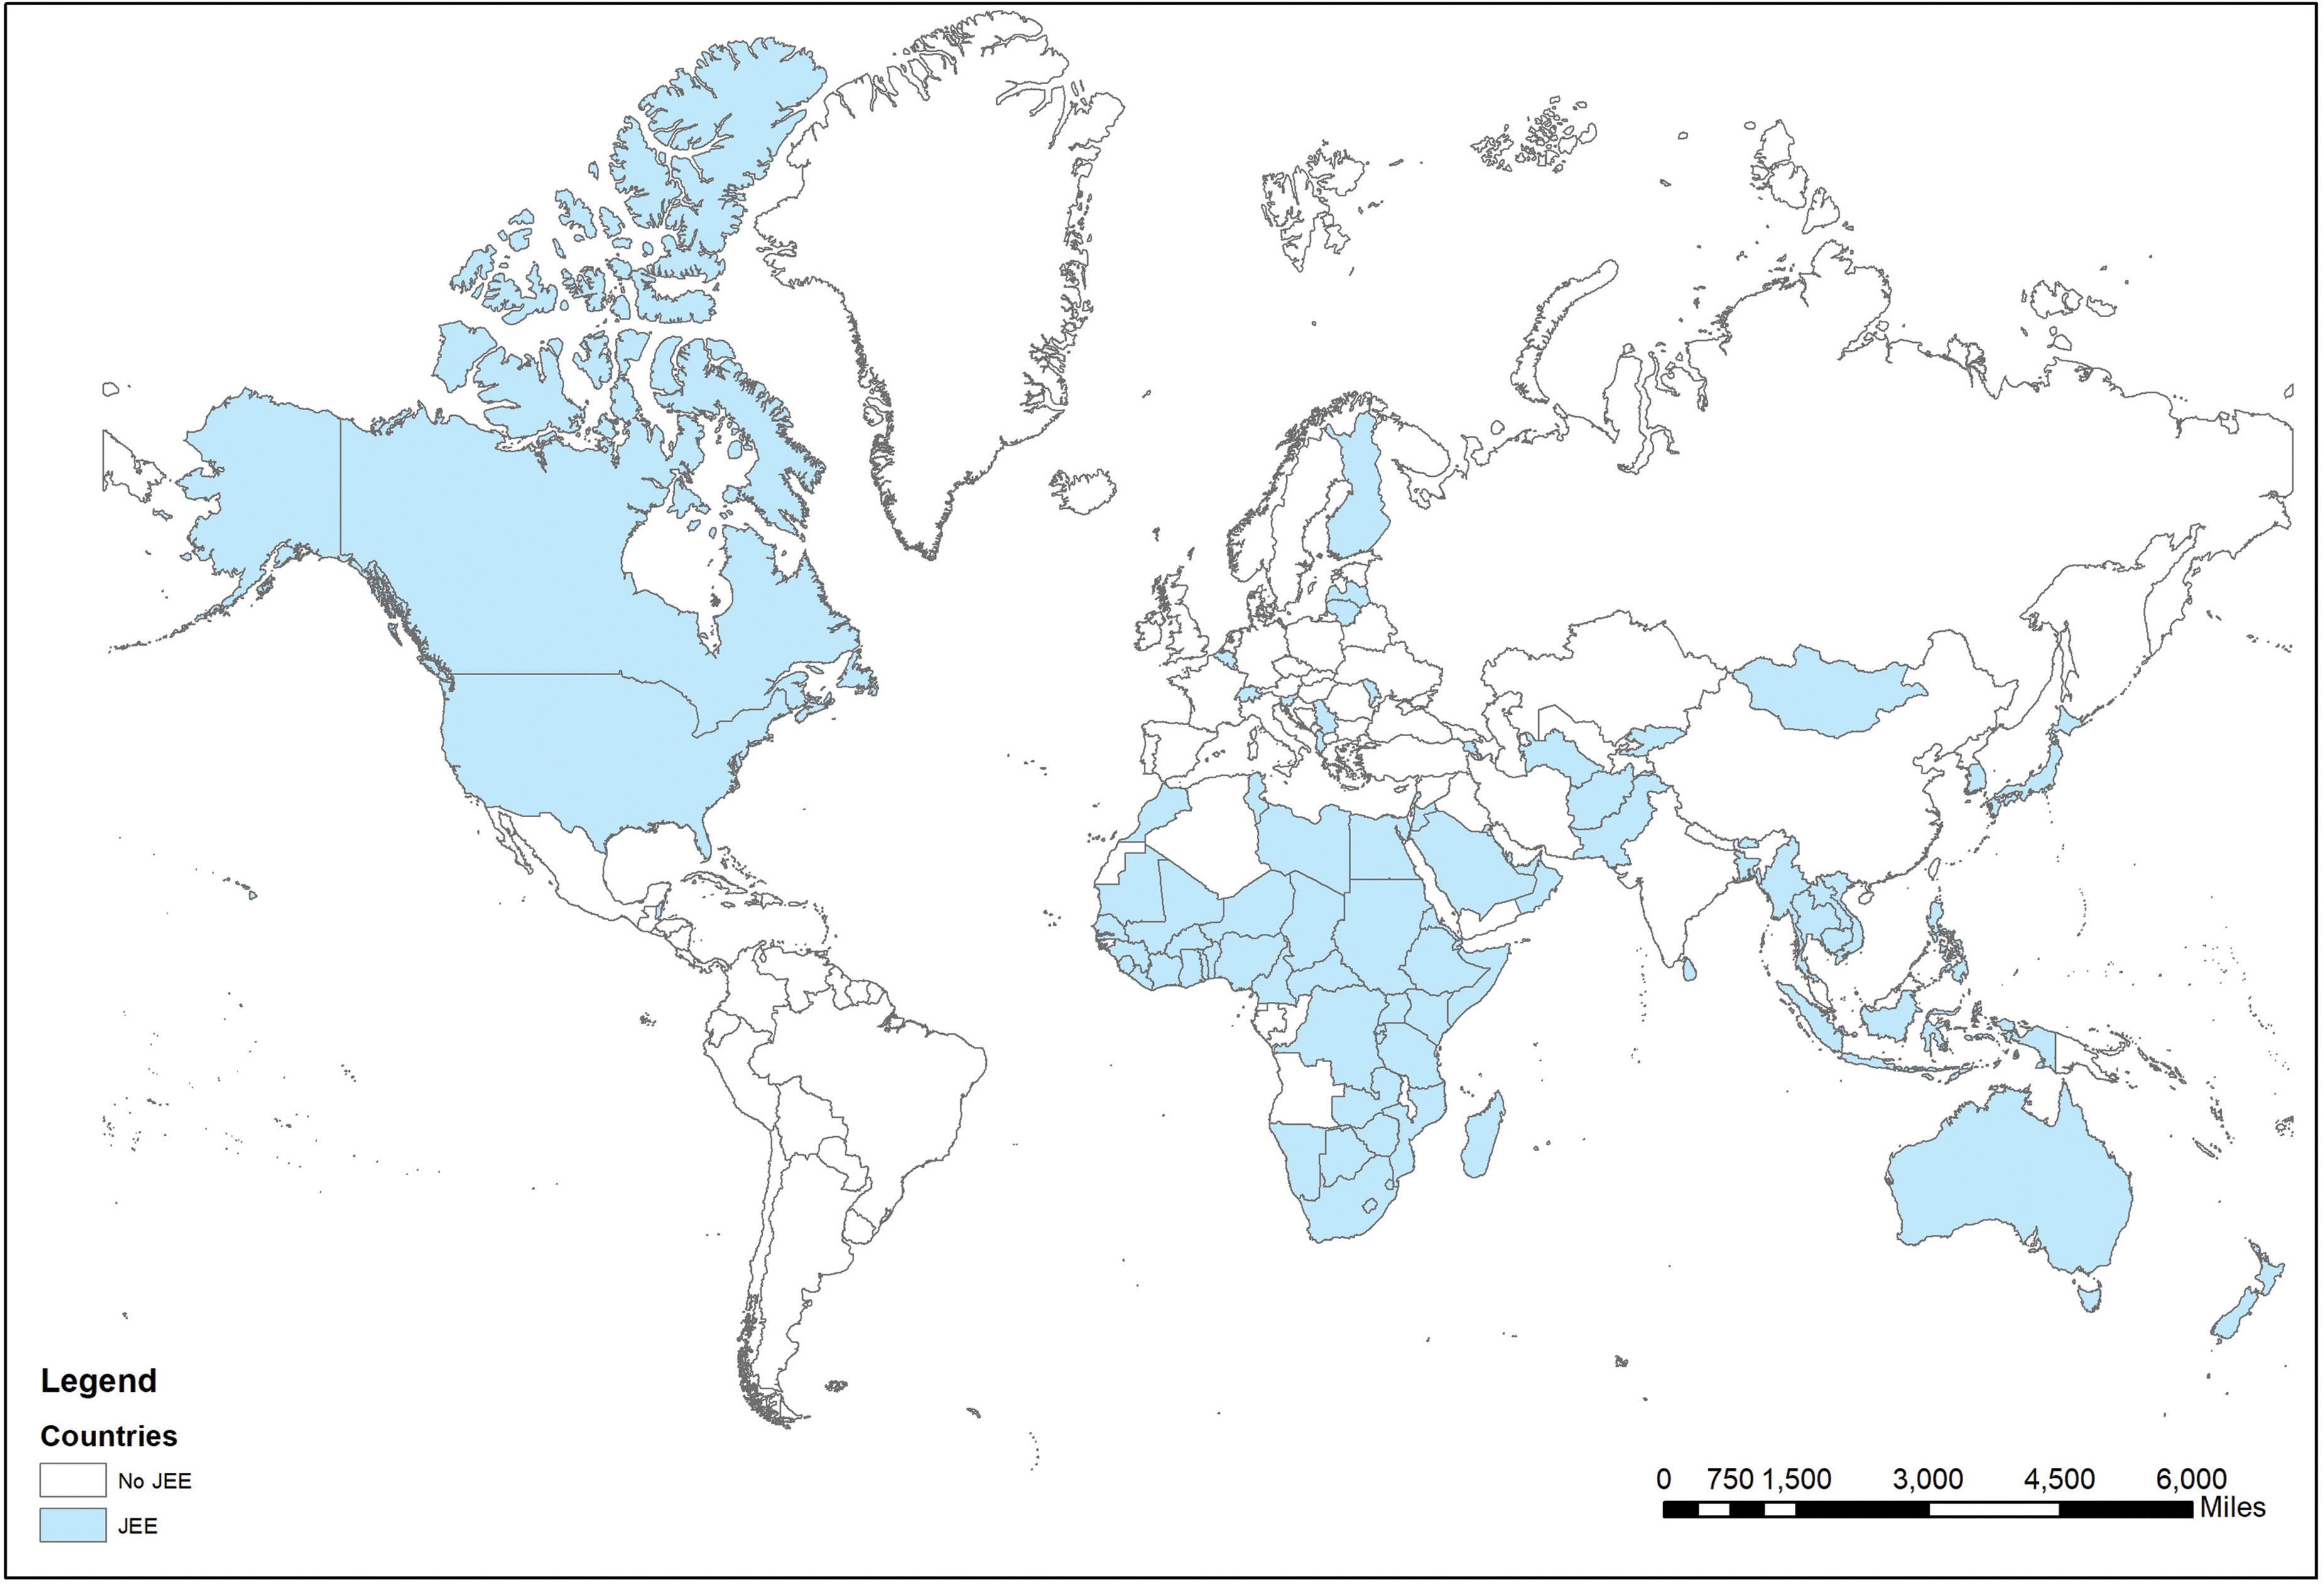
Map of all JEEs conducted worldwide, 2016-2018. This map represents the 91 States Parties that completed JEEs from 2016 to 2018. Not all reports were available at the time of our study (as of February 14, 2019) for inclusion in the regression analysis.

Cumulative JEE participation rate by WHO region and worldwide, 2016-2018. This figure represents the 91 States Parties that completed JEEs from 2016 to 2018. Not all reports were available at the time of our study (as of February 14, 2019) for inclusion in the regression analysis.
The mean total JEE score for the 77 countries included in our regression analysis was 132.4 (standard deviation [SD] = 43.6, range = 73 to 221; data not shown) out of a range of possible scores between 48 and 240. When averaged by the 48 indicators in the JEE tool, we found that this equated to a mean score of 2.8 (SD = 0.9) per indicator, which sits between limited (2 score points) and developed capacity (3 score points) according to the JEE scoring definition (Figure 1; data not shown).
For the bivariate analysis, we found that all 12 predictor variables we selected significantly correlated with the JEE score using the Pearson's correlation (P < .05) and were, therefore, included in our base model (Table 1 and Supplementary Table 2, www.liebertpub.com/doi/suppl/10.1089/hs.2019.0135). Of these, 8 predictor variables positively correlated with the JEE score, and 4 predictor variables (Global Peace Index, lost DALYs due to communicable diseases, rural population percentage, and under-5 mortality) negatively correlated with JEE score (scatterplots shown in Figure 2; Pearson's correlation shown in Supplementary Table 2). To ensure the correlation between predictor variables and JEE score did not deviate after imputation, we compared these for preimputed and postimputed data and found the direction and level of association were not different, as seen on the scatterplots on Figure 2. Statistical significance in our base model did not change for imputed (P < .0001, adjusted R2 = 0.841; Table 3) and nonimputed data (P < .0001, adjusted R2 = 0.849; Supplementary Table 3, www.liebertpub.com/doi/suppl/10.1089/hs.2019.0135). Three predictor variables were highly intercorrelated (Table 3). The 3 predictor variables, Human Development Index (VIF = 30.17; Table 4), life expectancy (VIF = 16.13; data not shown), and under-5 mortality rate (VIF = 10.23; data not shown), were sequentially removed from the highest to the lowest VIF until no predictor variables with VIF greater than 10 remained, to form Model 16 (P < .0001, adjusted R2 = 0.829) (Table 3 and Table 4).
Linear Regression Models for Imputed Predictor Variables and JEE Scores, 2016-2018
Note: Linear regression models for nonimputed data are found in Supplementary Table 3.
Dependent variable: JEE total score
Model 13 (base model) includes all 12 predictor variables: IHR total score, public health expenditure per GDP, Global Peace Index, rural population, lost DALYs due to communicable diseases, GDP, literacy rate, health professional density, World Bank Income Grouping, under-5 mortality, life expectancy, and Human Development Index.
Model 16: Removed predictor variables with VIF larger than 10 from largest to lowest sequentially. Predictor variables for this model include IHR total score, public health expenditure per GDP, Global Peace Index, rural population, lost DALYs due to communicable diseases, GDP, literacy rate, health professional density, and World Bank Income Grouping.
Model 28 (final model): Removed variables with a P value larger than .05. Predictor variables for this model include IHR total score, lost DALYs due to communicable diseases, GDP, and health professional density.
Abbreviations: DALY, disability-adjusted life year; GDP, gross domestic product; IHR, International Health Regulations (2005); VIF, variance inflation factor.
Linear Regression Results for Imputed Predictor Variables and JEE Scores by Model, 2016-2018
Note: Linear regression results for nonimputed data are found in Supplementary Table 4.
Abbreviations:
Based on statistical significance, World Bank income grouping (t = -0.01 , P = .998; Table 4), Global Peace Index (t = -0.07 , P = .94; data not shown), literacy rate (t = 0.47 , P = .64; data not shown), rural population percentage (t = -0.77 , P = .44; data not shown), and public health expenditure as a percentage of GDP (t = -1.61, P = .11; data not shown) were removed sequentially from the highest to the lowest value that failed to show statistical significance and were not found to be confounders, to form our final Model 28 (P < .0001; adjusted R2 = 0.833; Table 3 and Table 4). Results for nonimputed data to validate the missing data imputation process were also found to be statistically significant (P < .0001, adjusted R2 = 0.822; Supplementary Tables 3 and 4, www.liebertpub.com/doi/suppl/10.1089/hs.2019.0135).
In our final multiple regression model we found that 4 variables significantly accounted for 83.3% of the variance in JEE score under our preset statistical significance of .05: total score from IHR annual reporting (β = 0.73, t = 5.96, P < .001); lost DALYs due to communicable diseases (β = -0.81, t = -4.49, P < .001); GDP (β = 0.50, t = 2.38, P < .05); and health professional density (β = 0.22, t = 2.69, P < .05) (Tables 4 and 5). The final regression model to estimate JEE score was:
Comparison of Actual and Estimated JEE Scores for the 77 Member States Used in Model Building and the Estimated JEE Scores for the Remaining 116 Member States, 2016-2018
Abbreviations: AFRO, Regional Office for Africa; AMRO, Regional Office for the Americas; EMRO, Regional Office for the Eastern Mediterranean; EURO, Regional Office for Europe; JEE, Joint External Evaluation; SEARO, Regional Office for South-East Asia; WHO, World Health Organization; WPRO, Regional Office for the Western Pacific.
JEE score = 81.61 + 0.50 x (GDP) +0.22 x (health professional density) +0.73 x (total score from IHR annual reporting) - 0.81 x (lost DALYs due to communicable diseases)
No effect modifiers were found for the predictor variables in the final model (Model 28). Model results were validated by comparing the actual and calculated scores for the 77 countries that had completed a JEE (Table 5); all calculated JEE scores for the 77 countries were within the feasible range between 48 and 240. Of the 77 countries used to build the model, 44 (57.1%) countries estimated their JEE scores within 10% of their actual score, and 23 (29.9%) estimated within 20% of their actual score (data not shown).
When applying the regression model on the 116 countries that did not have JEE reports available or had not yet completed a JEE, the majority (n = 114; 98.3%; data not shown) of calculated JEE scores were within a feasible range. In the 2 countries that had scores outside of the feasible range, our model generated a total JEE score of 280.86 and 240.7, which meant an overestimation of the feasible maximum JEE score of 240 by 40.86 (17.0%) and 0.7 (0.3%) (data not shown). The overestimation could be due to the value of predictor variables for the 2 countries falling outside of the range of the predictor variables used in the initial model building (Supplementary Table 5, www.liebertpub.com/doi/suppl/10.1089/hs.2019.0135). To prevent potential sensitivities and avoid discouraging countries from sharing their JEE reports publicly, we decided not to show individual country results. However, the data are shown as aggregates for World Bank region, World Bank income group, and Human Development Index (Table 6).
Global IHR Implementation Based on Actual and Estimated JEE Scores, 2016-2018
Note: The number of indicators for each technical area differs and is not proportional to the importance of the technical area. The data presented did not account for this and is not a weighted average.
Did not reach demonstrated and sustainable capacity.
Reached demonstrated and sustainable capacity.
Abbreviations: AFRO, Regional Office for Africa; AMRO, Regional Office for the Americas; EMRO, Regional Office for the Eastern Mediterranean; EURO, Regional Office for Europe; IHR, International Health Regulations (2005); JEE, Joint External Evaluation; NMS, non-Member State; SEARO, Regional Office for South-East Asia; WHO, World Health Organization; WPRO, Regional Office for the Western Pacific.
Based on the regression model results, we used actual JEE scores for the 77 member states and Liechtenstein that completed a JEE and the calculated score for the remaining 116 member states to estimate global IHR implementation (Table 6). Based on our data, we estimate 9.7% (n = 19) of countries worldwide have achieved an average of demonstrated or sustainable capacity (average score of ≥4 for each indicator) toward IHR implementation for all 19 JEE technical areas: actual JEE score – 7 (36.8%); estimated JEE scores – 12 (63.2%). Among the 19 countries, 13 (68.4%) were in the European region (EURO), 4 (21.1%) were in the Western Pacific region (WPRO), and 2 (10.5%) were in the Americas region (AMRO; also named the Pan American Health Organization, or PAHO). All 19 countries belonged to the high-income group according to the World Bank classification and had very high Human Development Index rankings, according to UNDP.
Discussion
JEE promotes transparency, accountability, multisectoral collaboration, and trust-building. It is currently a voluntary process, however, with half of all countries not yet having participated. As such, our understanding of the current global status of IHR implementation is limited. As we have shown in this study, regression analysis can be a useful tool to estimate global IHR implementation based on currently available JEE data.
Based on our estimation, only 1 in 10 countries worldwide have achieved an average of demonstrated (4 score points) or sustainable (5 score points) capacity across the 19 technical areas in the JEE tool. This is in contrast to the 64 States Parties (1 in 3 States Parties), which declared that they met IHR core capacity requirements by November 2014 during the Review Meeting on Second Extensions for Establishing National Public Health Capacities and on IHR Implementation. 3 This is not completely surprising given it has been widely believed and more recently shown by Tsai et al 11 and Nirmal et al 12 that many States Parties overestimate their capacity in SPAR by approximately 18% to 20%.
It is important to note that in our analysis, we assessed the total average JEE score for all 19 technical areas, rather than the score of individual technical areas. According to the analysis conducted by Gupta et al, 20 IHR implementation can vary substantially by technical area and by indicator within each technical area. They found that the indicators with the highest median score were accessibility of national vaccine and delivery system, laboratory testing capabilities for priority diseases, and syndromic surveillance system. The indicators with the lowest median score were antimicrobial stewardship activities, surveillance of infections caused by antimicrobial resistance, and having biosecurity systems in place. To better understand IHR global implementation for each technical area, we believe it would be necessary to assess technical areas and indicators separately.
Several WHO regions (AMRO, EMRO, and EURO) had limited participation in JEEs. We also found that most JEE reports were written in English, French, and Russian, but none were written in Spanish, Chinese, or Arabic—the 3 other United Nations official languages. At the time of this study, almost half of the States Parties had not yet completed a JEE; however, this lack of participation may be attributed to insufficient funding, policy, geopolitics, the burden on States Parties to prepare for a JEE, or the low interest from senior officials in countries. Having international experts conduct JEEs in multiple languages may facilitate and encourage participation.
Version 2 of the JEE tool was published in January 2018, 22 and by June 2019, 4 States Parties had published JEE reports using the revised tool. In the revised tool, JEE criteria for assessing core capacities has been clarified, and several indicators have been added, removed, moved, split, or merged for several technical areas. The revised tool includes 49 indicators, whereas version 1 included 48 indicators. Evaluation criteria have become stricter, with more explicit language used to define each indicator and its requirements to aid interpretation. As a result, States Parties may not see significant improvement in JEE scores if they were to conduct a subsequent JEE as recommended every 5 years. Tailored communication for States Parties explaining the changes and implications on scoring may, therefore, be required. In this study, all JEE data used were from version 1 of the tool. 10 As more JEEs are completed using version 2 of the tool, our regression model may need to be adjusted to allow comparison between JEEs completed using version 1 or 2.
JEE remains the more robust way to evaluate IHR implementation in countries, and we do not propose that regression modeling is a suitable replacement. We believe our results provide useful information, which can enhance our knowledge of the status of global preparedness for response to infectious diseases and other public health emergencies, especially because of the substantial gaps in knowledge due to incomplete participation in JEEs. Although we estimated global IHR implementation through regression modeling, we stand with the WHO recommendation to advocate for States Parties to participate in the voluntary JEE process to ensure a more accurate picture of our progress toward advancing global health security, especially in light of the current coronavirus disease 2019 (COVID-19) pandemic.
While JEE can measure the availability of resources, systems, and infrastructure needed for IHR capacities, such as legislation, mechanisms for multisectoral collaboration and coordination, and human resources, assessing actual system functionality is more difficult. 9 We, therefore, recommend collectively examining JEE data with other components of the IHR Monitoring and Evaluation Framework, such as information from after-action reviews and simulation exercises, which assess actual system performance during an outbreak.
Our regression model is limited by its relatively small sample size of 77 countries, with an underrepresentation of countries from the EMRO, AMRO, and EURO regions. As more countries from these regions participate in JEEs, we expect our regression model to become more reliable. We were restricted to using sociodemographic, economic, and health indicators that are publicly available for all countries as predictor variables. Therefore, we may not have included all possible predictor variables associated with JEE scores in our analysis. In addition, although the predictor variables included in this study were extracted from official sources, some of these values were ultimately based on each country's self-reported values. This means the reliability of our model is dependent on the accuracy of individual country's self-reported data. Some predictor variables had missing data, which meant we had to do missing data imputation for both the model-building step as well as the JEE score estimation using our final model. Because of this missing data, there may be some level of error in our analysis, which we assessed by comparing results from preimputed and postimputed data. Furthermore, the total JEE score for all 19 technical areas were estimated and subsequently divided by the 48 indicators to achieve an overall mean score. We are aware that it would have been ideal to calculate a weighted average, especially because the number of indicators for a given technical area is not proportional to the importance of the technical area. Additional studies are needed to specifically look at technical area-specific capacities. In addition, the 19 technical areas from the JEE tool cover several areas not included in the IHR score from the 13 IHR core capacities from SPAR, and therefore they may not be directly comparable. Finally, 2 out of 194 countries were outside of the feasible range of JEE scores (48 to 240) because some of the predictor variables for these countries had higher values that may have caused the high estimates of JEE score. Further research could include fitting a model including the 2 countries to see if it improves the fit of the other 192 countries on the JEE score, while being aware of the problem of overfitting.
Conclusions
Since 2016, JEE has provided a transparent and rigorous approach to assessing global IHR implementation. Based on our regression analysis, we estimate that the vast majority of countries have not yet obtained a developed or sustainable level of capacity. During the current ongoing COVID-19 outbreak that was declared a public health emergency of international concern on January 30, 2020, and subsequently declared a pandemic on March 11, 2020 by WHO,23,24 even countries with demonstrated and sustainable capacity have experienced challenges such as, testing, contact tracing, and implementing public health and social measures to prevent community transmission. As of December 17, 2020, more than 73 million laboratory-confirmed COVID-19 cases and more than 1.6 million deaths worldwide have been reported to WHO. 25 WHO typically recommends the critical step of conducting after-action reviews 26 in affected countries after a public health emergency to identify gaps, lessons learned, and best practices during the response to inform our understanding of system functioning during an event. Given the protracted nature of the COVID-19 pandemic, however, the IHR Emergency Committee for COVID-19 issued a temporary recommendation to State Parties following a meeting convened by the WHO Director-General on July 31, 2020, 27 to conduct intra-action reviews28,29 and share their findings with WHO to enable the application of best practices from countries that successfully reopened and mitigated COVID-19 resurgence. These findings highlight the importance of ongoing efforts toward advancing global health security by using a comprehensive strategy that incorporate all 4 components of the IHR Monitoring and Evaluation Framework—SPAR, JEE, simulation exercises, after-action reviews, 6 and now also intra-action reviews.28,29
Footnotes
Acknowledgments
We would like to acknowledge Ms. Elaine Eisenbeisz, Omega Statistics, for her professional service and guiding the statistical analysis conducted in this study. This work was conducted under the support of the Tohoku University Center for Gender Equality Promotion (TUMUG) Next Step Grant (Grant No. 4-12, 2019-2020).
References
Supplementary Material
Please find the following supplemental material available below.
For Open Access articles published under a Creative Commons License, all supplemental material carries the same license as the article it is associated with.
For non-Open Access articles published, all supplemental material carries a non-exclusive license, and permission requests for re-use of supplemental material or any part of supplemental material shall be sent directly to the copyright owner as specified in the copyright notice associated with the article.