
Abstract

While there is consensus for the use of personal protective equipment and other measures for the prevention of transmission of severe acute respiratory syndrome coronavirus 2 (SARS-CoV-2) in high-risk situations, such as aerosol-generating medical procedures, there is a divergence of opinion and enthusiasm for measures such as social distancing, cloth masks, and other recommendations in low-risk situations. The insights of epidemiologist Geoffrey Rose 1 on sick and high-risk populations may be helpful. In its simplest form, his concept can be explained as follows: the high-risk subpopulation—such as elderly people with preexisting cardiac or pulmonary conditions—may contribute a lesser share to the outcome (eg, infection, death) than a low-risk subpopulation would. This is simply because of the sheer larger number of persons in the low-risk subpopulation. Consider, for example, a population of 1,000 persons, with 100 in a high-risk subpopulation and 900 in a low-risk subpopulation, and a rate of infection 4 times as high in the high-risk subpopulation as in the low-risk subpopulation; their rates of infection are 20% and 5%, respectively. In this hypothetical scenario, the high-risk subpopulation contributes 20 cases to the outcome compared to 45 cases from the low-risk subpopulation.
Similarly, epidemiologist Leon Gordis 2 demonstrated that for a typical risk factor, hypertension, that expresses itself on a continuum from the lowest to the highest rather than a dichotomy of high and low risk, that a large fraction of a population with moderate elevation of blood pressure accounts for more adverse outcomes than the small fraction of the population with higher blood pressures. These concepts represent an intellectual bridge between risk assessment and risk management. Rose also believed that the same levels of resources dedicated to individuals at high risk cannot be provided to a much larger population of individuals at low risk. His solution is a population-based preventive medicine approach for the larger low-risk subpopulation of the population to supplement the more intensive interventions commonly used for the high-risk subpopulation of the population. An example of a population-based approach is media advertising for smoking cessation.
Like the noncommunicable diseases previously mentioned, COVID-19 infection rates vary depending on high or low risk of exposure. An example of high-risk exposure is healthcare workers exposed to aerosol-generating procedures commonly used in intensive care units and emergency departments. In contrast, an example of low-risk exposure is senior citizens shopping in a market at an early hour designated for them. Respiratory protection similarly varies in effectiveness and cost, depending on the type of mask used. The effectiveness of respiratory protection ranges from homemade masks 3 to surgical masks, N-95 respirators (that capture 95% of droplets), N-99s, powered-air purifying respirators used in biosafety level 3 laboratories, and, finally, the highest level of containment, the full-body, air-supplied positive-pressure suits that use an external air source and are used in biosafety level 4 laboratories. Similarly, intensity of social distancing may range from individual quarantine to quarantine in group or family settings.
To elucidate the concepts of Rose applied to COVID-19, since actual data are not available, we imagined the following hypothetical scenario, illustrated in Figures 1, 2, and 3. We propose that a population of 5.5 million has 10 levels of exposure to SARS-CoV-2, and we can divide the entire population into 10 groups (Figure 1). The highest-level exposure group, Group 10, comprises healthcare workers involved in high-risk procedures and is the smallest group, which we set to 100,000. Each successive level of exposure adds an additional 100,000 members. The entire population is 5.5 million. Group 1, the largest group, is the lowest-risk group. If we assume that low levels of exposure correlate with infection levels, we can then assign an arbitrary risk of infection to the lowest of 1 per 100 population, as illustrated in Figure 2. As we move through the exposure levels from low to high, we can assume that each higher level of exposure adds an additional risk of 1 per 100 population, resulting in populations at risk of infection of 2 per 100, 3 per 100, and so on. As the numbers at risk in each level of exposure (Figure 1) is multiplied by the rate of infection in that exposure group (Figure 2), we can predict in Figure 3 the distribution of new infections across the 10 levels of exposure.
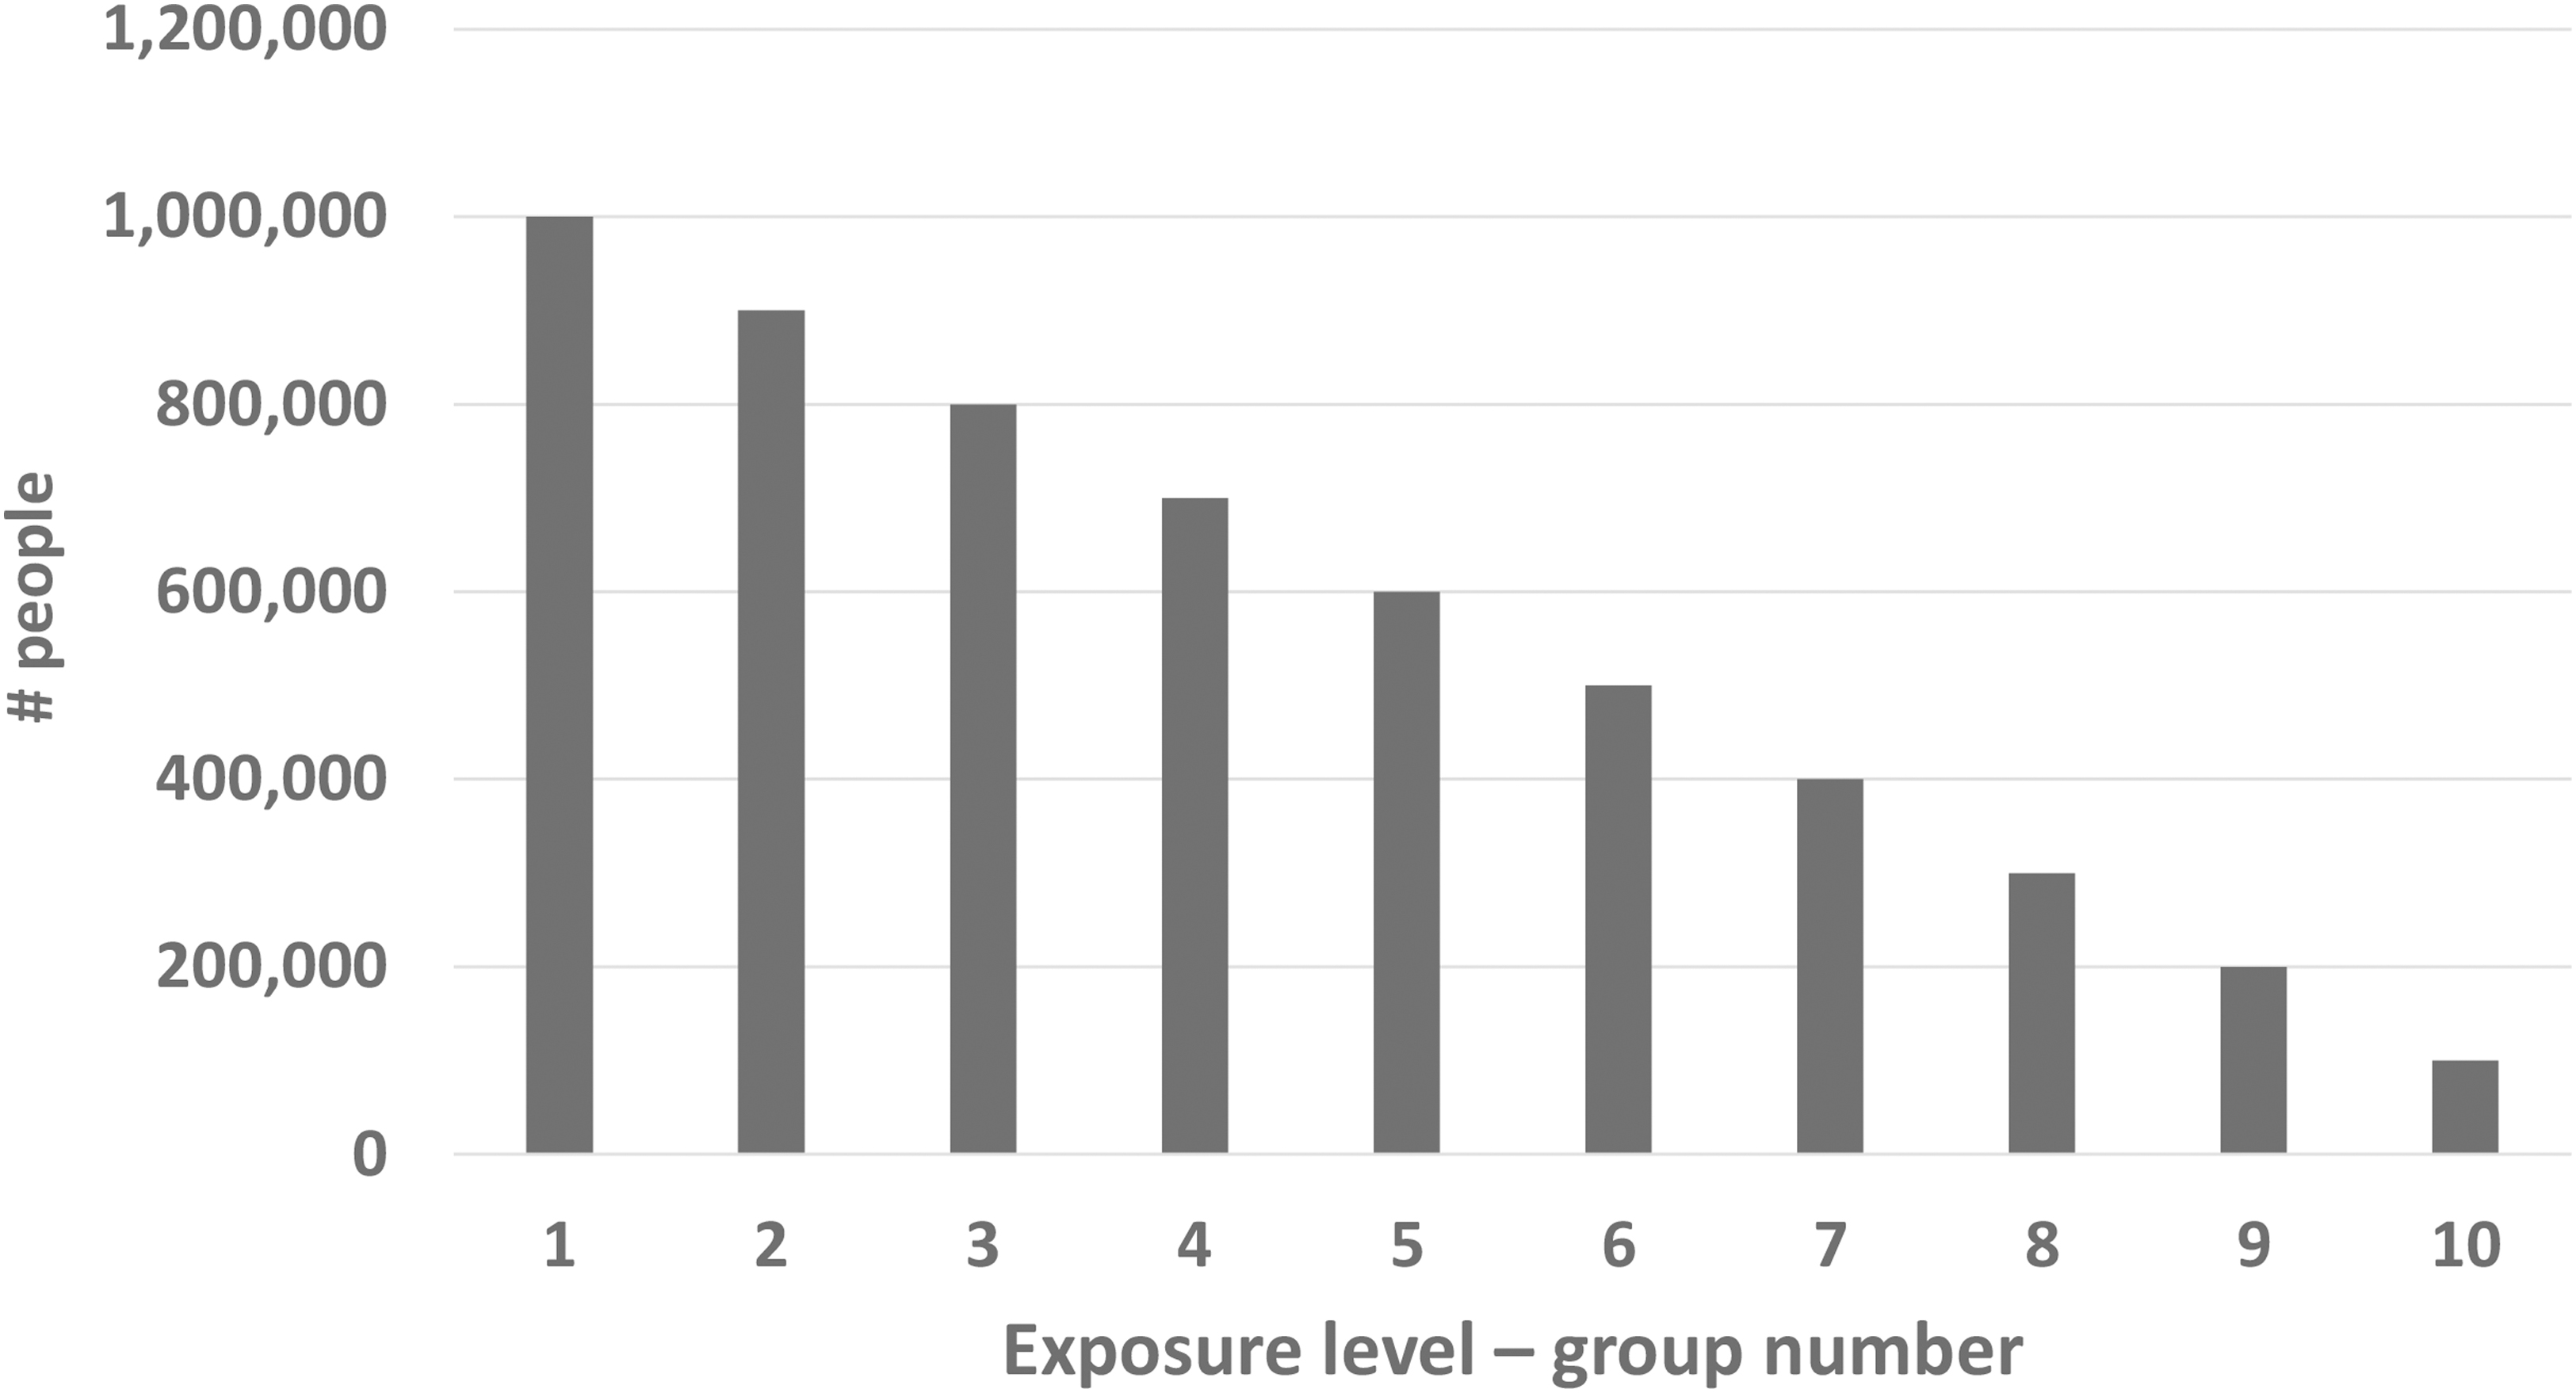
Distribution of population by 10 levels of exposure (1 = low; 10 = high).
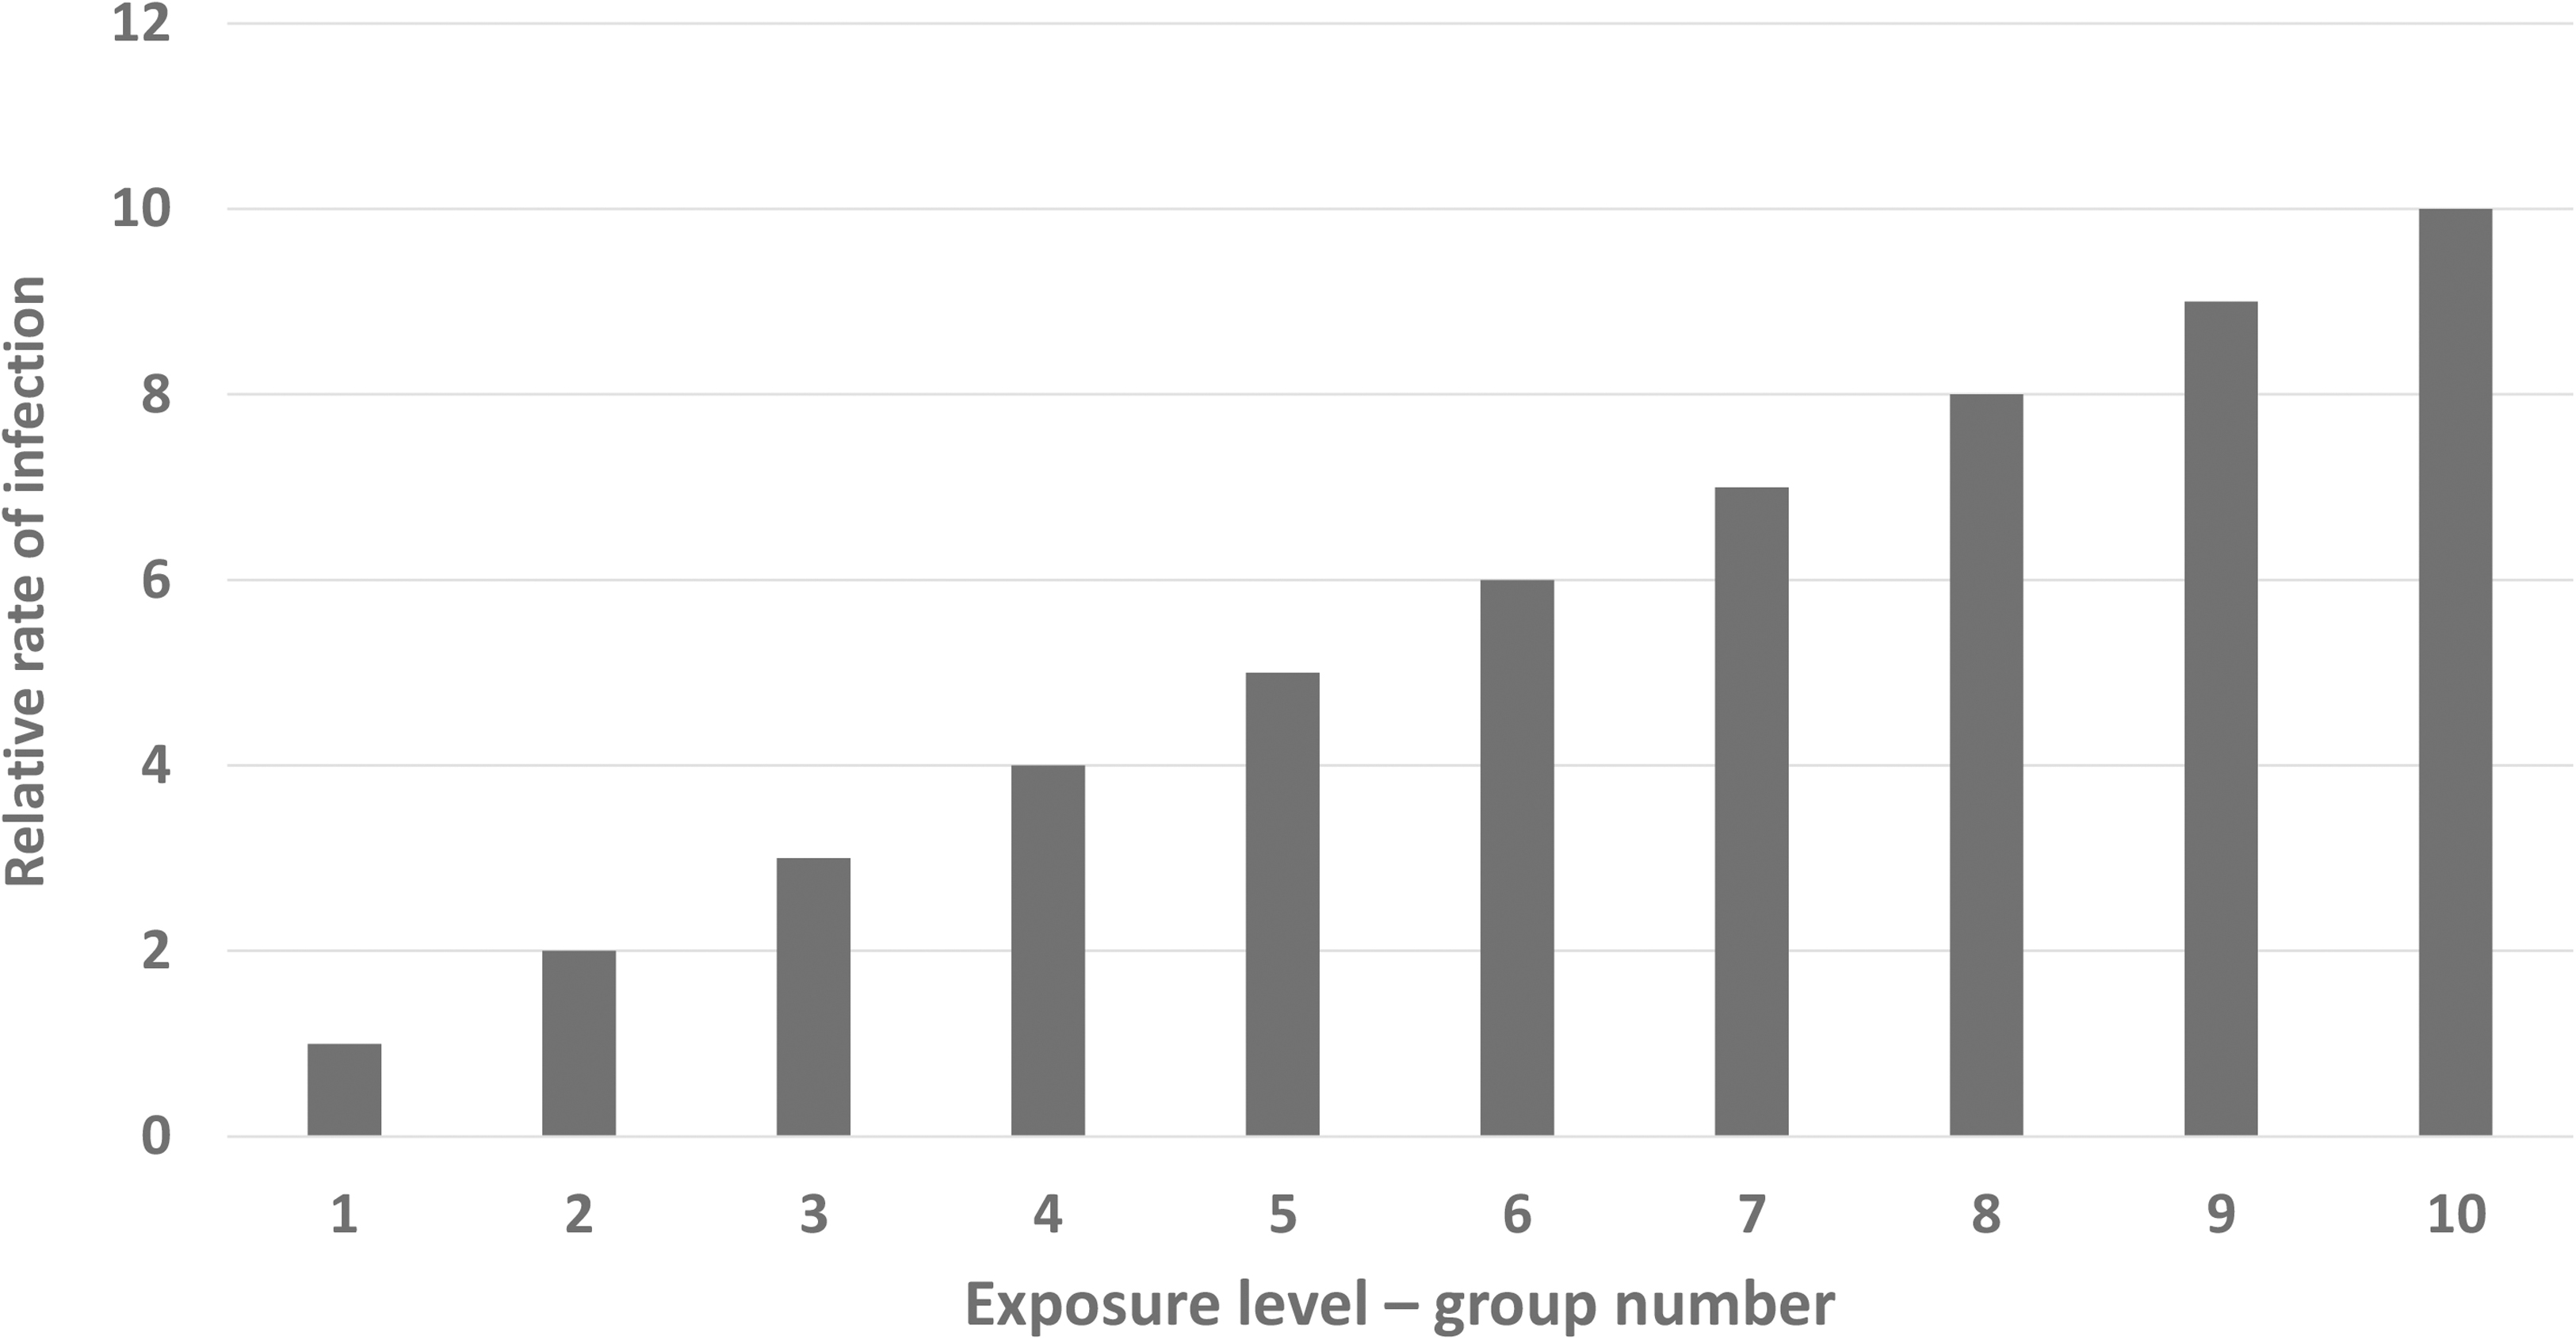
Relative rate of infection by 10 levels of exposure.
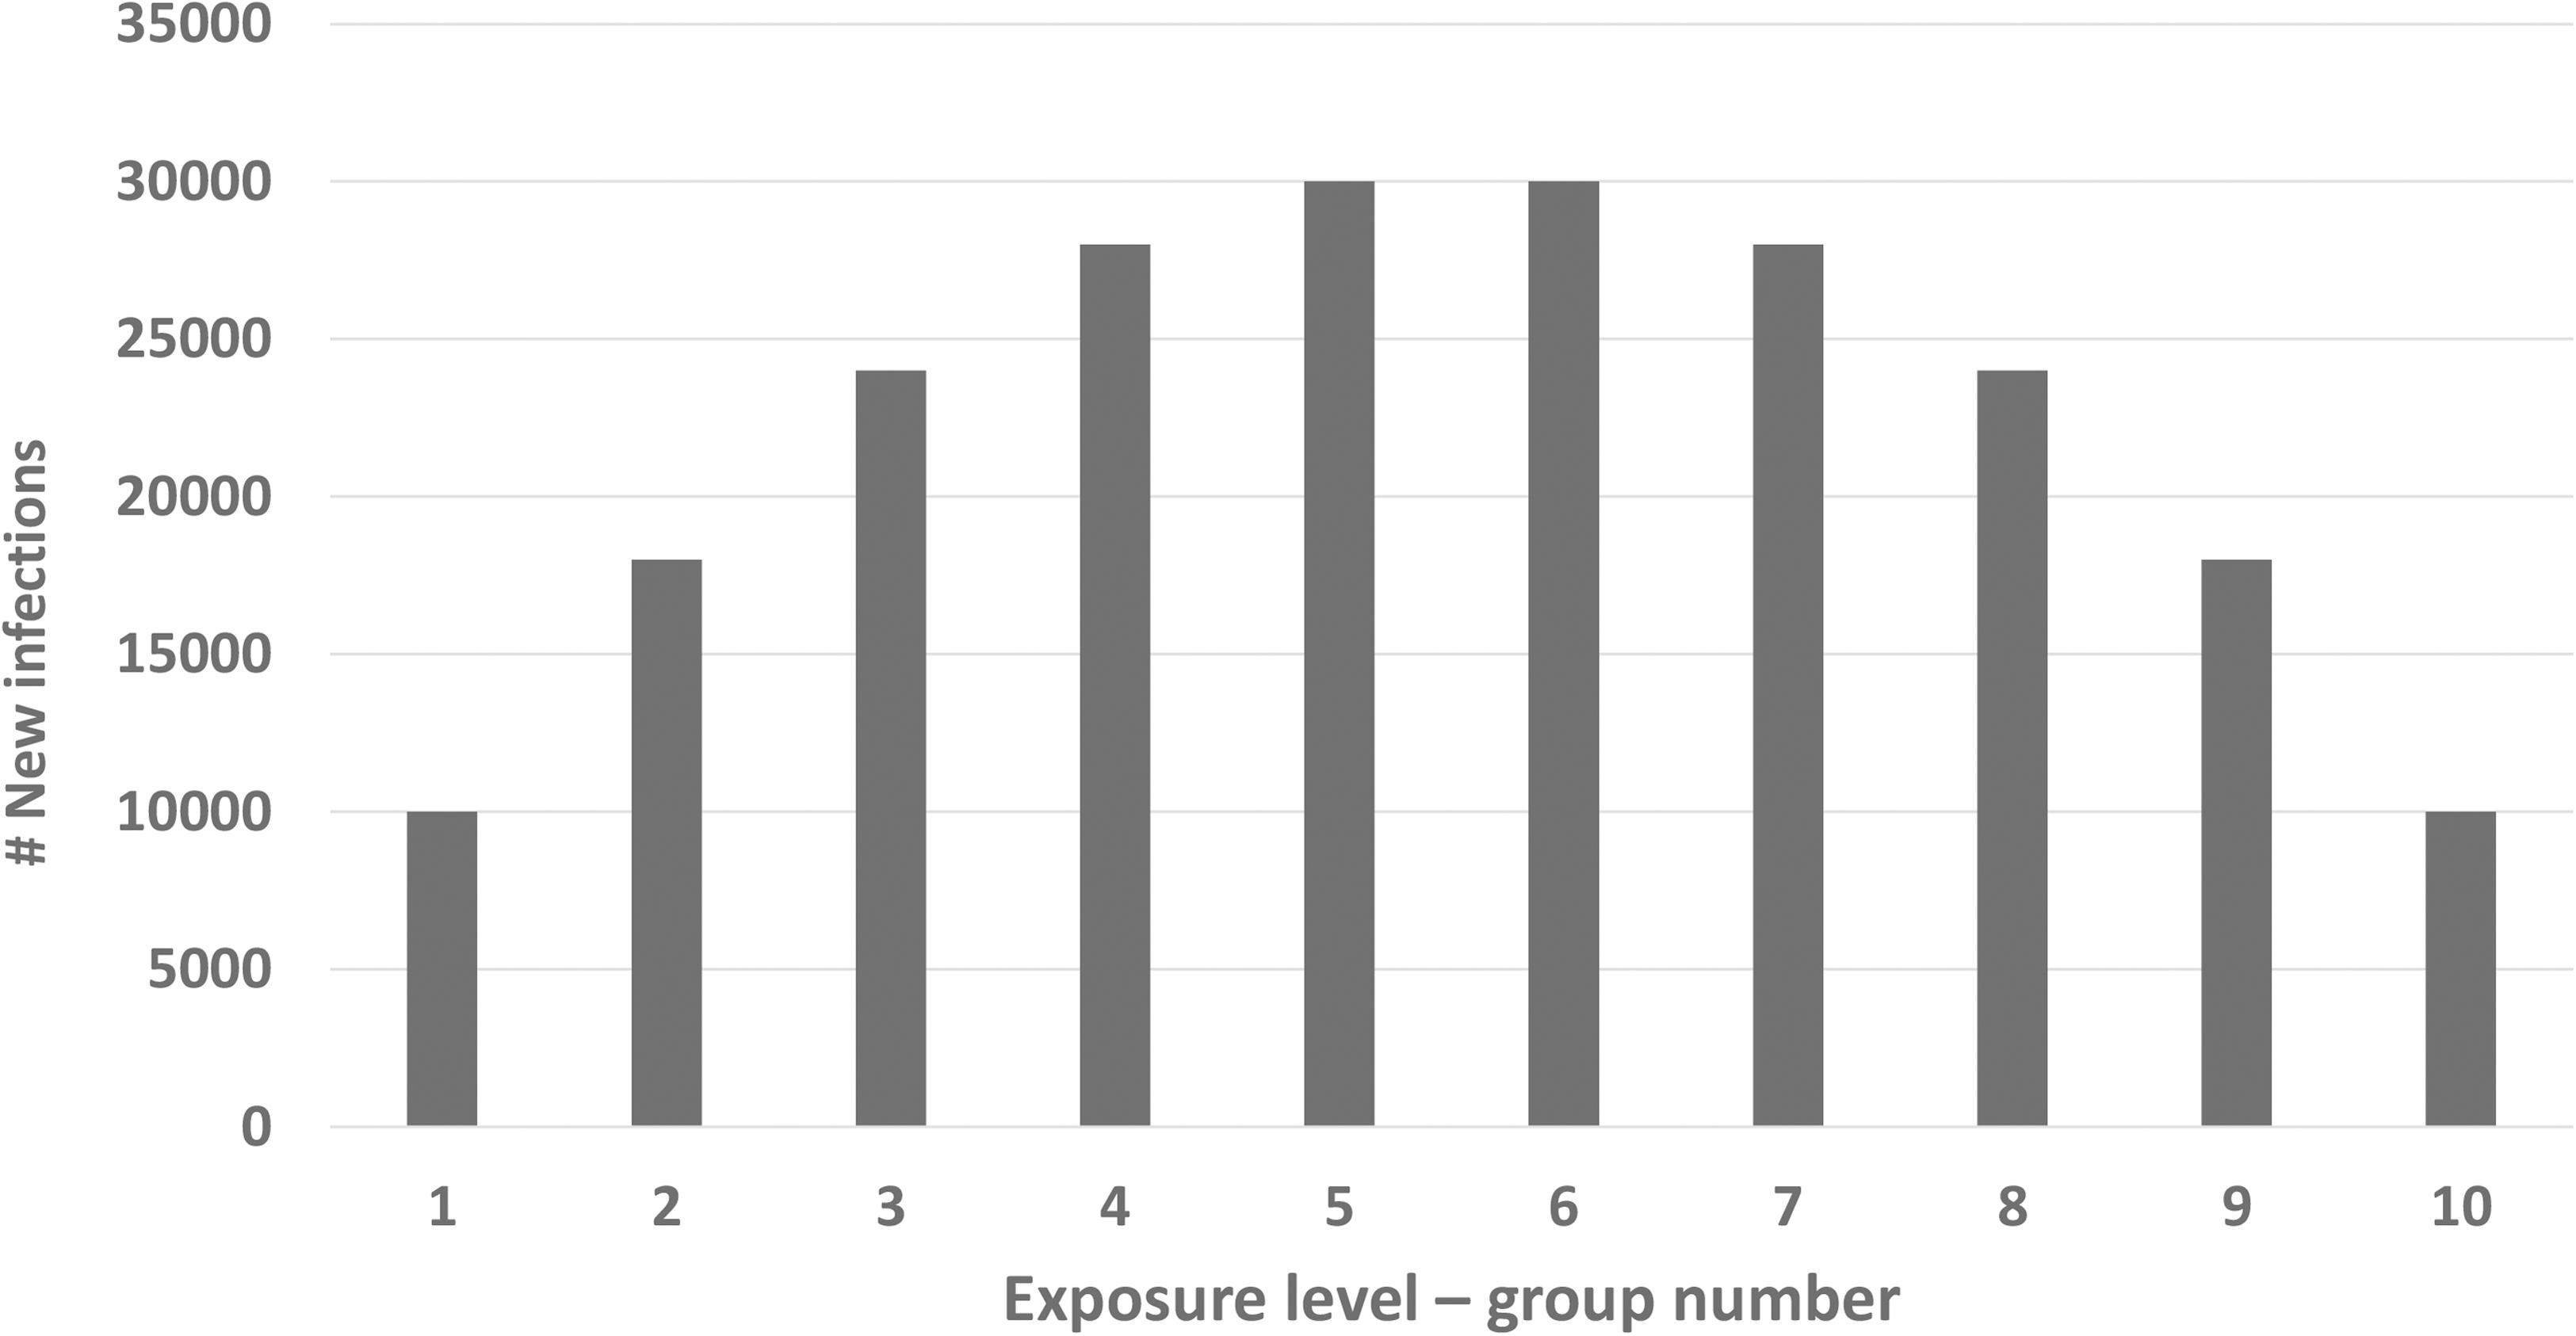
Distribution of new infections by 10 levels of exposure.
In this simulation, half of the new infections are in the top half of exposure groups, which have the smallest number of people. But, what may be surprising to some, half of new infections are also found in the bottom half of categories of exposure, which have the largest number of people. The implications of this exercise are as follows: to protect individuals in the subpopulation at high risk, we should use of the most effective interventions; however, to prevent a large number of cases and starve the epidemic of new sources of infection, we should also reduce exposure to those at lower levels of exposure through methods such as social distancing, somewhat effective personal protective equipment, and other measures.