
Abstract
Early detection of novel pathogens can prevent or substantially mitigate biological incidents, including pandemics. Metagenomic next-generation sequencing (mNGS) of symptomatic clinical samples may enable detection early enough to contain outbreaks, limit international spread, and expedite countermeasure development. In this article, we propose a clinical mNGS architecture we call “Threat Net,” which focuses on the hospital emergency department as a high-yield surveillance location. We develop a susceptible-exposed-infected-removed (SEIR) simulation model to estimate the effectiveness of Threat Net in detecting novel respiratory pathogen outbreaks. Our analysis serves to quantify the value of routine clinical mNGS for respiratory pandemic detection by estimating the cost and epidemiological effectiveness at differing degrees of hospital coverage across the United States. We estimate that a biological threat detection network such as Threat Net could be deployed across hospitals covering 30% of the population in the United States. Threat Net would cost between $400 million and $800 million annually and have a 95% chance of detecting a novel respiratory pathogen with traits of SARS-CoV-2 after 10 emergency department presentations and 79 infections across the United States. Our analyses suggest that implementing Threat Net could help prevent or substantially mitigate the spread of a respiratory pandemic pathogen in the United States.
Introduction
Pandemics pose a critical challenge for the 21st century, causing unparalleled morbidity and mortality, economic harm, and societal disruption.1,2 A primary difficulty in prevention and mitigation lies in the difficulty of recognizing infections quickly and comprehensively in the early stages of an emerging outbreak. 3 Early detection can significantly change the trajectory of a novel outbreak, increasing the likelihood it is contained, reducing spread to other jurisdictions, and enabling earlier countermeasure development and deployment.
Current infectious disease surveillance systems are poorly equipped for early detection of novel pathogens. Traditional laboratory assays cannot detect their presence, as they are designed to detect pathogens that we already know exist. Presymptomatic and symptom-based, event-based, and digital disease surveillance methods are not ideal, as they struggle to differentiate signal from noise in an outbreak's infancy when rapid action matters most.4-7 They also do not specify whether a disease is being caused by a novel or previously known pathogen. A better method of detecting novel pathogens is needed. Routine metagenomic next-generation sequencing (mNGS) of clinical samples holds promise due to its unbiased approach to pathogen detection. 4
mNGS is used to identify the responsible pathogen in a novel outbreak, but generally it is used after an outbreak is detected through means such as event-based surveillance.8,9 This typically occurs weeks, or more, after the index case. If mNGS were conducted routinely and integrated with healthcare systems, outbreaks caused by novel pathogens could possibly be detected weeks earlier, providing an opportunity to substantially change an outbreak's trajectory. Routine sequencing can also enhance the understanding of a novel pathogen's epidemiological and clinical characteristics in an outbreak's infancy, providing crucial information for early outbreak response.7,10
To date, mNGS has not been used for routine surveillance. Targeted genomic sequencing of patient samples and isolates is increasingly being used in public health surveillance to track variants of certain pathogen species, identify new variants, link cases together, and assess the efficacy of public health control measures.11,12 However, unlike mNGS, targeted sequencing is restricted in its scope to predefined pathogen species, limiting its ability to identify novel pathogens. Rapid developments in next-generation sequencing technologies are producing an order of magnitude reduction in cost per base sequenced, which may make routine use of mNGS more feasible. 13 Further research and development will be needed across key technology areas, as outlined in Table 1.
Abbreviation: mNGS, metagenomic next-generation sequencing.
In this article, we describe a susceptible-exposed-infected-removed (SEIR) epidemiological model to estimate the cost and epidemiological effectiveness of routine clinical mNGS for detecting novel respiratory pathogen outbreaks. We examine an mNGS architecture called “Threat Net” that investigates clinical samples from patients with fever and acute respiratory symptoms for novel pathogens who present to a network of emergency departments (EDs) strategically placed across the United States. Our analysis fulfills 3 main purposes: it serves as a starting point to quantify the value of mNGS of clinical samples for respiratory pandemic detection, as an estimate of how its effectiveness and cost may change with differing degrees of population coverage across the United States, and finally to define potential targets for technological developments and further investments.
Threat Net: An mNGS Surveillance System
Threat Net is a metagenomic sequencing-based biosurveillance network deployed strategically in EDs across the United States. When patients with influenza-like illness (ILI; acute onset fever and cough or sore throat) present to an ED within this hypothetical network, a sample is collected for diagnostic testing. In addition to running this sample on standard-of-care molecular tests, an aliquot of the specimen is analyzed in parallel by an mNGS protocol. The sequence is compared in real time to sequence databases to check for matches to known pathogens.17,18 If a novel sequence is identified, it is reviewed by a team of infectious disease experts, microbiologists, bioinformaticians, and public health officials who can interpret the observations and react proportionately, triggering an outbreak investigation or other public health measures when appropriate (see Figure 1).
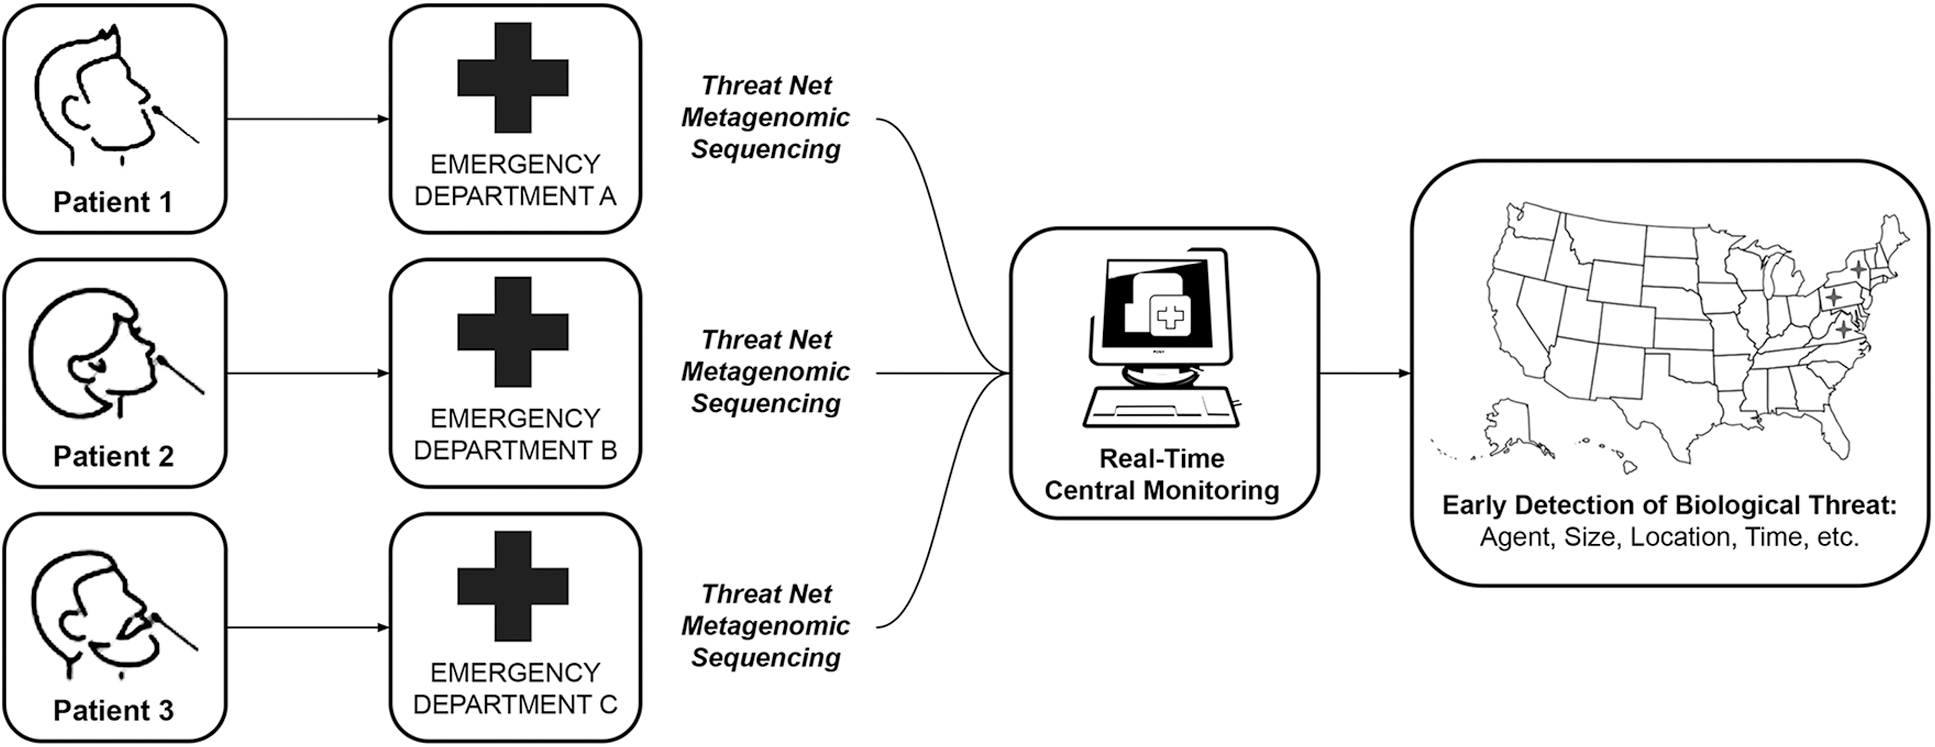
The proposed architecture of Threat Net, a metagenomic sequencing-based surveillance network.
Methods
Model Overview
We develop a SEIR-based simulation model to estimate Threat Net's ability to detect novel respiratory pathogen outbreaks in the United States (see Figure 2). We simulate if and when patients infected with a novel respiratory pathogen present to Threat Net hospitals, following a single introduction of the novel pathogen in the United States. We use this simulation to estimate the cumulative probability of detection of a novel pathogen as infections rise, and to estimate the day of detection after pathogen introduction with a SEIR model.
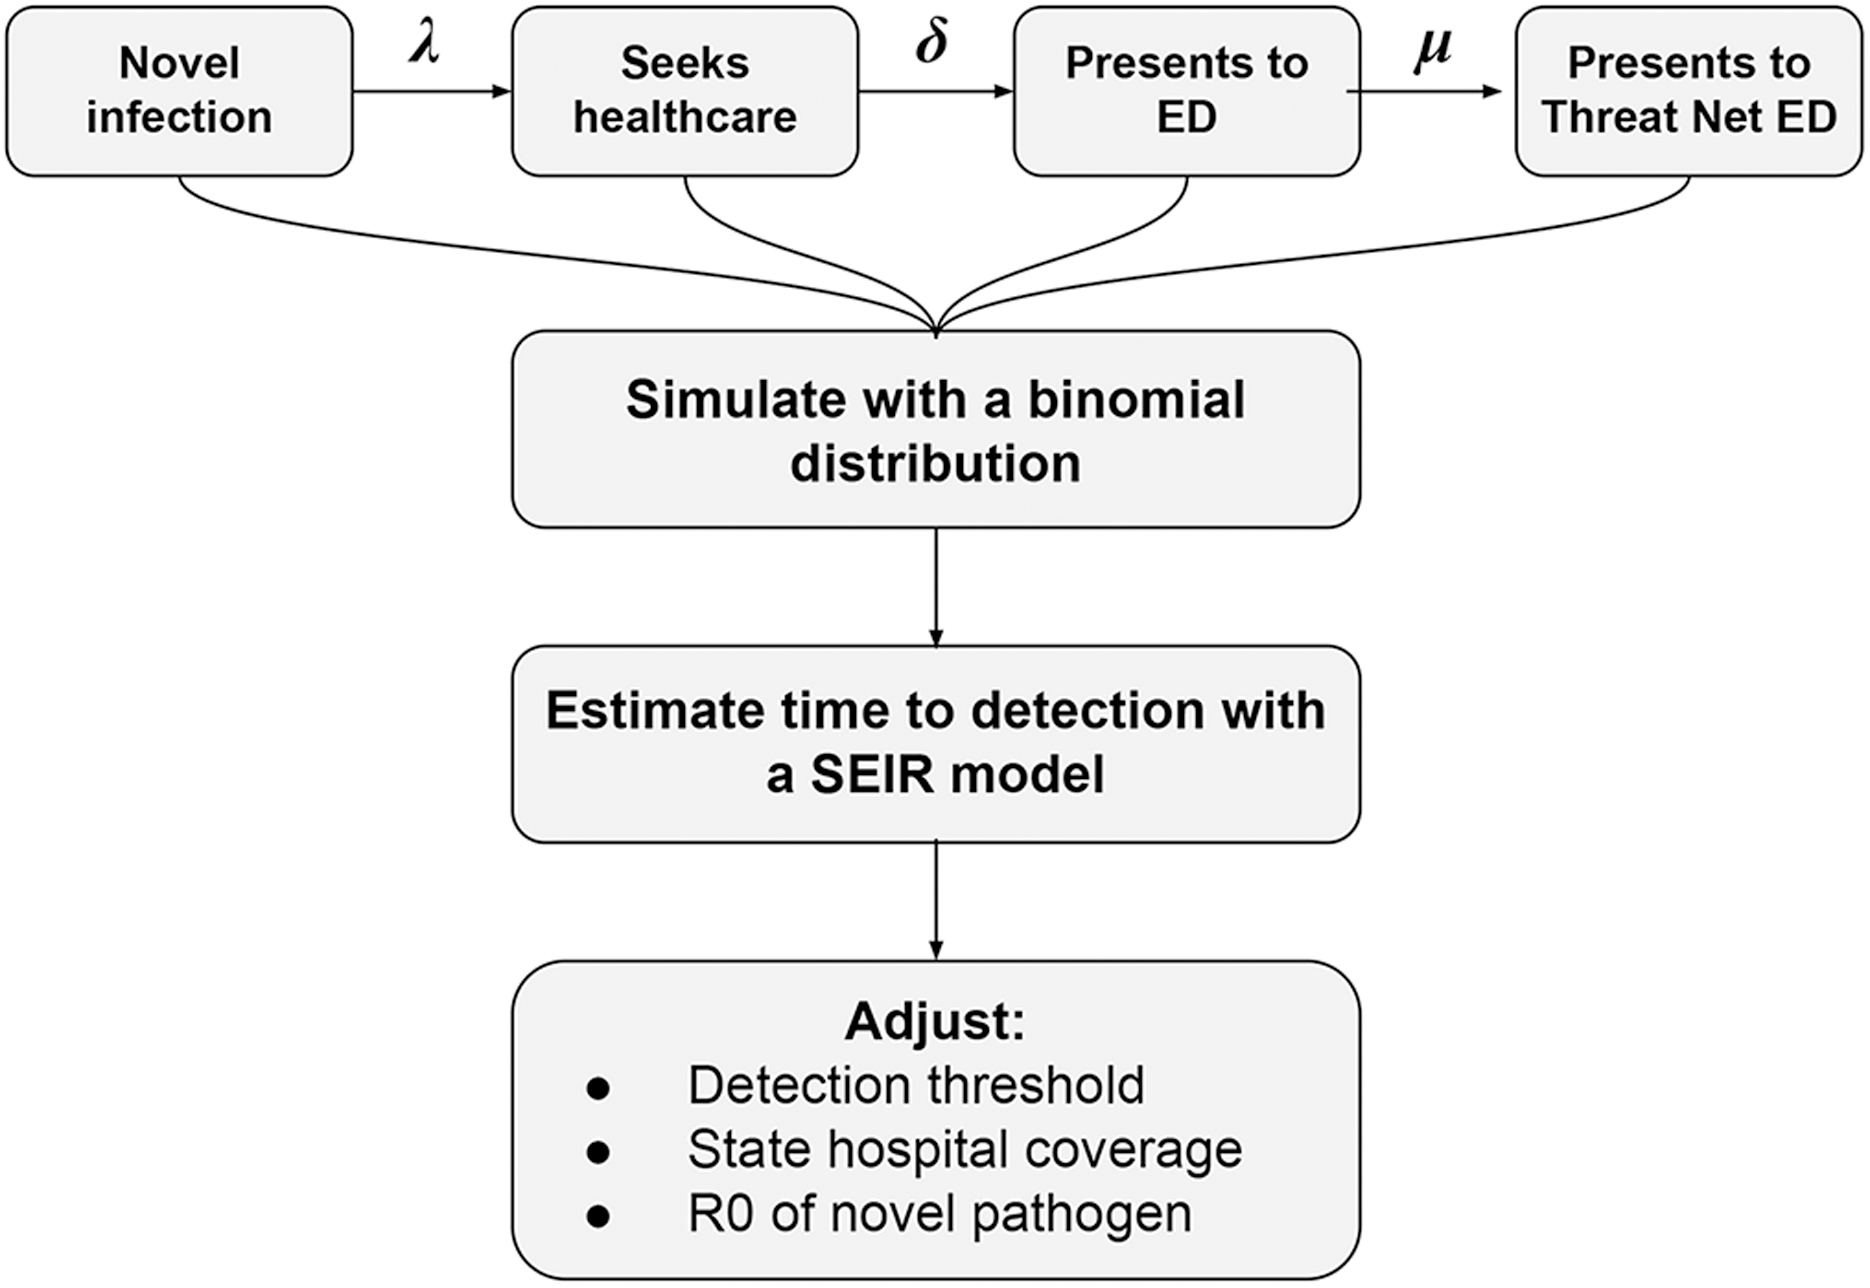
The simulation model underlying the estimation of Threat Net's ability to detect outbreaks of novel pathogens in the United States, where λ represents the probability that an infected person seeks healthcare, δ represents the probability that an infected person seeks healthcare at an emergency department, and μ represents the probability of that emergency department participating in the Threat Net network. Abbreviations: ED, emergency department; R0, basic reproduction number; SEIR, susceptible-exposed-infected-removed.
We adjust a range of factors including (1) the coverage of Threat Net within a state, (2) the detection algorithm, and (3) the basic reproduction number (R0) and incubation period of the novel pathogen. These latter epidemiological characteristics are derived from characteristics of SARS-CoV-2 wild-type (wt) strain and similar emerging respiratory pathogens (see Table 2). These pathogens possess traits previously hypothesized to be most characteristic of a novel pandemic pathogen (eg, relatively high severity, efficient human-to-human transmissibility, and the occurrence of presymptomatic spread and mild illness). 25
Epidemiological Characteristics of Various Disease-Causing Pathogens Used in the Threat Net Model
Note: β is the average number of contacts per person per time, multiplied by the probability of disease transmission via a contact between a susceptible and infectious individual. Exposed individuals become infectious at a constant rate σ and infected individuals are removed at a constant rate γ.
We estimate the cost of this system based on the amount of testing we would expect to conduct if we aimed to routinely test all patients presenting to selected EDs with ILI, at varying degrees of geographic coverage. Testing this broader group of patients who present with ILI (acute onset fever and cough or sore throat) is expected to provide an increased but more realistic estimate of cost. This is in contrast to our detection model that focuses on the rarer situation of a novel respiratory pathogen, and models how quickly a novel pathogen similar to SARS-CoV-2 wt would be detected by Threat Net.
Simulating ED Presentations
The simulation of ED presentations at Threat Net hospitals can be represented by the following equations:
Where U is a random number between 0 and 1, i is the nth number of infections and t the nth trial of simulating whether at least 1 infected person presents to a Threat Net hospital per given number of infections.
We simulate scenarios from 1 to 150 cumulative infections, with 1,000 trials for each scenario. The random number U is used to determine if at least 1 presentation occurred at a Threat Net hospital. That is:
Equation (3) represents a binomial distribution given the outcome of interest has a binary outcome (ie, whether a case presented at a Threat Net hospital or not). p is the probability an infected person presents and is tested at a Threat Net hospital and P is the probability at least 1 infected person presents and is tested at a Threat Net hospital for a given number of infections.
p is the product of the probability that an infected person seeks healthcare (λ), that they seek healthcare at an ED (δ), and the ED participates in Threat Net (μ). We attempt to estimate these values using the literature; however, data regarding these healthcare-seeking rates are sparse. For this example, we assume 50% of cases seek healthcare, as previously estimated for ILI by meta-analysis 26 ; data on these rates for SARS-CoV-2-like pathogens in particular are not available. Notably, the meta-analysis did not include asymptomatic cases, which are therefore excluded in our analysis. We then assume 25% of healthcare seekers will present or be referred to an ED specifically, modeling a novel respiratory pathogen similar in severity to SARS-CoV-2 wt. This assumption is based on an online survey that found 5% of health seekers with ILI present to the ED. 27 We estimate that ED presentations for an illness similar to SARS-CoV-2 wt would be 5 times higher than ILI presentations, considering SARS-CoV-2 wt has roughly a 5 times higher case-hospitalization rate than ILI for those who report illness.28-30 Therefore, λ=50% and δ=25%.
We assume the probability of an ED presentation occurring at a Threat Net hospital (μ) is equivalent to the proportion of population covered by hospitals in a state that are part of the network. For example, if hospitals covering 30% of the population are equipped with metagenomic screening capabilities within a given state, then an infected person seeking care at an ED has a 30% chance of attending an ED within the Threat Net network (μ=30%). We assume for simplicity all infected persons have an equal chance of attending any ED in a state. We segment by states rather than by metropolitan areas, as there is more detailed hospital data available for states as compared with metropolitan areas. 31 In reality, an approach focused on metropolitan areas would be more efficient given urban hospitals have a higher probability for emergence, and are often located in travel hubs with higher population densities.
We then estimate the probability of detection as infections rise, by dividing each Threat Net detection by the number of trials.
We replicate each scenario 10 times to visualize the stochasticity and increase confidence in our probability estimate (totaling 10,000 simulations for each scenario).
We adjust the state population coverage (ie, modifying μ to 10%, 50%, and 70%) and assess how this influences the number of infections at detection. Further, we adjust the detection algorithm from 1 novel genome sequence collected at a Threat Net hospital to 3 and 5 matching genome sequences (eg, over 99% matching between the genetic code) collected at Threat Net hospitals. This is to account for the uncertainty attached to the number of presentations required to trigger an outbreak investigation and allow for missed detections of infected patients.
Estimating Time to Outbreak Detection
We use a classical SEIR model to estimate the time to outbreak detection from a single novel pathogen infection within the United States.32,33 It considers 4 compartments: the susceptible population S(t) at time t (healthy individuals who have not been exposed to the disease); the exposed population E(t) (individuals who have contracted the virus but are not yet infectious); the infectious population I(t) (infectees that are infectious); the removed population R(t) (the number of individuals who can no longer infect others). The model is described by the following equations:
β is the average number of contacts per person per time, which is then multiplied by the probability of disease transmission via a contact between a susceptible and infectious individual. Exposed individuals become infectious at a constant rate σ and infected individuals are removed at a constant rate γ. We adjust the transmission rate, latent period, and removal rate to reflect the reproduction number of the following respiratory pathogens: SARS-CoV-2 (wt), SARS-CoV-2 (Omicron variant), SARS, seasonal influenza, and 1918 pandemic influenza. See Table 2 for the different parameters used.
Cost of Threat Net Architecture
The cost to set up (IS) and operate (OS) Threat Net in a state can be represented by the following equations:
HS,p is the number of hospitals required to cover a proportion (10%, 30%, 50%, and 70%) of relevant patient ED presentations within a state. We use hospital bed numbers as a proxy to estimate the number of hospitals required to cover a given percentage of ED presentations within a state. US hospital data show that the number of beds in a hospital correlates linearly with the number of ED presentations it receives. 31 Thus, the number of hospitals required to have 30% of beds attached to a Threat Net hospital within a state is approximately equivalent to the number of hospitals required to cover 30% of ED presentations within a state. We assume a state would optimize the deployment of Threat Net hospitals by first installing metagenomic sequencing surveillance at the most frequently visited hospitals, thereby reducing installation costs, but we do not explicitly model metropolitan areas.
Our cost estimates are based on 2023 market values in the United States. M is the cost of sequencers per site. We assume 2 sequencers per site to facilitate daily sequencing (run times are between 24 and 36 hours) at a cost of $320,000,* which is equivalent to the cost of a NextSeq 1000 (Illumina, San Diego, CA). L is the annual salary of 4 full-time equivalent laboratory scientists per site, which we assume is $100,000 per scientist based on the US Bureau of Labor Statistics.
34
We conservatively staff sites with enough laboratory scientists to process 80 samples a day.
35
C is the amount of annual cloud compute required per site. We assume each site uses an n1-standard-8 instance that consists of 8 vCPUs and 30 GB of RAM for 12 hours per day, costing $20,000 per site. S is the cloud storage required per site. We estimate it costs $4,000 per site to store genome sequences, assuming 3 GB per genome and a 10% test positivity rate. F is the floor space required per site, which we estimate costs $23,000. Our estimate is based on an inflation-adjusted costing analysis of PulseNet, which estimated an annual cost of $17,500 per year for floor space to accommodate pulsed-field gel electrophoresis in 2009.36,37
We assume sequencing reagents cost $2,300 per run and sample preparation reagents cost $60 per sample.37-39
The number of annual specimens processed is based on an estimate of ILI ED visits in the United States using the HealthCare Cost and Utilization Project State Inpatient Databases. 40 We estimate ILI ED visits in the United States are on average 3,346 per 100,000 people per year and multiply this rate by the population of the state (NS) and the proportion of ED presentations covered by Threat Net within a state (ie, 10% to 70%).
The number of specimens that can be multiplexed (
We sum costs for 10 years at different coverage levels, using a discount rate (r) of 3% as recommended by the First and Second Panel on Cost-Effectiveness in Health and Medicine:
41
We annualize 10-year costs and provide 90th percentile confidence intervals based on a Monte Carlo simulation using a lower and higher estimate for parameters with the greatest uncertainty. They include ILI population rates, sample preparation costs, and the number of additional sequencers and laboratory required per hospital (see Supplemental Materials for details, www.liebertpub.com/doi/suppl/10.1089/hs.2022.0160). Data and code for our model are available via the open source repository OSF: https://osf.io/t7zjr/?view_only=5fe41c489b9a4a948f41eb7f40243efa.
Results
Outbreak Detection
The probability of detection increases as infections rise, especially in the early stages of an outbreak. Our model estimates a 50% chance of detection at 19 infections in the United States for a pathogen with traits similar to SARS-CoV-2 wt if 30% of the US population is covered by hospitals equipped with metagenomic sequencing capabilities (see Figure 3). Our estimate increases to 80% at 43 infections and 95% at 79 infections (or approximately 5 and 10 ED presentations respectively). A 95% chance of detection corresponds to detection 50 days after index introduction (see Figure 4 and Table 3). Earlier detection can be achieved with 70% Threat Net population coverage; there is a 95% chance of detection at 33 infections and 4 ED presentations, corresponding to detection 40 days after introduction. Conversely, detection is significantly delayed at 10% coverage; there is a 95% chance of detection at 238 infections and 29 ED presentations, corresponding to detection 64 days after introduction.
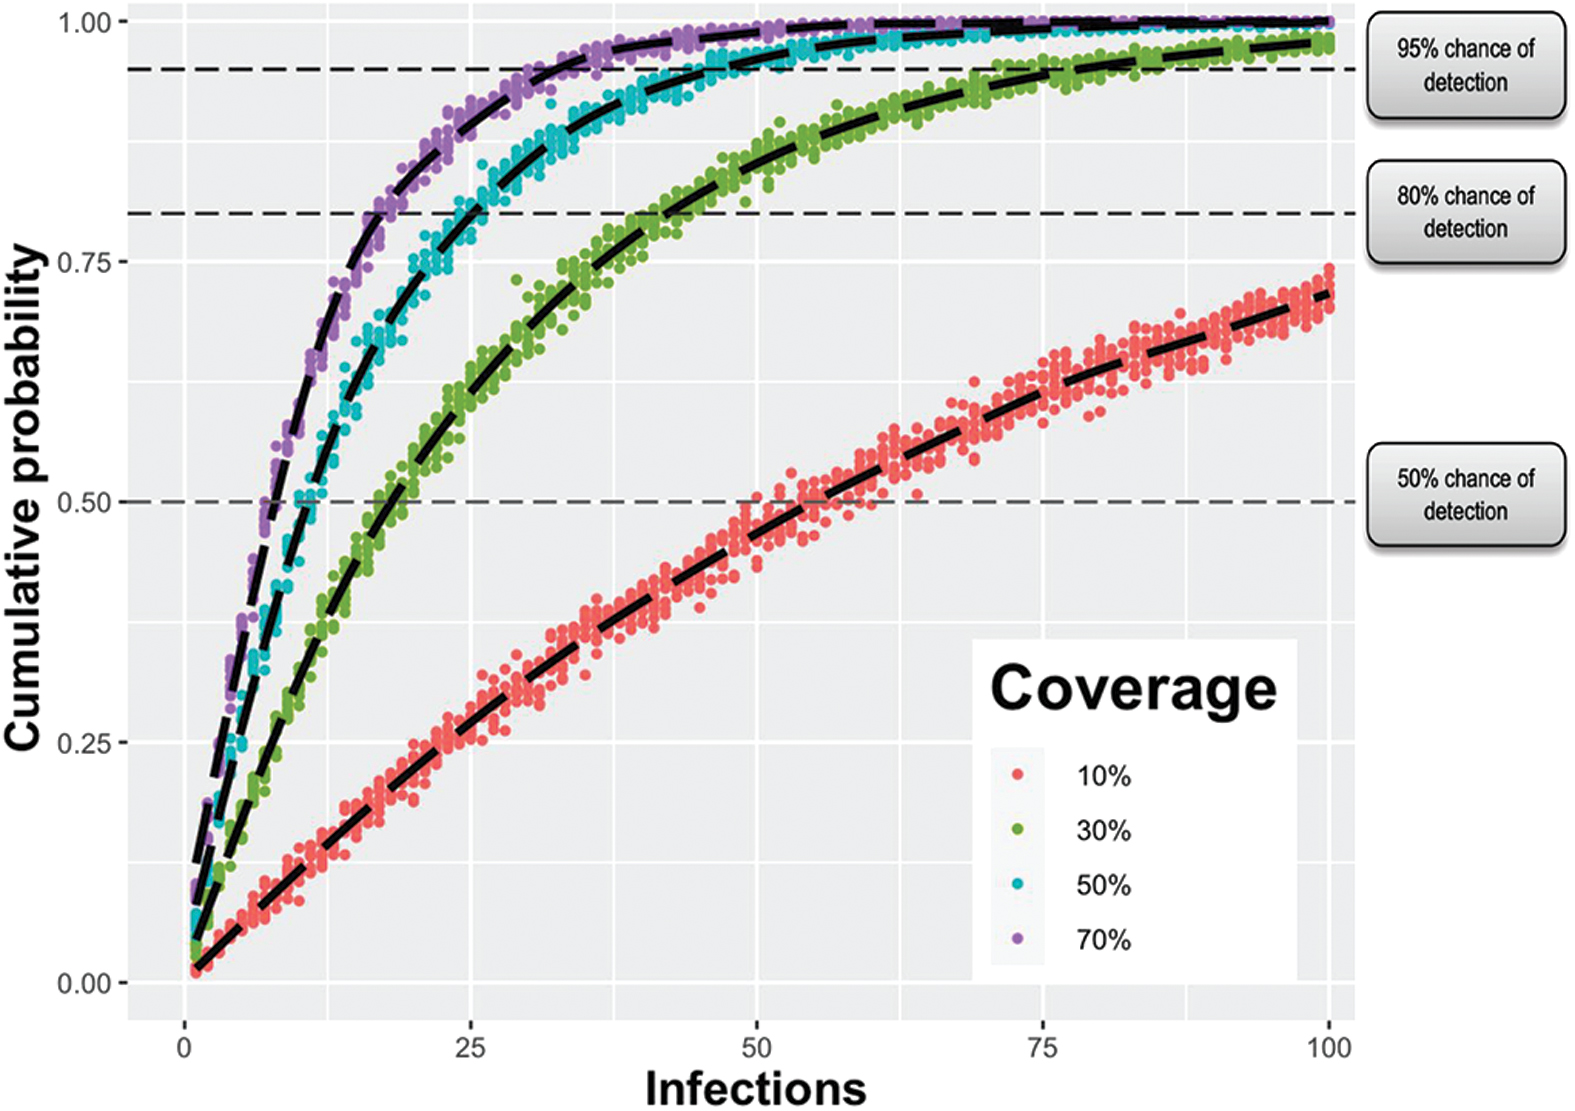
Cumulative probability of Threat Net detecting a novel pathogen with characteristics of SARS-CoV-2 wild type at different hospital coverage levels. This assumes 50% of people with infections seek healthcare, of which 25% visit an emergency department. Coverage refers to the percentage of hospitals connected to the Threat Net network. Color images are available online.

Estimated mean number of infections and days to detection of a simulated outbreak with Threat Net hospital coverage levels of 10%, 30%, 50%, and 70%, and 1 novel genome detected (compared to 3 or 5 matching novel genomes). The R0 and incubation period were adjusted to reflect common respiratory pathogens. Abbreviations: INF_1918, 1918 influenza; INF_s, seasonal influenza; SARS, severe acute respiratory syndrome; SARS_CoV_2_o, SARS-CoV-2 (Omicron; BA.1/B.1.1.529); SARS_CoV_2_w, SARS-CoV-2 (wild type). Color images are available online.
Estimated Number of Infections and Days From Introduction Threat Net Detects a Simulated Outbreak at 95% Probability
Note: With hospital coverage levels from 10% to 70%. Estimates are provided for differing detection algorithms. For example, a detection algorithm of 3 implies an outbreak investigation would occur following the detection of 3 matching novel pathogen sequences. A novel pathogen with a similar R0 and incubation period to SARS-CoV-2 wild type was modeled to derive the day of detection from the index introduction.
Adjusting the Detection Algorithm
There is a 95% chance of detection at 164 infections if the detection algorithm is raised to 3 matching genome sequences and 30% Threat Net population coverage. Detection would occur approximately 59 days after a single introduction, assuming a similar R0 and incubation period to SARS-CoV-2 wt (see Table 3). If the detection algorithm was raised further to 5 matching genome sequences, we estimate a 95% chance of detection with 30% coverage at 241 infections. However, we estimate it would only delay detection by 5 days given the exponential nature of pandemic transmission.
Estimating US Coverage Needs and Costs
California, with a population of about 40 million, has 353 hospitals and requires 39 EDs equipped with metagenomic sequencing capabilities to cover 30% of ED presentations. This is in contrast to Washington State, with a population of about 8 million, which has 91 hospitals and requires 6 EDs equipped with metagenomic sequencing capabilities to cover 30% of ED presentations. The relationship between state population size and hospital installation requirements to cover 30% and 70% of ED presentations is illustrated in Figure 5, with California situated above the trend lines and Washington below.

Relationship between US state population sizes and the number of Threat Net hospitals required to cover 30% (blue plot) and 70% (red plot) of emergency department presentations. States situated below the blue and/or red trend line require fewer installations per population size compared to other states. Color images are available online.
By aggregating state data, we estimate the United States would need to equip 356 hospitals across the country to cover 30% of the population. We estimate this would cost $200 million to install, $700 million to operate annually, and $6 billion across 10 years (90% CI, 4 to 8; or between $400 million and $800 million 10-year annualized costs), assuming a 3% discount rate for costs. Additional permutations can be found in Table 4. There are increasing marginal costs with increasing coverage; we estimate it would cost $10 billion (90% CI, 7 to 20) and $20 billion (90% CI, 10 to 30) over 10 years to cover 50% and 70% of ED presentations, respectively.
Cost of Threat Net Architecture at Different Population Coverage Levels
Note: Estimates are based on the assumption that the largest hospitals within states are equipped first. A discount rate of 3% is used to calculate the 10-year cost. Cost estimates are rounded to 1 significant figure. Annualized costs only consider costs 10 years from implementation.
Discussion
We estimate that a biological threat detection network such as Threat Net has a 95% chance of detecting a novel respiratory pathogen with characteristics similar to SARS-CoV-2 wt after approximately 10 ED presentations and 79 infections across the United States, with 30% population coverage, and costing between $400 and $800 million annually.
These findings suggest that Threat Net could facilitate containment of a novel respiratory pathogen with characteristics similar to SARS-CoV-2 wt that started in the United States, or could help prevent its spread within the United States if the outbreak began elsewhere. Current genomic estimates suggest that the first COVID-19 infection was in mid-October to mid-November of 2019, 2 months earlier than the Wuhan cluster of infections identified in late December 2019. 42 Full recognition of the spread of SARS-CoV-2 and its pandemic potential did not occur until months later. Retrospective analysis suggests that at the time of identification and reporting in late December 2019, 174 cases were ascertained. This corresponds to approximately 350 infections (assuming a high ascertainment rate of 0.5), which is a considerably higher threshold than a 95% chance of detection at 79 infections via Threat Net, as estimated above, for a SARS-CoV-2-like novel pathogen. 43 Community transmission of COVID-19 in the United States was first recognized on February 28, 2020. 44 Diagnostic testing until that point had been limited to patients with direct travel history or known exposure, vastly limiting detection of community transmission and clusters leading to undetected widespread outbreaks. Subsequent research indicated that COVID-19 had been spreading through the community since January and had been undetected due to limited diagnostic testing. During this period the outbreak doubled between 2.4 and 5.1 days, highlighting the need for an early detection system such as Threat Net.
Threat Net applies the same approach used to prevent catastrophic forest fires: real-time surveillance for smaller brush fires, followed by extinguishing them immediately. Threat Net would also enable a richer and more timely appreciation of a pathogen's early disease dynamics. Genome sequences can be used in many ways to help characterize the behavior of a virus, particularly if sampling is representative and unbiased, as metagenomic sequencing is considered to be. The degree of diversity within available sequences can in certain instances strengthen estimates for the epidemic growth rate, reproduction number, and timing of the index case.7,10 Genome sequences can also help ascertain transmission routes by identifying clusters of related cases. These inferences would arrive earlier with a systematic application of mNGS, or be made with more confidence at any given time.
Even if the strategic incorporation of mNGS within public health surveillance systems fails to contain an outbreak, it may be used as a temporary diagnostic during the early stages and serve to expedite the development of more rapid diagnostics, therapeutics, and vaccines. Once the pathogen is known, the sequencing protocol can be modified to select for and amplify the pathogen of interest, reducing the cost and improving the performance of the test. Sequencing can be scaled substantially with multiplexing and barcoding, and provide the means to establish a sentinel site and help ascertain mildly symptomatic, presymptomatic, and asymptomatic transmission. Additionally, the earlier a pathogen is sequenced in the context of a pandemic, the earlier countermeasures can be developed. The sequence would contribute to the design of antigen, nucleic acid amplification, serological, and CRISPR-based diagnostics, shortening the time it takes to test at scale. Drug discovery, reformulation, and clinical trials could start earlier, reducing the time it takes to find effective therapeutics. The same applies to vaccine development; Moderna's mRNA vaccine was designed within 2 days after the SARS-CoV-2 sequence became publicly available. 45
This study provides early estimates of how a nationwide mNGS pathogen early detection system could function. Relevant decisionmakers would benefit from further expansion and refinement of our model, which could be done in several important ways, including the incorporation of stochasticity and additional compartments. For example, including compartments for presymptomatic, asymptomatic, and mildly symptomatic states would provide a more realistic depiction of spread for a novel virus like SARS-CoV-2. Moreover, stochasticity could be used to model the novel pathogen's characteristics from its initial emergence to its spread within the United States (eg, by randomly sampling from a distribution for the incubation period, infectious period, transmission rate, recovery rate, and health-seeking rate).
Further work could modify the metagenomics sampling strategy to consider more targeted and affordable testing strategies, such as only testing people with ILI who have tested negative on a PCR panel for common respiratory pathogens. Alternatively, sampling could be broadened to a range of different clinical syndromes such as pyrexia of unknown origin or people presenting with gastrointestinal symptoms. Broader sampling selection would provide a more comprehensive and robust strategy as many novel pathogens of concern do not cause respiratory symptoms. We also implicitly assume a 100% mNGS sensitivity for detecting novel pathogens—this is difficult to quantify given the variability in novel pathogens but warrants further exploration.
Relevant decisionmakers would also benefit from seeing which areas of the United States would most likely experience an introduction from overseas. This could be achieved using air traffic and geospatial data and could help define which metropolitan and rural areas are the greatest priorities, with consideration given to outbreaks driven by multiple introductions. Regarding cost estimates, the discount rate could be modified to more realistically reflect the costs of sequencing over the next 10 years. We estimated a projected 20% annual drop in the price of sequencing, based on the last 5 years of National Human Genome Research Institute data, which is much higher than the 3% used in our analysis. 13 Conversely, there may be costs that were not incorporated in our estimates, such as higher-level processing of metagenomic data at public health departments receiving information from hospitals across a state. We think these costs would be small compared with mNGS operational costs, but these estimates could be explored in future work.
More empirical data would also strengthen the analysis. A clinical trial could be conducted across a metropolitan area with investigation of time to detection for both known and novel outbreaks, and an exploration of the co-benefits it provides to individual patients. A microcosting analysis, similar to what was conducted for cancer-based genome sequencing, would provide a more realistic estimation of costs. 46 Finally, future analysis that estimates the effect of Threat Net on the expected annual losses from pandemics (ranging between an annualized loss of $500 billion and $800 billion globally) could aid decisionmakers in justifying spending.
Footnotes
References
Supplementary Material
Please find the following supplemental material available below.
For Open Access articles published under a Creative Commons License, all supplemental material carries the same license as the article it is associated with.
For non-Open Access articles published, all supplemental material carries a non-exclusive license, and permission requests for re-use of supplemental material or any part of supplemental material shall be sent directly to the copyright owner as specified in the copyright notice associated with the article.