




Abstract
In early 2020, to halt the spread of SARS-CoV-2, the state government of Rio Grande do Sul in Brazil established a public health assessment and response framework known as a “controlled distancing model.” Using this framework, the government divided the state into 21 regions and evaluated them against a composite index of disease transmission and health service capacity. Regions were assessed using a color-coded scale of flags that was updated on a weekly basis and used to guide the adoption of nonpharmaceutical interventions. In this study, we aimed to evaluate the extent to which the controlled distancing model accurately assessed transmission and the effectiveness of its responses throughout 2020. We estimated the weekly effective reproduction number (Rt) of SARS-CoV-2 for each region using a renewal equation–based statistical model of notified COVID-19 deaths. Using Rt estimates, we explored whether flag colors assigned by the controlled distancing model either reflected or affected SARS-CoV-2 transmission. Results showed that flag assignments did reflect variations in Rt to a limited extent, but we found no evidence that they affected Rt in the short term. Medium-term effects were apparent in only 4 regions after 8 or more weeks of red flag assignment. Analysis of Google movement metrics showed no evidence that people moved differently under different flags. The dissociation between flag colors and the propagation of SARS-CoV-2 does not call into question the effectiveness of nonpharmaceutical interventions. Our results show, however, that decisions made under the controlled distancing model framework were ineffective both at influencing the movement of people and halting the spread of the virus.
Introduction
B
The COVID-19 pandemic posed a decisionmaking challenge to public health authorities around the world. 4 NPI implementation embodies the 3 core elements of any structured decision: what one wants, what one knows, and what one can do. 5 The range of possible interventions captures what one can do; the rate of pathogen transmission is what ought to be known; and stopping dissemination of a disease is, hopefully, what one wants. From its inception, however, the CDM reflected a perceived dichotomy between protecting lives and protecting livelihoods, 6 which influenced municipal, state, and federal policies in Brazil throughout the pandemic. Thus, the RS state government presented the CDM as a “mixed, modular, mutually agreed strategy for balancing the priority of life with economic recovery.” 7 The framework was based on a color-coded scale of flags (yellow, orange, red, black), which aimed to indicate transmission risk, and were assigned on a weekly basis to each of 21 COVID-19 regions. A region’s flag color was determined by an ad hoc combination of 11 metrics grouped in 2 sets (Supplemental Table S1; Supplemental tables are available at www.liebertpub.com/doi/suppl/10.1089/hs.2023.0191), which carried equal weight on a composite index. 3 One set assessed the pace of disease transmission and the other focused on healthcare service capacity to assist COVID-19 patients. Each color specified a range of NPIs applicable to different segments of human activity with varying levels of restrictiveness, depending on the segment’s putative contribution for spreading the virus and relevance to the state’s economy. The correspondence between flag colors and NPIs 8 was frequently revised throughout the CDM implementation, with municipalities appealing flag assignments that they deemed too harsh and occasionally obtaining less restrictive colors. The CDM was in place until May 15, 2021, when the government replaced it with an even more flexible assessment and response framework (Supplemental Table S2). 9
The COVID-19 pandemic strengthened an already rich body of literature about the effectiveness of NPIs. Early on, Dehning et al 10 showed that a contact ban and closure of nonessential commerce helped Germany control the spread of the virus. Flaxman et al, 11 using data from 11 European countries, demonstrated the effectiveness of lockdowns for reducing Rt. Li et al, 12 with a sample of 131 countries, found that Rt decreased after school closures, workplace closures, and public event bans. These analyses help decisionmakers choose among possible interventions. Frameworks like the CDM, however, require not only knowledge about what interventions work best but also good decisions about timing and extent of intervention. CDM flag assignments convey timing, while the measures associated with each flag convey extent decisions, embodied by NPI choice. The combined result of timing and NPI choice determines the effectiveness of an assessment and response framework.
In our study, we assessed the effectiveness of the RS CDM throughout 2020 focusing on 2 central questions about flag assignment and its relationship with Rt. First, did Rt respond to flag assignments, as it should when interventions produce the desired result? And second, did flag assignment reflect previous changes in Rt, as expected from an adequate assessment of disease transmission? To pursue these questions, we obtained weekly estimates of Rt for each RS COVID-19 region and contrasted estimates with corresponding flag colors. Because subnotification of disease cases was unavoidable, we used a statistical model of Rt informed by the number of notified COVID-19 deaths, an imperfect but more reliable data source than the number of notified cases.11,13,14 This model works backward from the number of deaths to obtain a daily number of infections, which then informs the estimation of Rt. Such an approach is particularly appropriate for assessing effectiveness of any type of intervention because it removes the lag between the effect of interventions on viral transmission, which we want to quantify, and on viral-related deaths, which are at the source of our data. Our longitudinal assessment of the effectiveness of the CDM stops at the end of 2020 because the beginning of 2021 saw the arrival of a new, more transmissible SARS-CoV-2 lineage, and shortly afterward, the termination of the CDM.
Methods
Data
Our study combined epidemiological, demographic, mobility, and assessment and response data collected between March 15 and December 21, 2020, in the 21 RS COVID-19 regions. Daily reported infections and deaths were obtained from the Coronavirus Panel of the Ministry of Health. 15 Projected human population age structure per municipality were provided by the Economics and Statistics Foundation of Rio Grande do Sul 16 and municipality-level mobility metrics were from Google’s COVID-19 Community Mobility Reports. 17 Google provided metrics of change in daily mobility with reference to January 2020 for 6 place categories: residential, transit stations, parks, grocery and pharmacy, retail and recreation, and workplaces. We computed regional-level mobility metrics as arithmetic means of the respective municipality values weighted by each municipality’s population size. Weekly region-specific assessment and response data—represented by the CDM flag colors—were obtained from the government website. 18 From June 20, 2020, until the end of our study period, CDM flags were preliminarily disclosed by the state government and subject to appeals by municipal authorities. Our data for this period considers only the flag colors that were implemented after the appeals. Codes and processed data are available as Supplemental material to this article and in an online repository. 19
Epidemiological Model
The core of our analytical approach is an adaptation of Flaxman et al’s
11
model, which uses a renewal equation to infer the latent daily number of SARS-CoV-2 infections that result in a reported number of COVID-19 deaths. Such inference entails the estimation of the effective reproduction number (Rit or Rt for short) and attack rate (pit or the proportion of the population infected) for every RS COVID-19 region i and day t. The estimation of the true, partially observed number of cases from the observed number of deaths draws on a vector of infection fatality ratios and 3 distributions obtained from the literature. Infection fatality ratios fi were adjusted to the population age structure of each region while considering the frequency of contacts among age classes summarized by a contact matrix estimated by Grijalva et al
20
(see Code 1 in Supplemental Material; all supplemental files are available at www.liebertpub.com/doi/suppl/10.1089/hs.2023.0191). The 3 distributions, which quantify the temporal connection between deaths and cases were: (1) a distribution of time from the onset of symptoms to death obtained by Ranzani et al
21
from Brazilian data, with a mean
CDM Versus Rt
To evaluate the relationship between Rt estimates and CDM flags, we derived quantities of interest from the MCMC samples of the posterior distributions of epidemiological model parameters. Because flags were updated weekly and our model estimated the Rt daily, we first derived weekly Rt estimates as geometric means of daily Rt for every region. To examine whether flag changes associated with simultaneous or subsequent changes in Rt, we compared distributions of Rt ratio (Rt+1/Rt) when flag restrictiveness had been downgraded, unchanged, or upgraded, respectively, on week t and t + 1. Longer lags between flag change and Rt ratio would imply some causal relationship between past flag changes (taking place before time t) and current Rt ratio. Furthermore, such a relationship would not have a memory of those intervening flag changes taking place between the past change and time t + 1. To our knowledge, no mechanism would generate this, so we did not examine longer lags between flag change and Rt ratio in this article. In addition to exploring the relationship between flag change and Rt change, we explored the relationship between flag color in week t and subsequent Rt change, as shown by posterior distributions of Rt+1/Rt ratio corresponding to each color. Because red was the most frequently applied of the 2 most restrictive flags (red and black), we also plotted the relationship between the duration of uninterrupted red flag periods and the end/beginning ratio of Rt values over such periods (see Code 2 in Supplemental Material).
To examine whether increases in Rt were associated with subsequent upgrades in flag restrictiveness, we fit logistic models of flag upgrade probability as a function of Rt ratio, using lags of 1 to 7 weeks between the ratio numerator and flag assignment. For each lag, we obtained a distribution of 4,000 logistic slope parameters, each coming from 1 MCMC sample. It make sense to examine lagged associations here, because it may take several weeks for the CDM metrics to register the public health consequences of a change in viral transmission. Following a reviewer’s suggestion, we replicated all analyses that explored relationships between Rt+1/Rt ratio and CDM flag color (including flag change), in both directions. To achieve this, we replaced ratios with the Rt value found in the ratio’s denominator. Finally, to analyze the relationship between CDM flags and Google mobility metrics, we built a mixed effects model 27 that accounts for region and temporal effects on mobility, described in Code 3 in Supplemental Material.
Ethical Statement
This research was submitted to Plataforma Brasil and approved by the Ethics Committee 5337 – Santa Casa da Misericórdia de Pelotas under the Certificate of Presentation of Ethical Appreciation 34335920.1.0000.5337 on October 9, 2020. This research was conducted without access to any individual information.
Results
Rio Grande do Sul had 8,162 notified deaths due to COVID-19 and 409,794 notified cases of SARS-CoV-2 infection during the study period. Estimated attack rates ranged from 3.3% in Cachoeira do Sul to approximately 20% in Novo Hamburgo (Table). Like Novo Hamburgo, the second, third, fourth, and fifth COVID-19 regions with the highest attack rates are in the Porto Alegre metropolitan area. More than half the regions had estimated attack rates above 10%.
Total Notified Deaths and Selected Parameter Estimates by COVID-19 Region, March 15 to December 21, 2020
Note: Estimated deaths, infections, and attack rates are shown by their posterior distribution mean plus or minus 1 standard deviation (±σ).
Regions belonging to the Porto Alegre metropolitan area.
Transmission of SARS-CoV-2 varied in time, with an earlier increase of daily infections in those regions with the highest attack rates (Supplemental Figure S1A). As expected from the structure of our model, the estimated number of deaths per day closely matches the number of notified deaths (Supplemental Figure S1B), but there was substantial underreporting of SARS-CoV-2 infections, shown by the gap between estimated (blue line) and reported (brown bars) cases in Figure 1A and Supplemental Figure S1A. The effective reproduction number (Rt; Supplemental Figure S1C) also varied in time and among regions. The longest time that any region sustained values of Rt lower than 1 was 9 weeks in Passo Fundo and Pelotas (Figure 1). In Capão da Canoa, Guaíba, and Lajeado, Rt stayed below 1 throughout 8 consecutive weeks. These 5 periods of low Rt happened between early August and mid-October, after the first peak of notified COVID-19 deaths in RS.
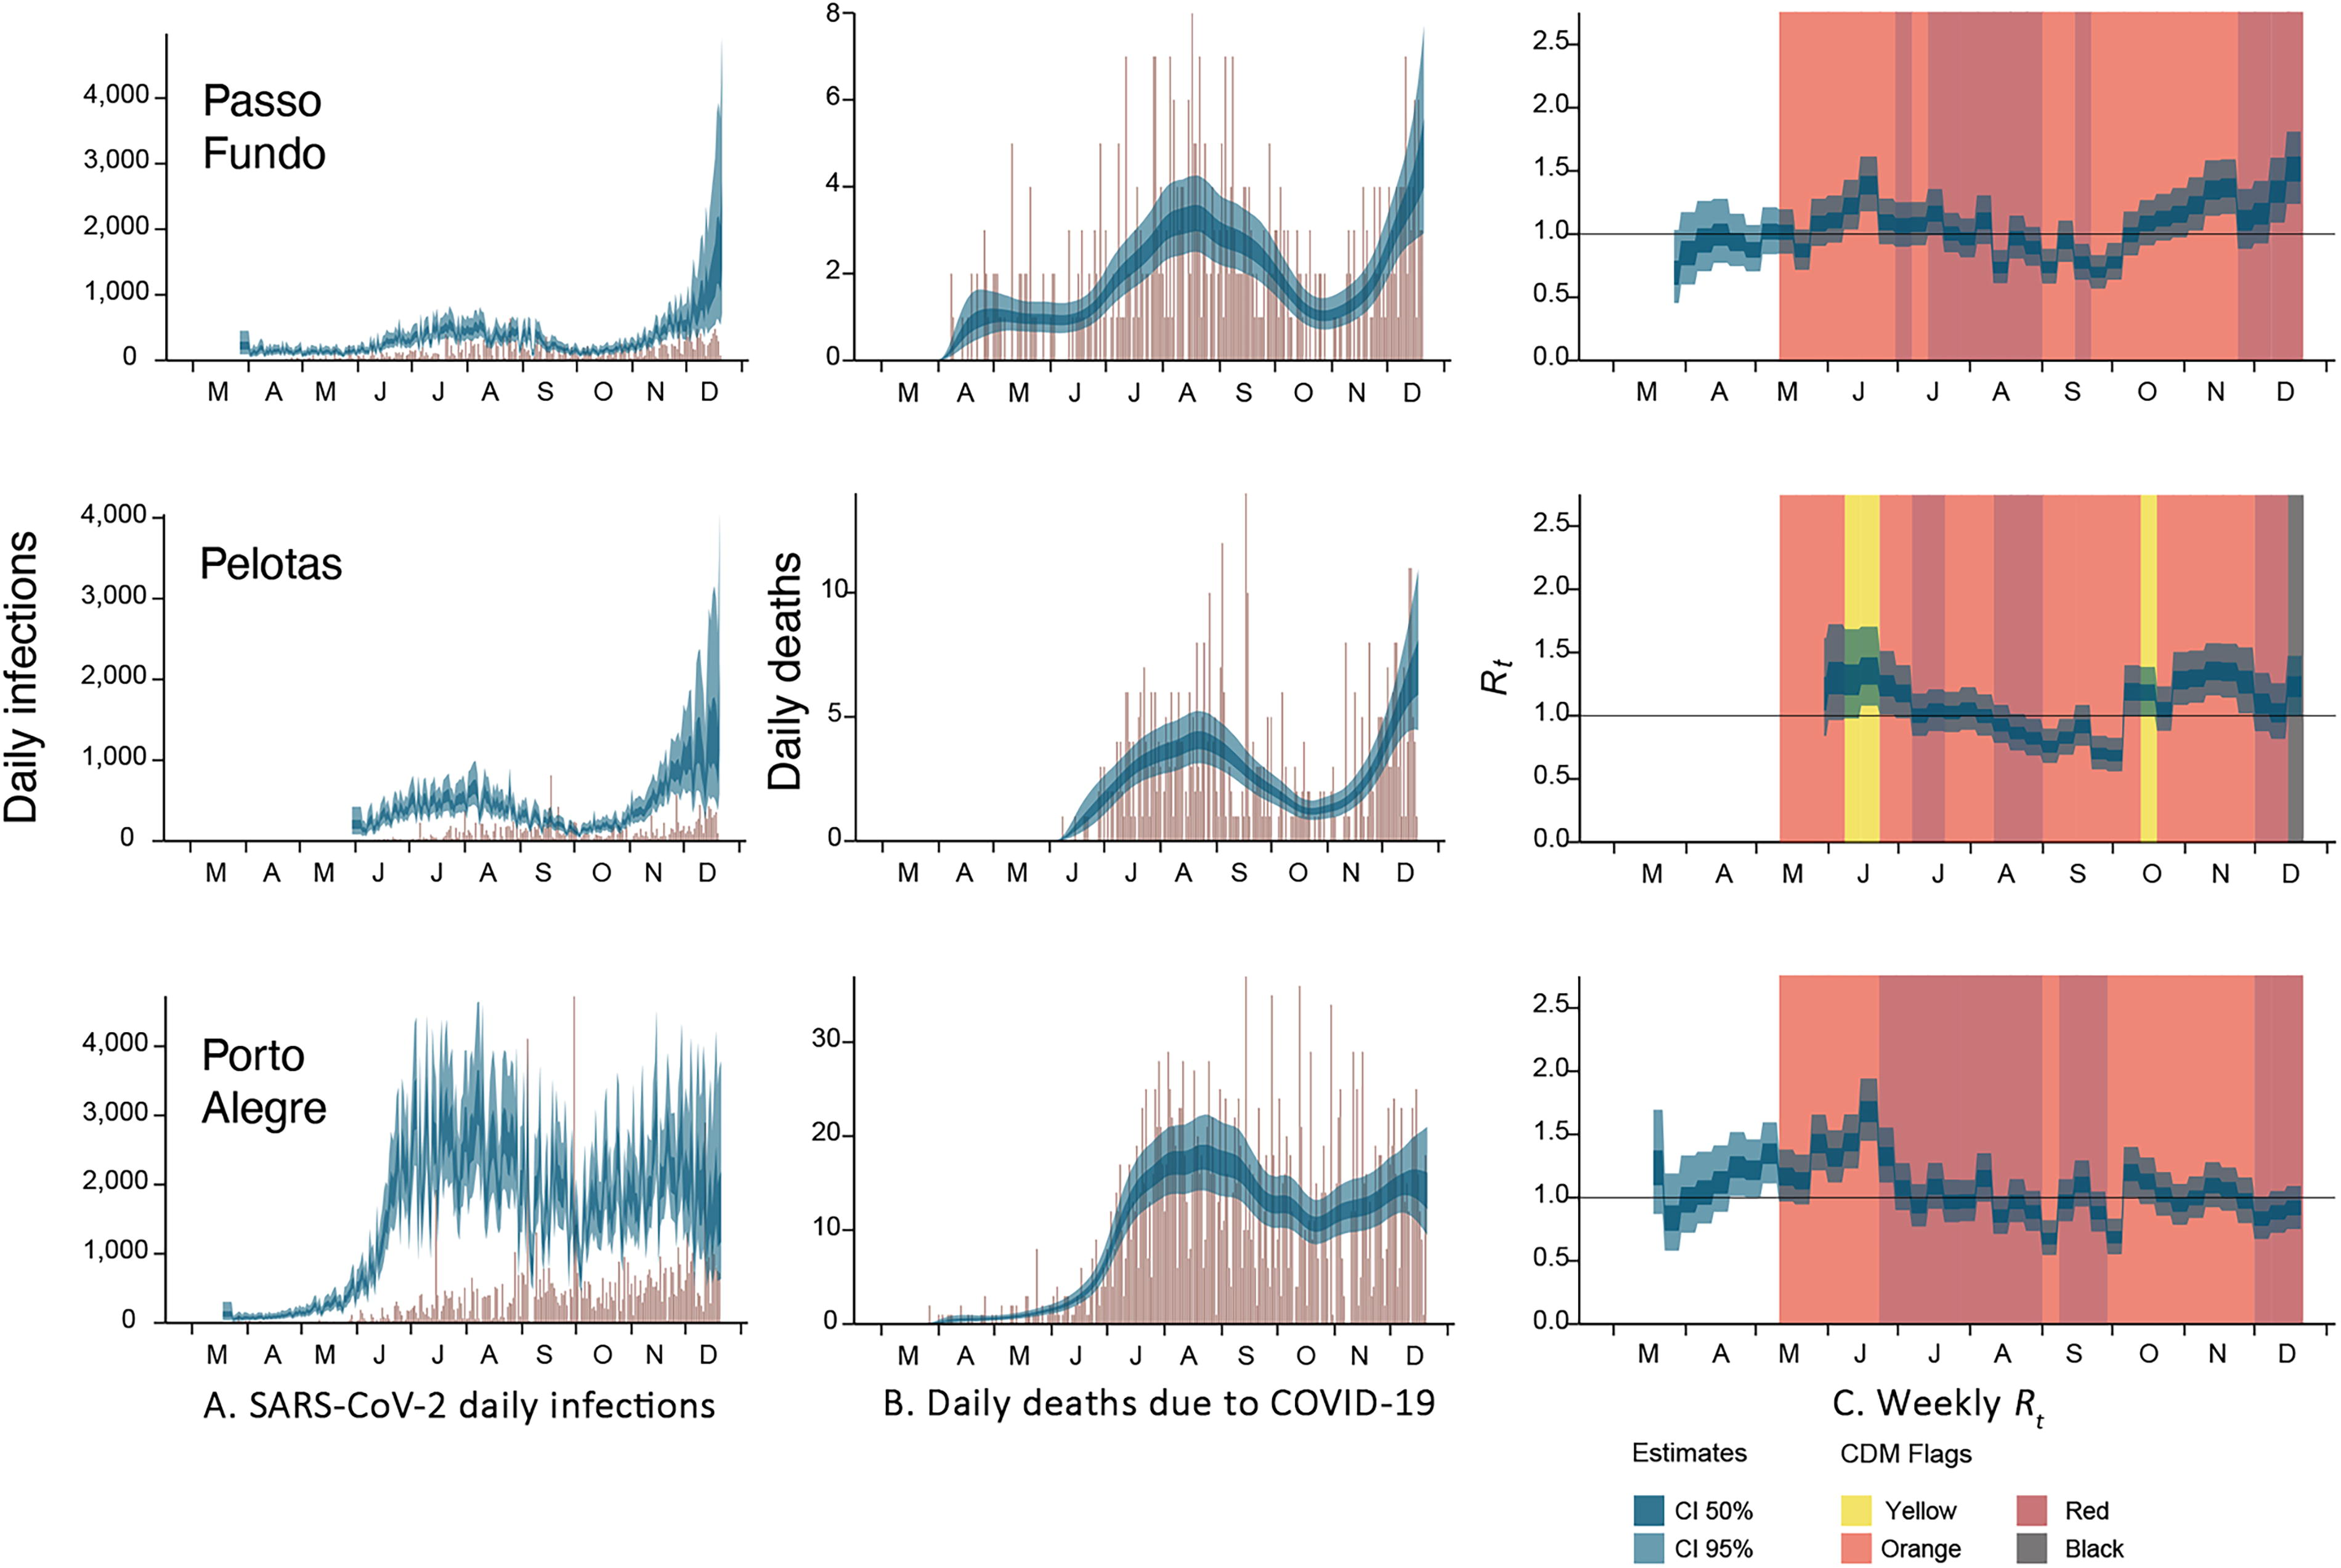
Temporal trajectories of (A) SARS-CoV-2 daily infections, (B) daily deaths due to COVID-19 and (C) weekly Rt for the COVID-19 regions of Passo Fundo, Pelotas, and Porto Alegre during the study period. Panels A and B show notified numbers in brown and estimated numbers in blue (with light blue showing 95% and dark blue 50% credible intervals around the posterior mean). Likewise, the Rt values in panel C show 95% and 50% credible intervals, in light and dark blue, respectively. Vertical colored rectangles show the period of application for each controlled-distancing model flag color. Weekly Rt values are a geometric mean of the daily estimates for the corresponding week. Supplemental Figure S1 shows equivalent plots for all 21 COVID-19 regions of Rio Grande do Sul.
Did Rt Change According to Flag Color?
We found no evidence that changes in CDM flag color had any influence on temporal variation of Rt. The posterior distribution of Rt+1/Rt when flags were upgraded to a more restrictive color in week t + 1 was qualitatively the same as when flags were downgraded or unchanged (Figure 2A). The same held true with a 1-week lag between flag and Rt transitions (ie, considering flag assignments for week t).
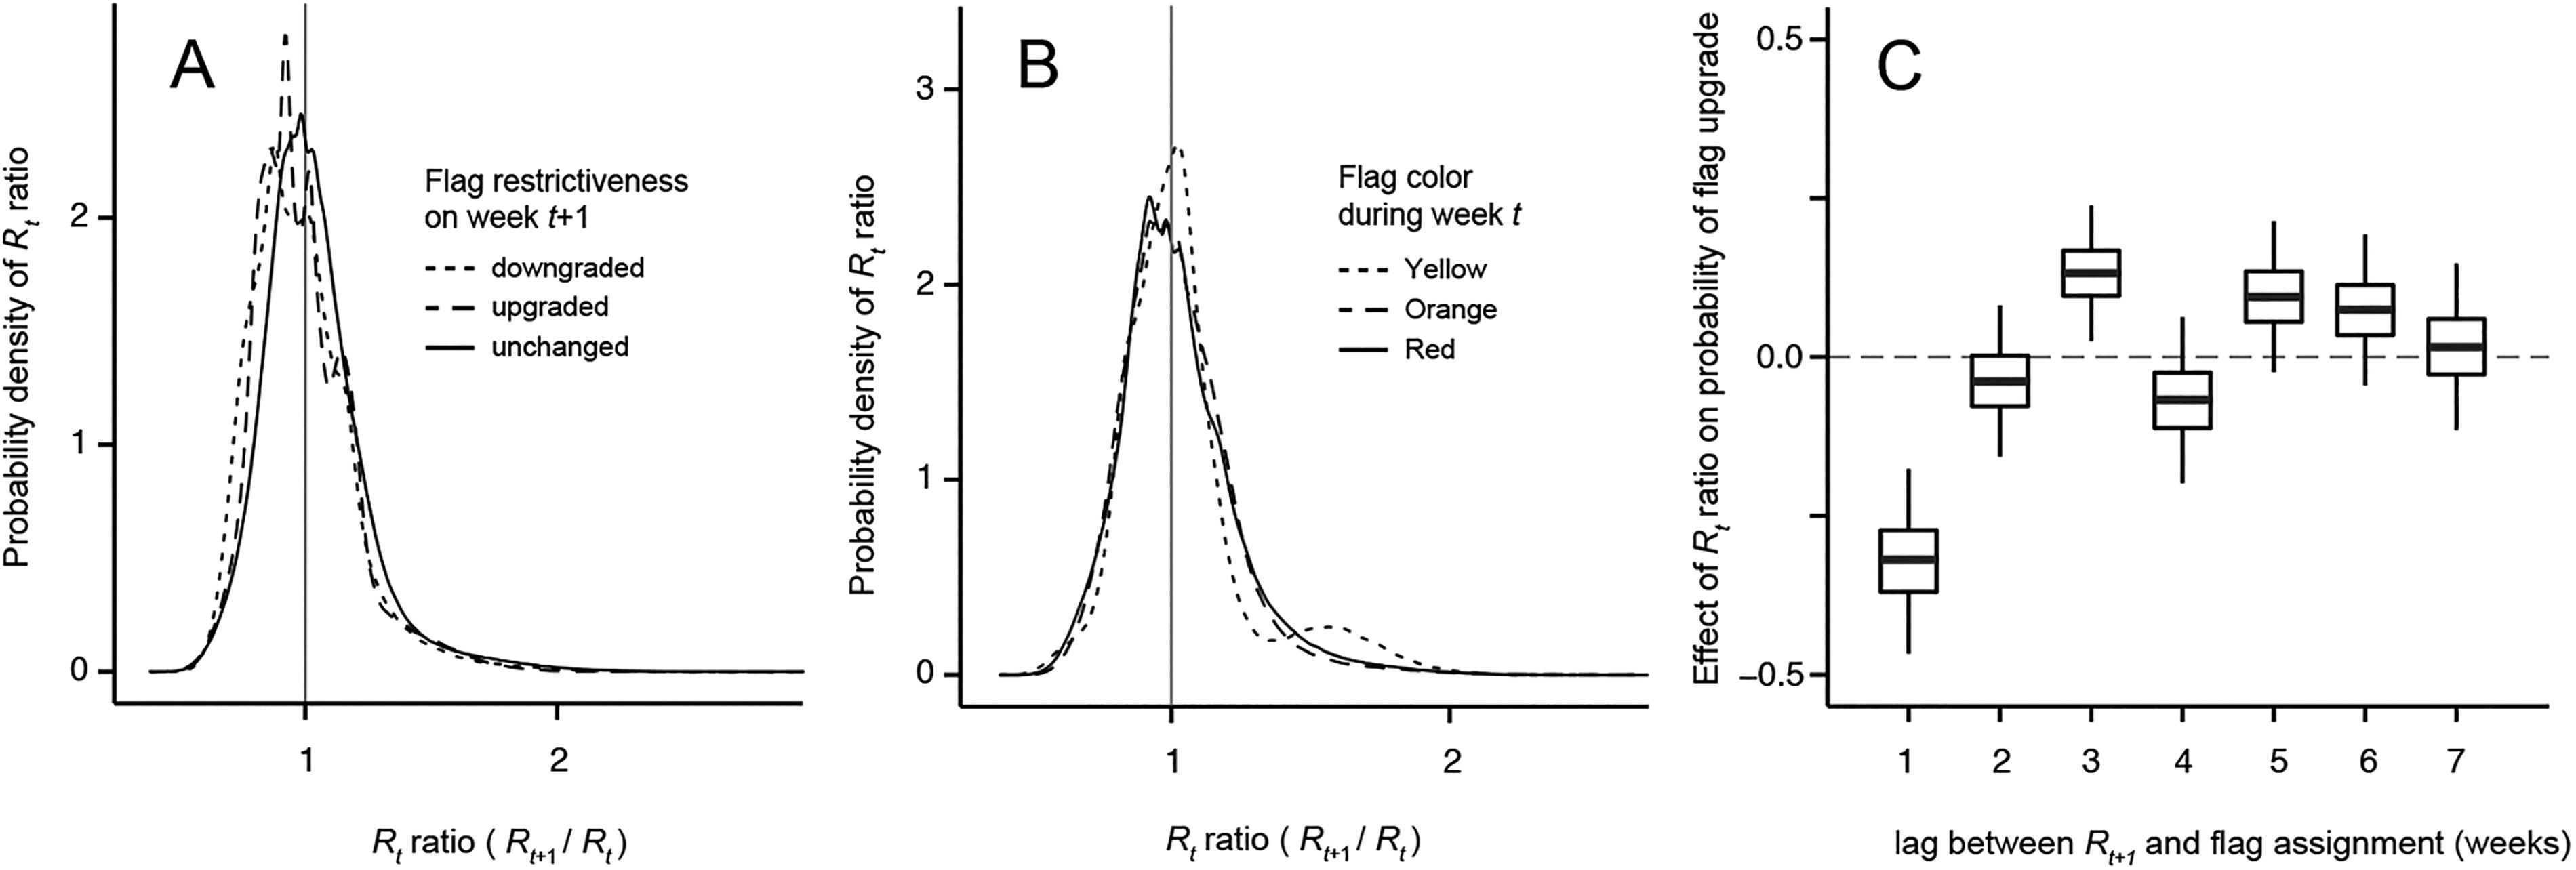
Relationship between Rt and controlled-distancing model flag color, or lack thereof. (A) Probability distribution of Rt ratio (measuring change from week t to t + 1) is the same when flags are upgraded, downgraded, or stay the same in week t + 1. (B) Likewise, the probability distribution of Rt ratio does not change with flag color on week t. (C) Finally, the probability of a flag upgrade increases with Rt ratio 3 weeks (but not 1 or 2 weeks) after t + 1.
Our data comprise 602 region-specific transitions between subsequent weeks, each with a corresponding flag color in the final week. The ranking from most to least frequently assigned color was orange, red, yellow, and black (Supplemental Table S3). Black flags were assigned only twice in 2 different regions, for 1 week each, with Rt increasing during the corresponding period in both cases. Figure 2B shows how the posterior distributions of Rt ratio derived for periods with yellow, orange, and red flag on week t are statistically indistinguishable from each other. Both the relationship between Rt and flag change and the relationship between Rt and flag color remained qualitatively the same (ie, did not show evidence of a relationship when we changed Rt ratios by Rt values) (Supplemental Figures S2A and S2B).
Because red flag periods provide the best basis for investigating effects of the most restrictive CDM interventions, we also explored the relationship between red flag period duration (in weeks) and the corresponding change in Rt (Figure 3). Only 4 out of 8 periods of more than 5 weeks coincided with a substantial decrease in Rt. Of these, the 3 longest, with 10 weeks each, in Canoas, Porto Alegre, and Novo Hamburgo, were the most substantial. Of the 30 red flag periods lasting between 3 and 7 weeks, 24 showed either no evidence of alteration or an increase in Rt.

Relationship between the duration of continuous red flag periods and change in Rt from the beginning to the end of the period, for all COVID-19 regions. Circle sizes indicate period duration in weeks and their position gives the posterior mean of the Rt distributions identified by each of the axes. Circle colors indicate the proportion of the final Rt a posteriori distribution that is above (for Rt increases) or below (decreases) the diagonal line. Lighter colors indicate stronger evidence of Rt change. Letters a, b, c, and d identify 4 periods with the strongest reductions in Rt, from, the COVID-19 regions of Canoas, Porto Alegre, Novo Hamburgo, and Taquara, respectively.
Did Flag Colors Reflect Change in Rt?
The logistic regression slope parameter for the effect of Rt ratio on the probability of flag upgrade was negative with a 1-week lag and positive with a 3-week lag (Figure 2C). There was weaker evidence of a negative relationship at the 1-week lag when we replaced Rt ratios by Rt values, but evidence for the positive relationship at the 3-week lag remained strong (Supplemental Figure S2C).
Did Human Mobility Change According to Flag Color?
We found no evidence of a relationship between flag color and human mobility. Figure 4 shows a reduction in human mobility around the place categories of retail and recreation (Figure 4A), parks (Figure 4C), and transit stations (Figure 4D), compared with the reference period of January 3 to February 6, 2020. Concurrently, people spent more time in residential areas (Figure 4F). The changes in mobility illustrated by Figure 4, however, show no relationship with flag color. This lack of relationship is supported by the linear mixed effects model estimates of the effects of flag color on mobility (in all 6 place categories). The posterior distribution of these effects centers on zero and is statistically indistinguishable among place categories (Supplemental Figure S3).
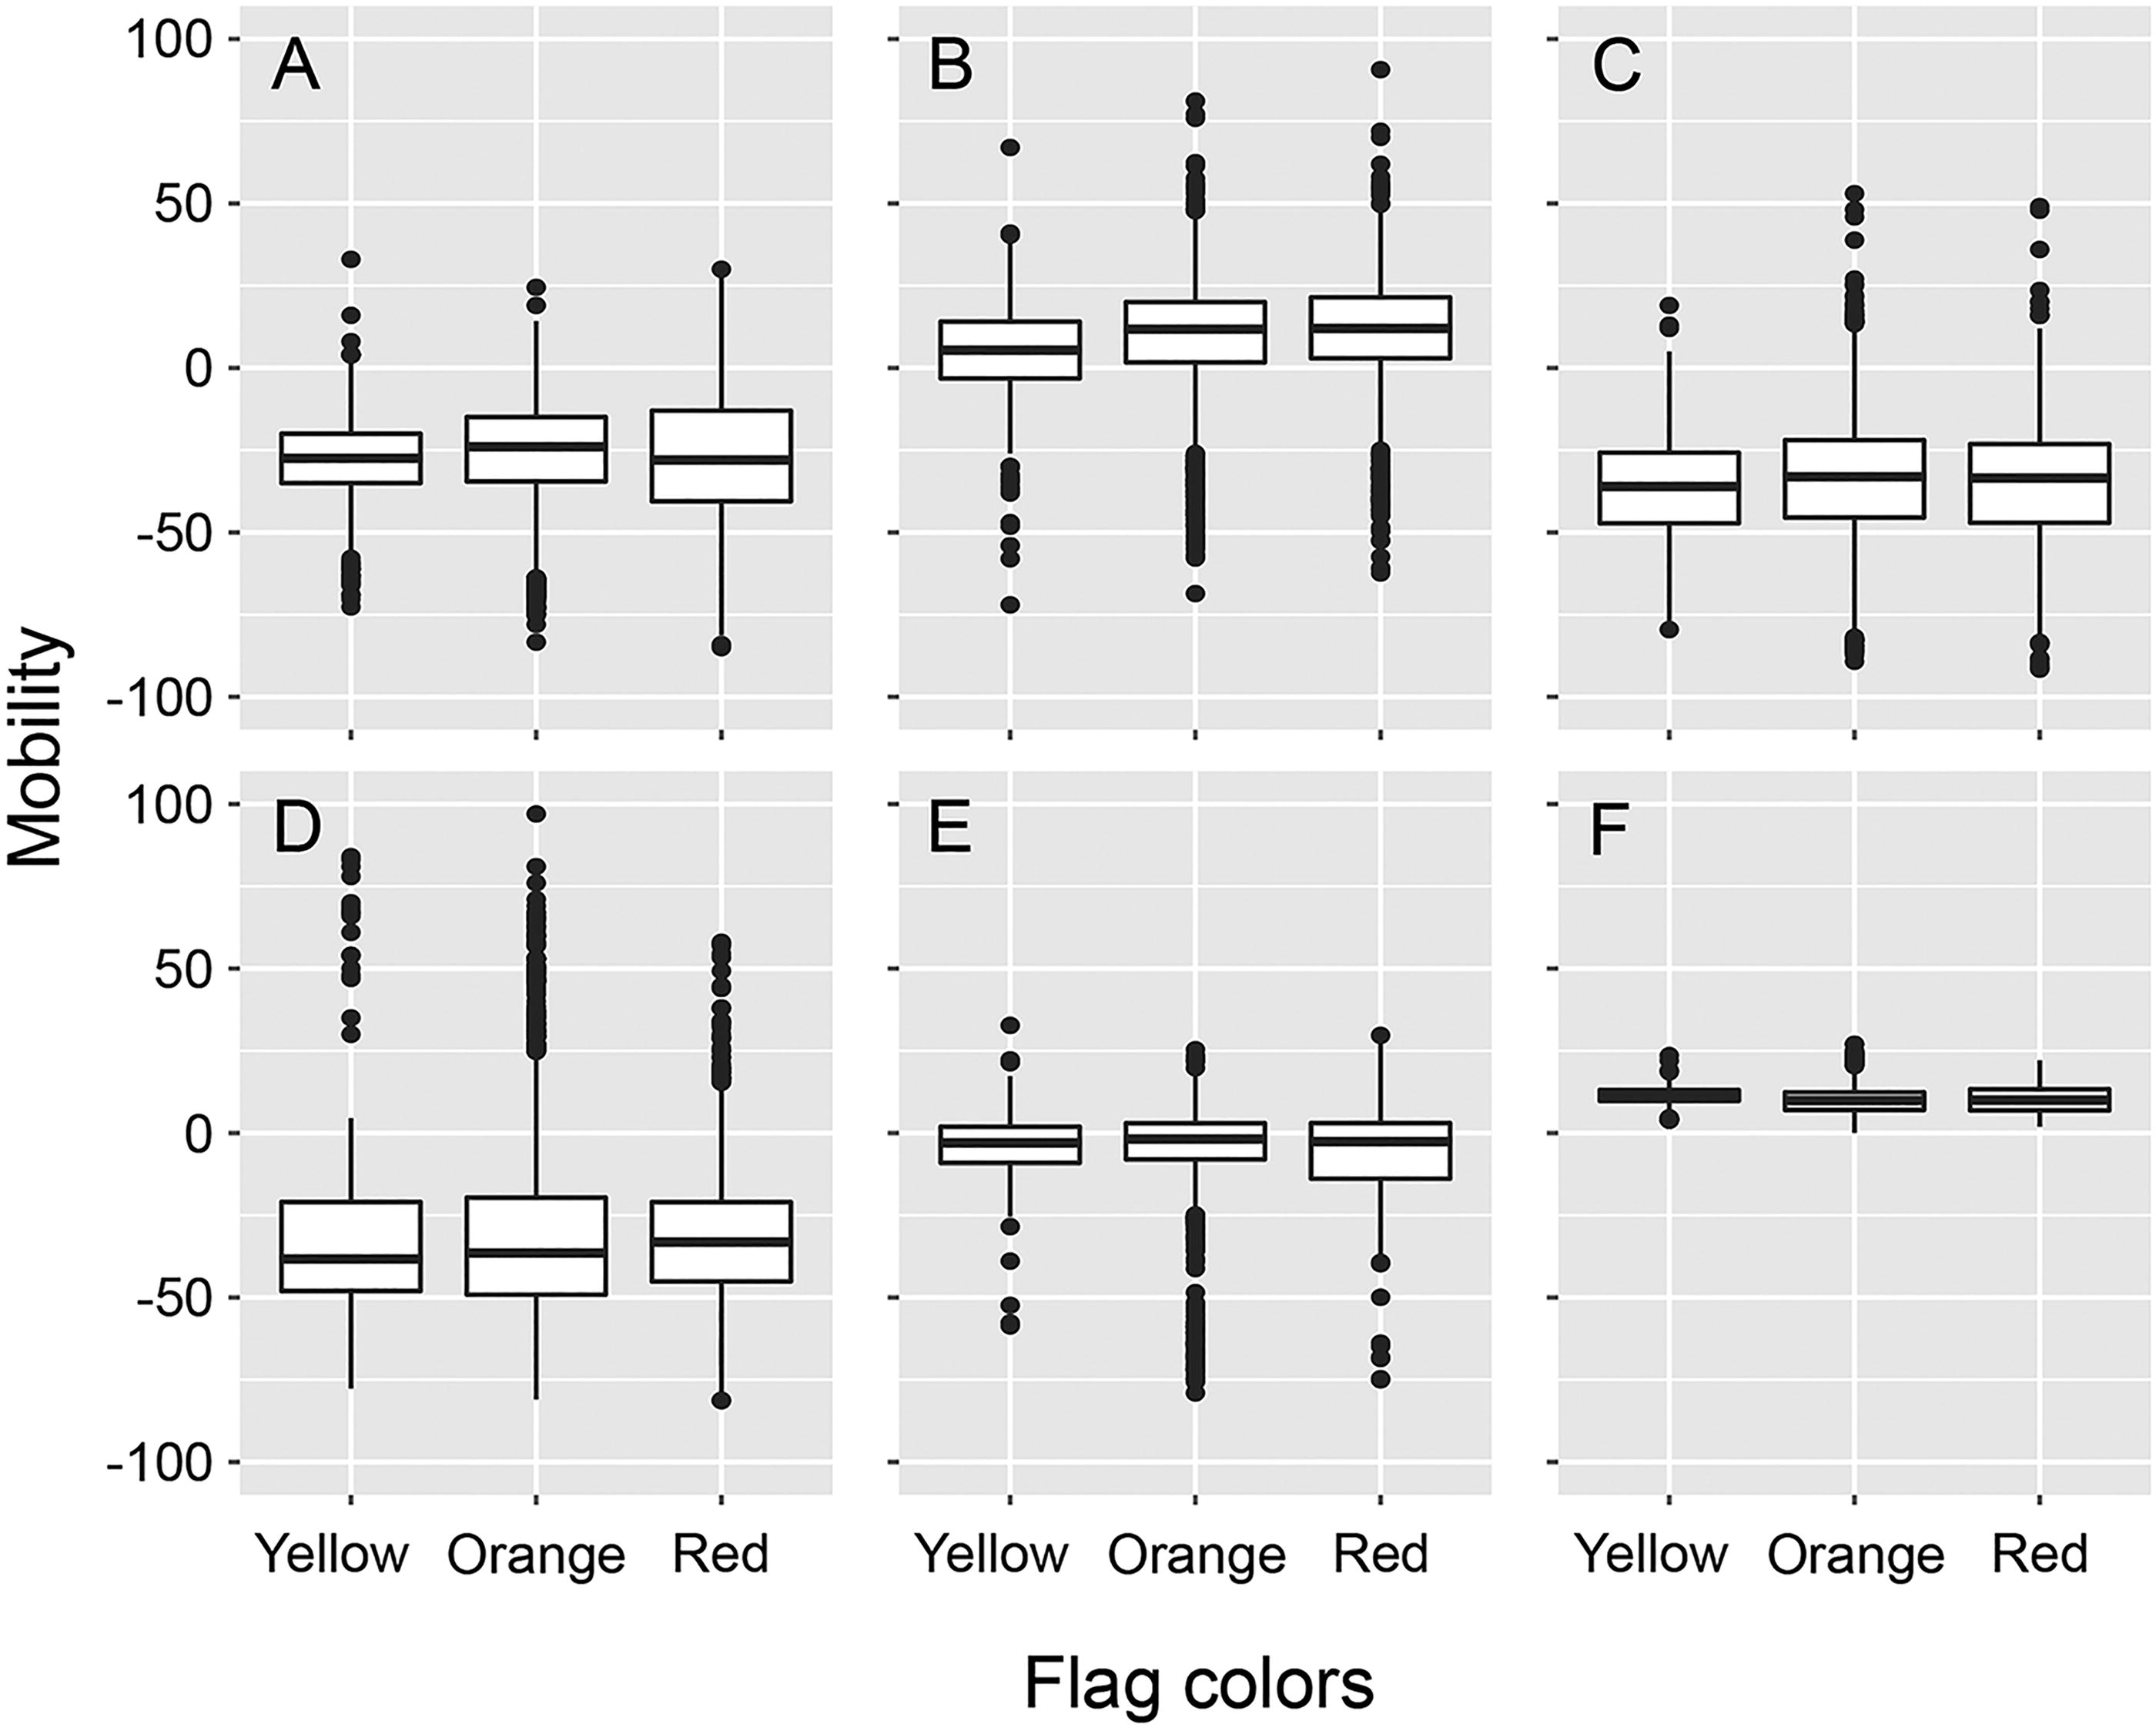
Boxplots of the 6 Google metrics of human mobility in the place categories of (A) retail and recreation, (B) grocery and pharmacy, (C) parks, (D) transit stations, (E) workplaces, and (F) residential areas. Each plot shows the distribution of daily metrics per COVID-19 region across the 3 controlled-distancing model flag colors that were most used throughout the study period. Metrics express proportional change from the reference period of January 3 to February 6, 2020. The metric of movement in residential areas quantifies proportional change in the average time that individuals spend at their residence; all the other metrics quantify proportional change in the number of visitors to a given place category.
Discussion
We found limited evidence that Rt responded to flag assignments and some evidence that flag assignments reflected changes in Rt, albeit with a 3-week delay. The posterior distribution of Rt ratios were the same when flags were downgraded, unchanged, or upgraded, both for the week of flag assignment and for the subsequent week. Likewise, Rt ratios were equally distributed during the week of assignment and the week after assignment for yellow, orange, and red flags. The only suggestion of Rt responsiveness to the CDM flags came from 4 extended periods of continuous (8 to 10 weeks) red flag assignments in the Porto Alegre metropolitan area toward the middle of 2020. As for the effects of Rt on flag assignments, the probability of flag upgrade increased with increased values of Rt ratio, but only 3 weeks after the corresponding change in effective reproduction number. This lag broadly matches the sum of the periods from infection to onset of symptoms (approximately 5.1 days) and from onset of symptoms to death (approximately 15.4 days) reported in the literature.21-23 Without contact tracing nor testing of people without symptoms, the CDM was only able to assess increases in transmission when people sought help from the health services or died, which would explain the 3-week delay in flag assignment response. The fact that peak Rt values must be followed by low Rt ratios helps explain the negative relationship between ratio and flag upgrade observed at the shortest time lag. Flags were upgraded when the health system was being strained and Rt was already on a downslope.
Like any inference based on statistical modeling, our estimates of Rt rely on assumptions that must be pondered. Because we modeled daily numbers of infection based on deaths data, the infection fatality ratio (IFR) is an important element of our study. Sensitivity analyses revealed that the IFR does influence the number of infections estimated by a model like ours, 14 but it is robust to changes in the contact matrix. 13 We derived 1 value of IFR for each COVID-19 region while assuming region-specific age structures and a shared contact matrix. The resulting values were within the range of published IFR estimates for RS. 28 Likewise, the assumed distributions of incubation period, time between onset of symptoms and death, and serial interval have been corroborated in the literature. 29 Perhaps the riskiest assumption of our analysis is to hold R0 constant (within region) throughout the study period. The P.1 SARS-CoV-2 lineage that emerged in Manaus in mid-November 2020 was more transmissible than previously circulating lineages. 30 With Rt estimated as a function of R0 and human mobility metrics, an R0 bias could conceal a relationship between Rt and flag colors—that is, if P.1 became sufficiently prevalent before the end of 2020. Lineage P.1 did account for more than 85% of sequences sampled at the largest RS hospital in February 2021, 31 but as of November 2024, it was found in only 3 of 337 RS sequences collected in the last 2 months of 2020 and submitted to the GISAID repository. 32 We nonetheless refitted our model to data collected until October 26, before the earliest possible date of P.1 emergence in RS. The results, summarized in Supplemental Figure S4, were qualitatively similar to those reported in Figure 2.
Looking first at the assessment component of the CDM, our study examined the extent to which flag colors reflected Rt. The 3-week lag between Rt increase and associated flag upgrade suggests the CDM detected relevant changes in transmission but did so too late for a timely response. In fact, the strongest evidence for a relationship between Rt ratio and probability of flag upgrade is a negative relationship at the 1-week lag. That is, delayed assessment of an increase from 3 weeks prior often masked the evidence of recent reduction in Rt. How can one shorten the lag between changes in transmission and their detection? Certainly not with an approach reliant on deaths data, appropriate for a retrospective study. The challenges of estimating Rt in real time33,34 are such that some authors consider replacing it with epidemic growth rates,35-37 but renewal equation models, like ours, can also be fit to case data. 38 Such models do shorten the lag between assessment and transmission, but their usefulness depends on data quality. Ideally, models for estimating Rt (or epidemic growth rate, for that matter) should integrate real-time data from different sources, including different types of testing and environmental monitoring, as in Mishra et al's 39 variant prevalence study.
To evaluate the response component of the CDM, we examined whether Rt reflected prior flag colors. Apart from the 4 long periods of red flag assignment that saw Rt decreasing to values below 1 in Porto Alegre, Novo Hamburgo, Canoas, and Taquara (Figure 3), we found no relationship between the CDM flag system and the pace of disease transmission. Our findings showed that (1) Rt ratio distributions were similar regardless of whether flags were upgraded, downgraded, or unchanged in weeks t + 1 or t; (2) Rt ratio distributions were similar regardless of flag color on week t; and (3) duration of red flag periods (apart from the 4 cited exceptions) bore no relationship with the magnitude or direction of Rt change, thus suggesting that flag colors did not affect disease spread, neither in the short nor medium term. This must not be interpreted as evidence that NPIs do not affect transmission. Indeed, visual examination (Figure 4) and a linear mixed effects model (Supplemental Figure S3) of the relationship between flag colors and human mobility strengthen the notion that people generally ignored the flags. The real changes that took place in human mobility with regard to the reference period of January 20202,40 happened regardless of the CDM. From the response point of view, the framework was insufficient to stem the transmission of SARS-CoV-2 because it failed to impress human behavior. That is, the intended NPIs did not materialize.
Improvement of a CDM-like assessment and response framework must include an evaluation of how transmission risk levels were assessed. A vital element of the assessment process was the procedure by which the state arrived at flag colors. These were given by a composite index 3 of metrics taken at different spatial scales and aiming at different stages of the disease. The index did not include a statistical estimate of the rate of SARS-CoV-2 dissemination and conflated (indirect) assessment of transmission risk with assessment of healthcare service capacity. An improved framework ought to avoid combining observations from different spatial scales (eg, state, microregion, region) in the assessment at a single scale (eg, region). Such combinations can mask local surges in transmission with temporary improvements at a broader scale. Likewise, melding numbers about disease stages that develop over a period of several weeks (eg, new confirmed COVID-19 cases, patients in clinical beds, patients in intensive care units, COVID-19-attributed deaths) can mask important changes taking place during the single week that the index aims to characterize.
The dilemma of deciding which metrics to include in a compound index could be overcome with a focus on the statistical estimation of Rt or similar epidemiological assessment of pathogen dissemination. This would require facing the challenges of real-time assessment as identified earlier in this section and should involve asymptomatic testing as well as environmental monitoring of pathogen circulation. The most urgent improvement of the framework, however, would be to exclude healthcare service capacity from the assessment of transmission risk. Keeping service capacity metrics in the assessment figuratively amounts to quantifying water shortage based on the size of a container. Throughout 2020, there was a sustained increase in the number of clinical and intensive care unit beds in RS. According to the CDM, this should have led (and indeed did lead) to a relaxation of social distancing even as disease transmission remained unchanged. Without a vaccine and with attack rates far below herd immunity, such a strategy invites Rt values that quickly exhaust the capacity of even the most capable healthcare system.
The absence of a relationship between flag colors and human mobility illustrates the vulnerability of the framework’s response component to communication and implementation decisions. The NPIs associated with each color were presented as a compromise among suggestions by different entities; rather than being a straightforward set of instructions, they included 50 protocols grouped in 12 activity sectors. 8 At the individual level, adherence to these protocols was largely voluntary; for example, fines for individuals not wearing masks in public spaces were only regulated in March 2021. 41 The state government had more power to control the behavior of institutions (eg, by setting business operation hours), but the enforcement of such controls fell to local authorities who often disagreed with them. In August 2020, a state government decree 42 attempted to harmonize disagreements by establishing conditions under which municipalities could replace NPIs required by the state. This comanagement of sanitary protocols did not preclude frequent revisions of CDM rules, including the NPIs corresponding to each flag color. In 2020 alone, the state issued at least 26 legal decrees altering the original formulation of the CDM. 43 Revisions, replacements, and appeals inevitably weakened the authority of the state in the face of local business demands. Flag colors were well advertised on state government websites and by the media, but the perceived inconsistency of their meaning eroded the credibility of the CDM, likely explaining the disconnect between flag colors and human mobility. An improved framework should have simpler and more consistent response rules.
The long red flag periods in Canoas, Porto Alegre, and Novo Hamburgo lasted from June 23 to August 31, 2020. Their ending illustrates the importance of consistency, not only in the meaning of the flags but also their application. Between July 15 and August 31, 2020, the government enforced a mandate to apply black and red flags for at least 2 weeks once they had been assigned to a region. This mandate was withdrawn during the first week of September, when all 3 regions had Rt estimates with 95% credible intervals below 1. During the same week, all 3 regions reverted to an orange flag, occasionally returning to red but never for more than 3 weeks in a row. By mid-October, they all had estimates of Rt>1. Assessment and response frameworks can be powerful tools for responding to temporal change in healthcare systems, 44 but given the challenges of estimating Rt in near real time, especially during resurgence periods, 34 we concur with the notion that assessment is more useful for deciding when to stop, rather than when to start, implementation of NPIs. An improved CDM-type framework should treat the protection of lives as inseparable from the protection of livelihoods 45 and seek societal coordination to prevent uncontrolled growth of an epidemic, with NPIs implemented before dangerously high transmission is detected. This would amount to upgrading flag colors, or any indicator of risk status, preemptively. If preemptive measures fail, transmission levels should be assessed to determine when to interrupt NPI implementation. Beyond supporting the 2-week mandate that was lifted in September 2020, in practice this would involve assessing transmission on a weekly basis but responding with flag changes less frequently, for example, monthly. Under such a framework, flag downgrading should take place only when Rt, informed by asymptomatic testing and environmental monitoring, remains below 1 for a sufficient and consistently set time.
Conclusion
The controlled distancing model of Rio Grande do Sul correctly assessed changes in SARS-CoV-2 transmission with a 3-week delay, but its responses—represented by a flag color scale—had little to no effect on subsequent viral transmission. Dissociation between flag colors and transmission does not support the claim that nonpharmaceutical interventions are ineffective because flag colors also lacked an association with human movement metrics. Our results emphasize the importance of assessing pathogen transmission in near real time in order to produce timely responses. To be effective responses must be simple, consistent, and kept in place for sufficiently long periods.
Footnotes
Acknowledgments
We thank Thomas Mellan and the Imperial College COVID-19 Response Team for sharing code and providing feedback throughout the process of adapting and fitting the epidemiological model that is at the core of this article. Fernando Abad-Franch and Glauco Machado offered insightful comments on earlier versions of the manuscript. This study was funded by an MSc grant (#88887.502993/2020-00) from the Brazilian Coordination for the Improvement of Higher Education Personnel (CAPES); as well as by PhD (#400559/2023-4), productivity (#312519/2021-4), and research (#403651/2022-0) grants from the Brazilian National Council for Scientific and Technological Development (CNPq).
References
Supplementary Material
Please find the following supplemental material available below.
For Open Access articles published under a Creative Commons License, all supplemental material carries the same license as the article it is associated with.
For non-Open Access articles published, all supplemental material carries a non-exclusive license, and permission requests for re-use of supplemental material or any part of supplemental material shall be sent directly to the copyright owner as specified in the copyright notice associated with the article.
