
Abstract
Hematotoxicity is a major and frequently dose-limiting side effect of chemotherapy. Retroviral methylguanine-DNA-methyltransferase (MGMT; EC 2.1.1.63) gene transfer to primitive hematopoietic progenitor cells (CD34+ cells) might allow the application of high-dose alkylator chemotherapy with almost mild to absent myelosuppression. Because gammaretroviral vector integration was found in association with malignant or increased proliferation, novel lentiviral vectors with self-inactivating (SIN) capacity might display a safer option for future gene transfer studies. We assessed the influence of chemoselection on integration patterns in 1,3-bis(2-chloroethyl)-1-nitrosourea (BCNU)-treated and untreated human CD34+ cells transduced with an SIN lentiviral vector carrying the MGMTP140K transgene, using ligation-mediated PCR (LM-PCR) and next-generation sequencing. In addition, for the first time, the local influence of the lentiviral provirus on the expression of hit and flanking genes in human CD34+ cells was analyzed at a clonal level. For each colony, the integration site was detected (LM-PCR) and analyzed (QuickMap), and the expression of hit and flanking genes was measured (quantitative RT-PCR). Analyses of both treated and untreated CD34+ cells revealed preferential integration into genes. Integration patterns in BCNU-treated cells showed mild, but not significant, differences compared with those found in untreated CD34+ cells. Most importantly, when analyzing the local influence of the provirus, we saw no significant deregulation of the integration-flanking genes. These findings demonstrate that SIN vector-mediated gene transfer might display a feasible and possibly safe option for MGMTP140K-mediated chemoprotection of CD34+ cells.
Introduction
For sustained protection of HSCs and their progeny, stable integration and constitutive expression of MGMTP140K is a prerequisite. To achieve this, gammaretroviral vectors based on the murine leukemia virus (MLV) were used, which is documented by reports on successful correction of several hereditary diseases (Aiuti et al., 2002; Hacein-Bey-Abina et al., 2002; Boztug et al., 2006; Ott et al., 2006). However, these vectors expose rather unfavorable integration properties, including a strong preference for integrating near transcription start sites (TSS) (Wu et al., 2003), which may result in clonal imbalance or leukemia via deregulation of flanking genes (Li et al., 2002; Ott et al., 2006; Seggewiss et al., 2006; Hacein-Bey-Abina et al., 2008; Howe et al., 2008). The appearance of these vector-related side effects has raised general concerns about the genotoxicity of long terminal repeat (LTR)-driven constructs and initiated the use of MLV- and HIV-based vectors with internal promoter activity (Schambach and Baum, 2008). Intense in vitro (Modlich et al., 2006) and in vivo (Modlich et al., 2008; Montini et al., 2009) assays have found lentiviral vectors with self-inactivating (SIN) properties to be constructs with the lowest genotoxic potential.
Nevertheless, although these vectors are derived from HIV, which, in a variety of studies, also exhibited characteristic integration patterns, including accumulation in actively transcribed genes (Schroder et al., 2002; Wu et al., 2003; Mitchell et al., 2004), they are suitable candidates for future studies on resistance gene transfer to HSCs (Schambach and Baum, 2008). In this context, it is not only of interest to generally assess integration preferences of SIN lentiviral vectors for resistance gene transfer into HSCs, but it is also important to examine the influence of chemoselection on the detected integration pattern. To address this, we combined highly sensitive ligation-mediated PCR (LM-PCR) and next-generation sequencing to identify integration patterns of an SIN lentiviral vector carrying MGMTP140K in human CD34+ cells in the absence and presence of BCNU. Because vector-induced gene deregulation was described for MLV-based (Recchia et al., 2006; Maruggi et al., 2009) and HIV-based (Hargrove et al., 2008; Maruggi et al., 2009) gene therapy vectors, we additionally evaluated the influence of the integrated provirus on neighboring genes and measured their expression in BCNU-selected colony-forming cells (CFCs).
Materials and Methods
Lentiviral vector
Lentiviral vector production was performed as described (Maier et al., 2008). In brief, 293T cells were transfected with pHR′SIN-MGMTP140K and the two packaging plasmids pCMVΔR8.91 and pMDG. This lentiviral vector is based on the pHR′SINcPPT-SEW vector (Demaison et al., 2002), containing the P140K mutant of MGMT as a transgene under the control of the spleen focus-forming virus (SFFV) promoter (Maier et al., 2010). After 24 hr medium was replaced with Dulbecco's modified Eagle's medium (DMEM) supplemented with 10% fetal calf serum (FCS) and 10 mM sodium butyrate (Sigma-Aldrich, Deisenhofen, Germany). Supernatant was then purified by passage through a 0.45-μm pore size filter (Millipore, Schwalbach, Germany) and subsequently concentrated with a 100,000 molecular weight cutoff Vivaspin filter (Sartorius, Goettingen, Germany), and aliquots were stored at −80°C. Titers were determined by transducing HT1080 cells with serial dilutions (1:10–1:100,000) of viral supernatant in the presence of Polybrene (8 μg/ml; Sigma-Aldrich) and subsequent fluorescence-activated cell-sorting (FACS) analysis (FACSCalibur; BD Biosciences, Heidelberg, Germany) with an antibody detecting the MGMT protein (anti-AGT mT3.1; Acris, Herford, Germany).
Enrichment and lentiviral transduction of CD34+ cells
After informed consent was obtained, apheresis samples were obtained from two granulocyte colony-stimulating factor (G-CSF)-treated donors. Mononuclear cells were separated by Ficoll density centrifugation (Biochrom, Berlin, Germany) and enrichment of CD34+ cells was achieved with a MidiMACS CD34 MultiSort isolation kit (Miltenyi Biotec, Bergisch Gladbach, Germany) according to the manufacturer's instructions. The purity of the isolated cells was determined by flow cytometry with an anti-CD34 antibody (Dako, Carpinteria, CA) and ranged between 73 and 100%. Enriched CD34+ cells were then prestimulated for 16 to 20 hr at a density of 5 × 10⁵ in Iscove's modified Dulbecco's medium (IMDM) supplemented with 10% FCS, 1% penicillin–streptomycin, human stem cell factor (SCF, 100 ng/ml), Flt-3 ligand (100 ng/ml), and thrombopoietin (20 ng/ml) (all supplements from R&D Systems, Wiesbaden, Germany). Prestimulated CD34+ cells were infected three times over 24 hr with lentiviral particles at a multiplicity of infection (MOI) of 10 in IMDM supplemented with Polybrene (8 μg/ml) (Maier et al., 2008).
Chemotherapeutic treatment of CD34+ cells
Three days after transduction, CD34+ cells were incubated with O 6-BG (Sigma-Aldrich) for 1 hr at 37°C to inhibit endogenous MGMT activity. Next, cells were treated with 12 μM (IC50) BCNU (Chinnasamy et al., 2004) (Bristol-Myers Squibb, Munich, Germany) for 2 hr at 37°C. Subsequently, cells were washed and cultured in IMDM, supplemented with interleukin (IL)-1β, IL-3, IL-6, granulocyte-macrophage colony-stimulating factor (GM-CSF), G-CSF, and SCF (all 10 ng/ml; R&D Systems) for 14 days (Fruehauf et al., 1996). Transduction rates were determined by flow cytometry with the anti-MGMT antibody after 14 days of liquid culture.
Colony-forming cell assay
The CFC assay was performed as previously described (Fruehauf et al., 1996). We cultured 5 × 10³ BCNU-treated, transgenic CD34+ cells in complete methylcellulose medium (#4434; Stem Cell Technologies, Remagen, Germany) in petri dishes at 37°C for 14 days. We exclusively picked burst-forming units-erythrocyte (BFU-E) and isolated genomic DNA and total RNA simultaneously from the same colony, using an AllPrep DNA/RNA micro kit (Qiagen, Hilden, Germany). To ensure that a CFC contained a viral integration, an MGMT transgene-specific PCR was performed with the primers MGMTfor (5′-CGGGATCCGGCACCATGGACAAGGATTGTGAAATGAAACG-3′) and MGMTrev (5′- CTCTAGATCAGTTTCGGCCAGCAGGCGGGGAGC-3′).
Detection of integration sites
For the detection of lentiviral integration sites in CD34+ cells before and after BCNU treatment, LM-PCR was performed as described previously (Laufs et al., 2003; Wu et al., 2003; Kustikova et al., 2008). Genomic DNA was preamplified (REPLI-g mini kit; Qiagen) and digested with either PauI (Fermentas, St. Leon-Rot, Germany) or MseI (New England BioLabs, Frankfurt, Germany). After a linear amplification step with the biotin-labeled primer pHR-1-LM-bio (5′-biotin-CTAGTTAGCCAGAGAGCTCC-3′), paramagnetic enrichment of biotin-marked fragments was performed (Invitrogen, Karlsruhe, Germany) and an adapter cassette (GenomeWalker universal kit; Clontech-Takara Bio Europe, Saint-Germain-en-Laye, France) was ligated. Nested PCR was then performed with the adapter primers AP1 (5′-GTAATACGACTCACTATAGGGC-3′) and AP2 (5′-ACTATAGGGCACGCGTGGT-3′), together with LTR-specific oligonucleotides (oligos) (Table 1). Amplicons arising from LM-PCR performed on treated and untreated CD34+ cells were bar coded with a four-nucleotide sequence tag (Binladen et al., 2007), pooled and subjected to next-generation sequencing (GS FLX; 454 Life Sciences/Roche, Mannheim, Germany) (Margulies et al., 2005). Amplicons generated by LM-PCR performed on CFCs growing on methylcellulose were cloned into the pGEM-T vector (Promega, Mannheim, Germany) and subjected to dye termination sequencing with the ABI Prism 310 genetic analyzer (BigDye Terminator v3.1 cycle sequencing kit; Applied Biosystems, Foster City, CA).
Estimation of vector copy number
For determination of vector copy number by quantitative real-time PCR, genomic DNA was isolated from up to 106 CD34+ cells, using a QIAamp DNA blood mini kit (Qiagen) according to the manufacturer's instructions. Reference standard curves were constructed by diluting plasmids containing either a part of the erythropoietin receptor gene (EPOR) (Schilz et al., 2000) or MGMTP140K . Primers specific for EPOR were used to quantify the total amount of human genomes. Primers specific for MGMTP140K were used to quantify the proportion of human genomes with integration of the viral vector. The reactions were performed once in triplicate, using the following reaction mix: a 300 nM final concentration of forward and reverse primers was mixed with 200 ng of genomic DNA (untreated, treated CD34+ cells or colonies) in a total reaction volume of 10 μl of SYBR green mix (Qiagen). Quantitative real-time PCR was performed on a LightCycler 480 (Roche) using the following PCR program: 15 min at 95°C and 45 amplification cycles (95°C for 15 sec, 60°C for 60 sec, and 72°C for 30 sec).
Analysis of integration patterns
Each sequence retrieved by 454 sequencing was initially screened for the presence of the 4-bp identifier bar code (Table 1), for 70 bp of the 5′ LTR, and for the adapter sequence. LTR, adapter sequences, and internal bands (vector parts that arise during LM-PCR and contain the 3′ LTR and a part of the vector backbone) were removed (Laufs et al., 2003). The remaining sequences were compiled in a FASTA-compatible file, which was then submitted to the publicly available QuickMap tool at
QuickMap performs high-throughput mapping to the human genome (version: Homo_sapiens.Ens52.NCBI36, 2008) and collects detailed integration site information (MapperReport). For the MapperReport query sequences entered at the web interface (
Assignment of gene classes
For classification of genes that were hit by the vector, we used the publicly available DAVID/EASE tool (
Common insertion site analysis
For the identification of common insertion sites (CIS) in the untreated and treated groups, we determined the distance between neighboring integration sites. As previously described, a CIS of the second, third, and fourth order exists if two, three, or four independent integrations are located in a 30-, 50-, or 100-kb window (Deichmann et al., 2007). The number of observed CIS for each group in each order was compared with expected CIS values by exact binomial testing. The expected numbers of CIS were calculated as described previously (Abel et al., 2007). In addition, the difference between observed CIS in the untreated and treated groups was compared, using a χ2 test of equal proportions.
Analysis of expression of hit genes
Gene expression in cells cultured under conditions similar to those we used before transduction has been previously measured (Gordon et al., 2006). In this study, the CD34+ pool was divided into nonadherent and adherent fractions. The adherent fraction was prestimulated with a cytokine cocktail comparable to the cytokines we added to the CD34+ cells before and during transduction. Thus, only the microarray data from the prestimulated adherent fraction (E-MIMR-861) were downloaded from the ArrayExpress database (
Analysis of expression of hit and provirus flanking genes
Hit and flanking genes found in a ±250-kb window around each integration site were extracted from the MapperReport. If no genes were found to be located in this window or for general measurement of more distant genes the UCSC genome browser (
Statistical testing
To allow for small expected numbers under the null hypothesis, appropriate statistical methods were chosen. Specifically, to determine statistically significant differences between the frequencies of hits in genes/cancer genes in treated and untreated CD34+ cells we used two-sided binomial tests. Integration distributions detected in the treated, untreated, and random sets around TSS, CpG islands, SINE, and LINE were compared using a two-sided Kolmogorov–Smirnov (KS) test. Fisher's exact test was used to test for significant integration preferences for fragile sites instead of the corresponding χ2 test, which relies on asymptotics and therefore on larger sample sizes (Stephens, 1974; D'Agostino and Stephens, 1986). For the statistical analysis of hit gene expression levels in the treated and untreated CD34+ bulk, we calculated rank products as described previously (Breitling et al., 2004) and tested whether the ranks of the hit genes follow a uniform random distribution between the minimum (= 1) and maximum (= 22,306) possible ranks, using two-sided one-sample KS tests. Similarly, the ranks of treated and untreated samples were compared by a two-sample KS test. Here, the KS test was chosen because it has a higher power than the corresponding χ2 test and can even be used for much smaller sample sizes (<40) (Stephens, 1974; D'Agostino and Stephens, 1986).
For the expression analysis of hit and flanking genes in CFCs, the expression value for each colony was analyzed for outliers, whereas the p values were adjusted for multiple testing according to Holm's method (Holm, 1979). To detect significant differences in expression levels detected in untransduced and transduced CFCs, we applied a two-sample Wilcoxon rank-sum test, which at this sample size had a power of 89%, higher than commonly accepted (80%) for clinical trials according to the ICH (International Conference on Harmonisation of Technical Requirements for Registration of Pharmaceuticals for Human Use) E9: Statistical Principles for Clinical Trials (
Results
The study presented here was conducted (1) to evaluate the impact of chemoselection on lentiviral integration patterns in resistance gene-transduced CD34+ cells and (2) to assess the influence of the lentiviral vector on expression of genes flanking the integration site (Fig. 1). Therefore, CD34+ cells were transduced with a lentiviral vector for MGMTP140K overexpression and subsequently treated with 12 μM (IC50) BCNU (Chinnasamy et al., 2004). Integration patterns of BCNU-treated and untreated cell bulks were compared. In addition, CD34+ cells of the BCNU-treated bulk were further cultured on methylcellulose (MC), picked, and analyzed for integration sites (LM-PCR) and flanking gene expression (real-time PCR).
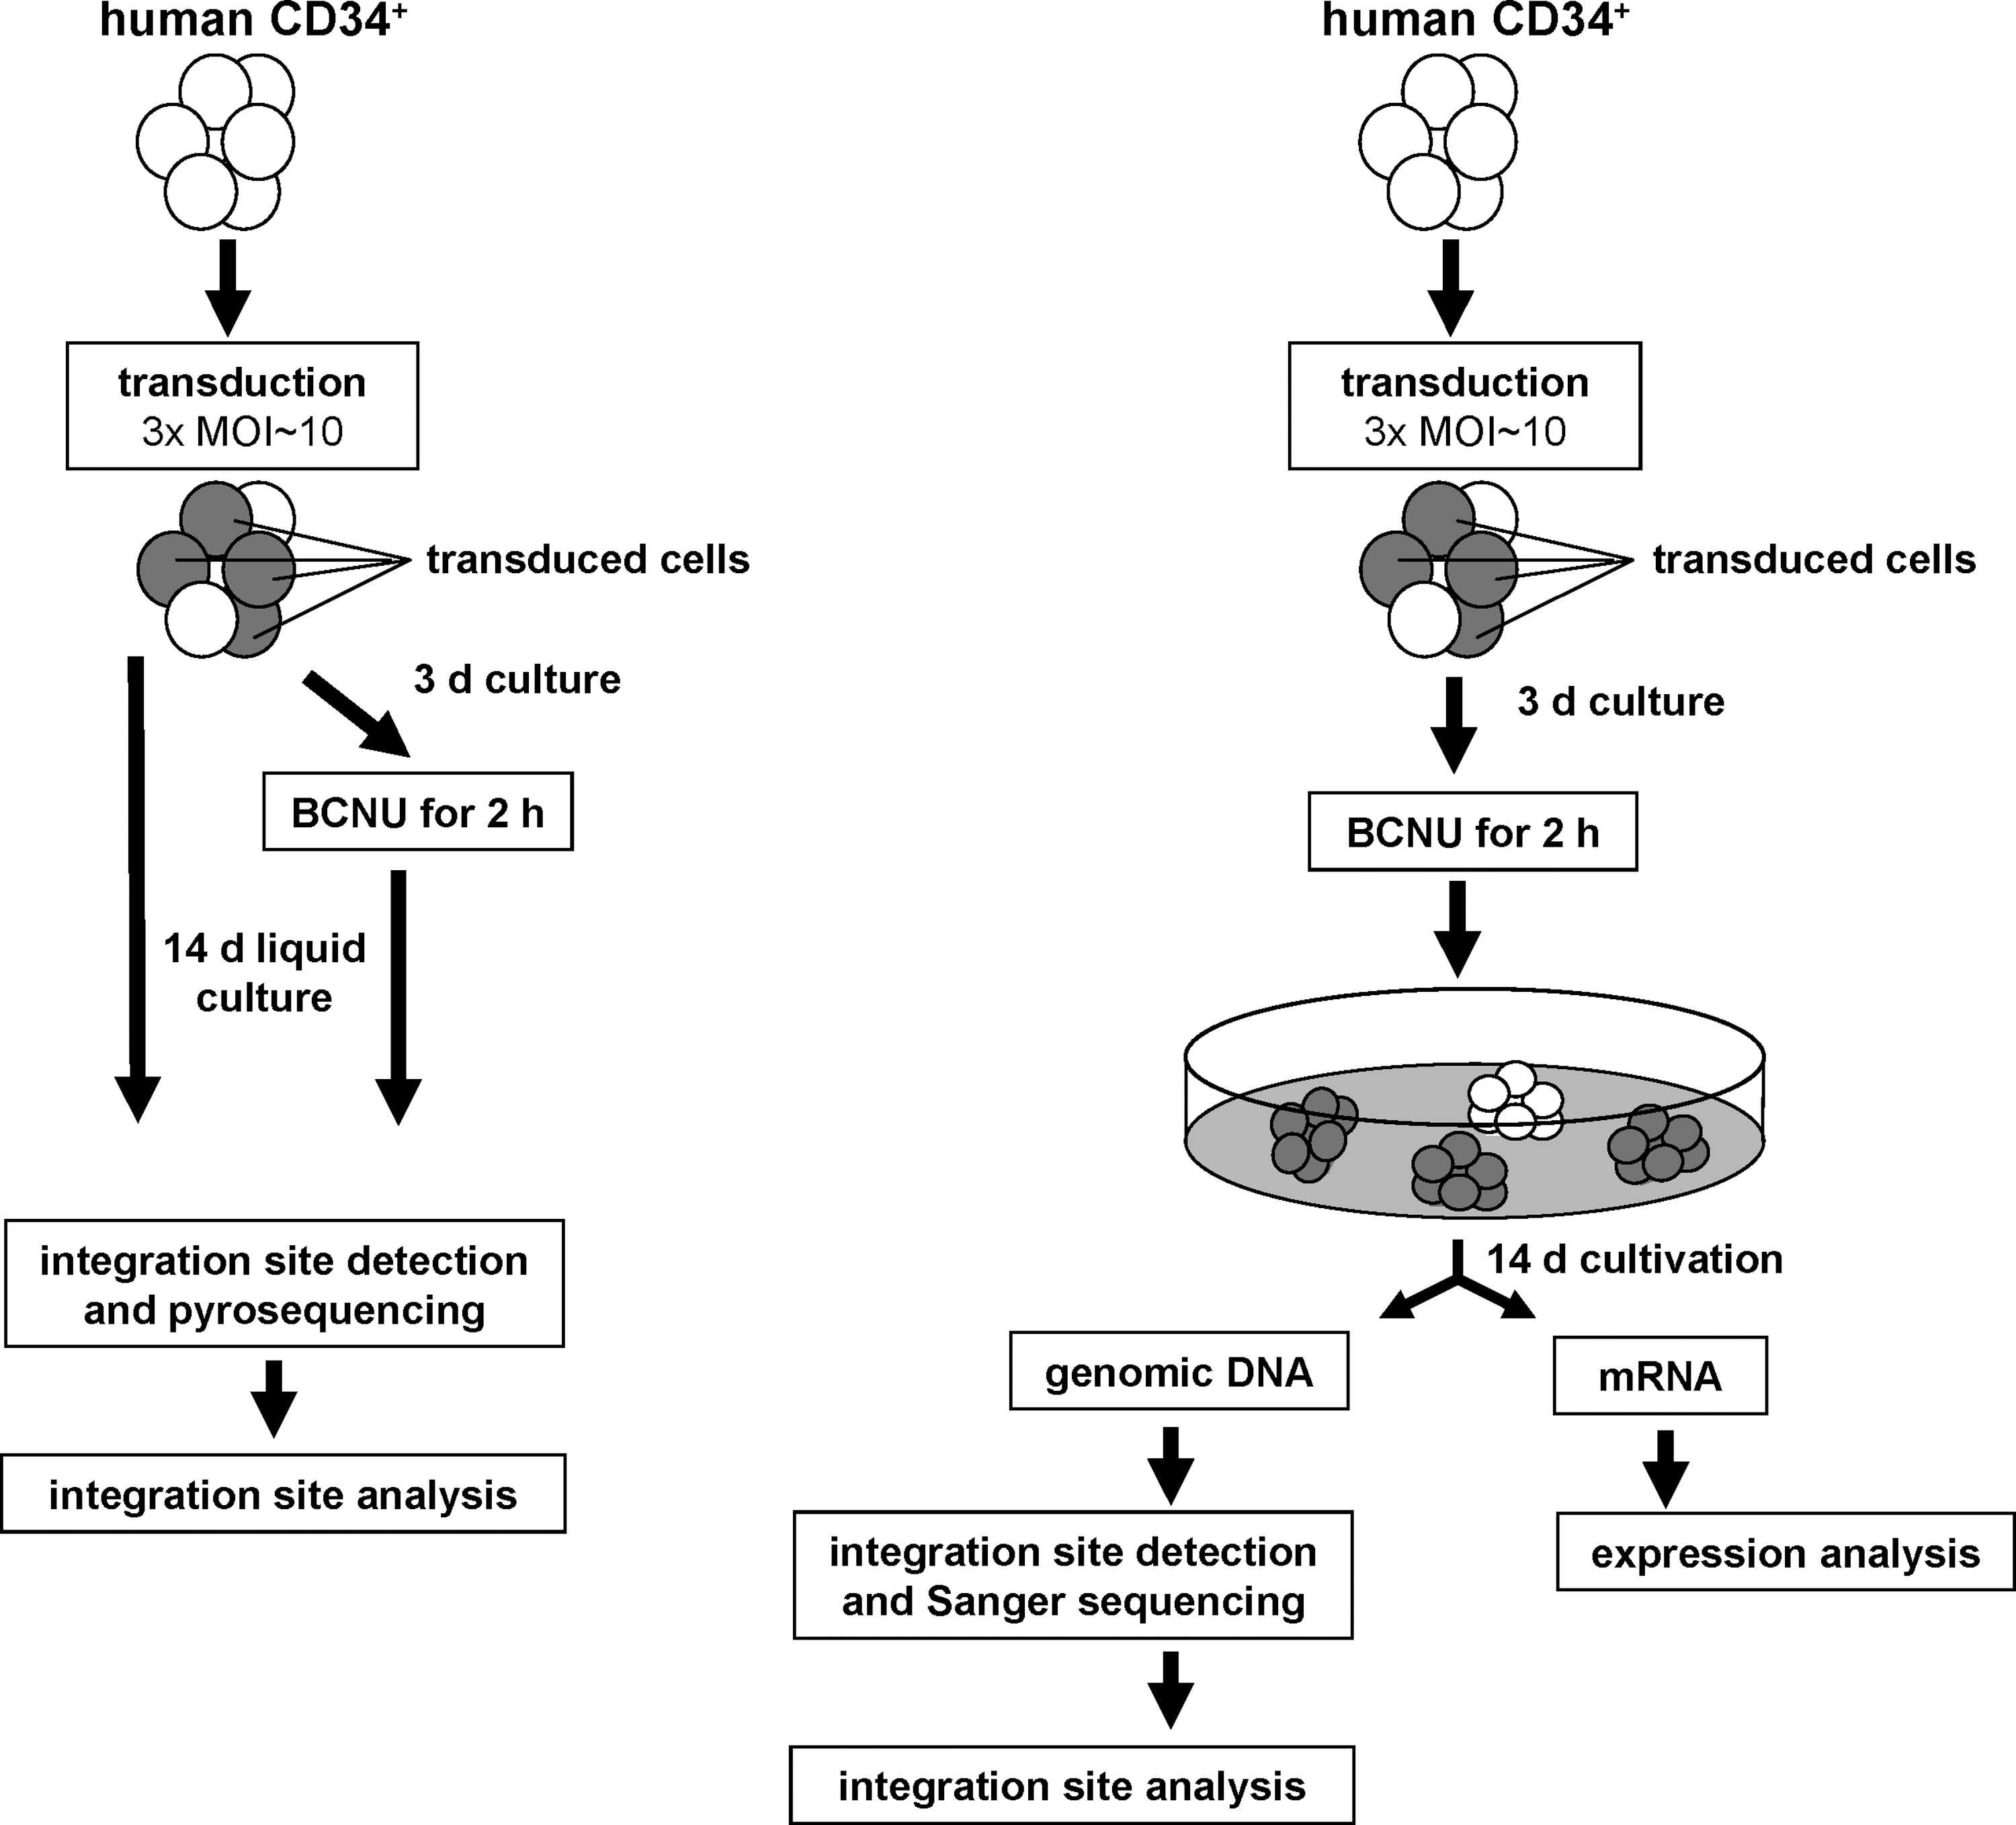
Experimental setup. Left: Human CD34+ cells from two different donors were transduced with the lentiviral vector pHR′SIN-MGMTP140K at an MOI of 10 and received either no treatment or BCNU chemotherapy (12 μM, IC50). Integration patterns were determined by LM-PCR and with the QuickMap tool (
Transduction of CD34+ cells, detection of integration sites
Transduction efficiency (see Supplementary Fig. 1 at
The estimated vector copy number per untreated CD34+ cell was 2.8 (D1) and 1.4 (D2). For both donors, the treated CD34+ bulk cells contained nearly similar vector copy numbers per cell (1.7 for donor 1 and 1.9 for donor 2). The vector copy number of the CFCs ranged between 0.5 and 3.5.
Integration patterns in treated and untreated CD34+ cells
The 421 unique integration sites were further analyzed in detail with QuickMap (Appelt et al., 2009). First, we investigated the frequency of hits in genes and cancer genes, where we defined a hit into a gene if the integration base was located between the genomic start and end positions of Ensembl-annotated genes. In line with previous reports using SIN lentiviral vectors (Schroder et al., 2002; Wu et al., 2003; Mitchell et al., 2004; Laufs et al., 2006), 67% (untreated CD34+ cells) and 79% (treated CD34+ cells) of all integrations were located in genes, significantly more than expected from a random distribution (Appelt et al., 2009) (39%; p < 0.0001 for both). No significant difference could be detected between the frequencies detected for treated and untreated CD34+ cells (p = 0.6). Analyzing the vector distribution with respect to the length of a hit gene revealed no significant accumulation of the lentiviral vector in any region of the hit gene in either group (see Supplementary Fig. 2 at
Next, a window of ±10 kb around each TSS, CpG island, SINE, and LINE (Fig. 2) was analyzed for the appearance of integration sites. In line with previous reports (Schroder et al., 2002; Mitchell et al., 2004), integration was not detected to occur preferentially in or around these elements, and no significant difference was detectable when comparing both groups (p > 0.18).
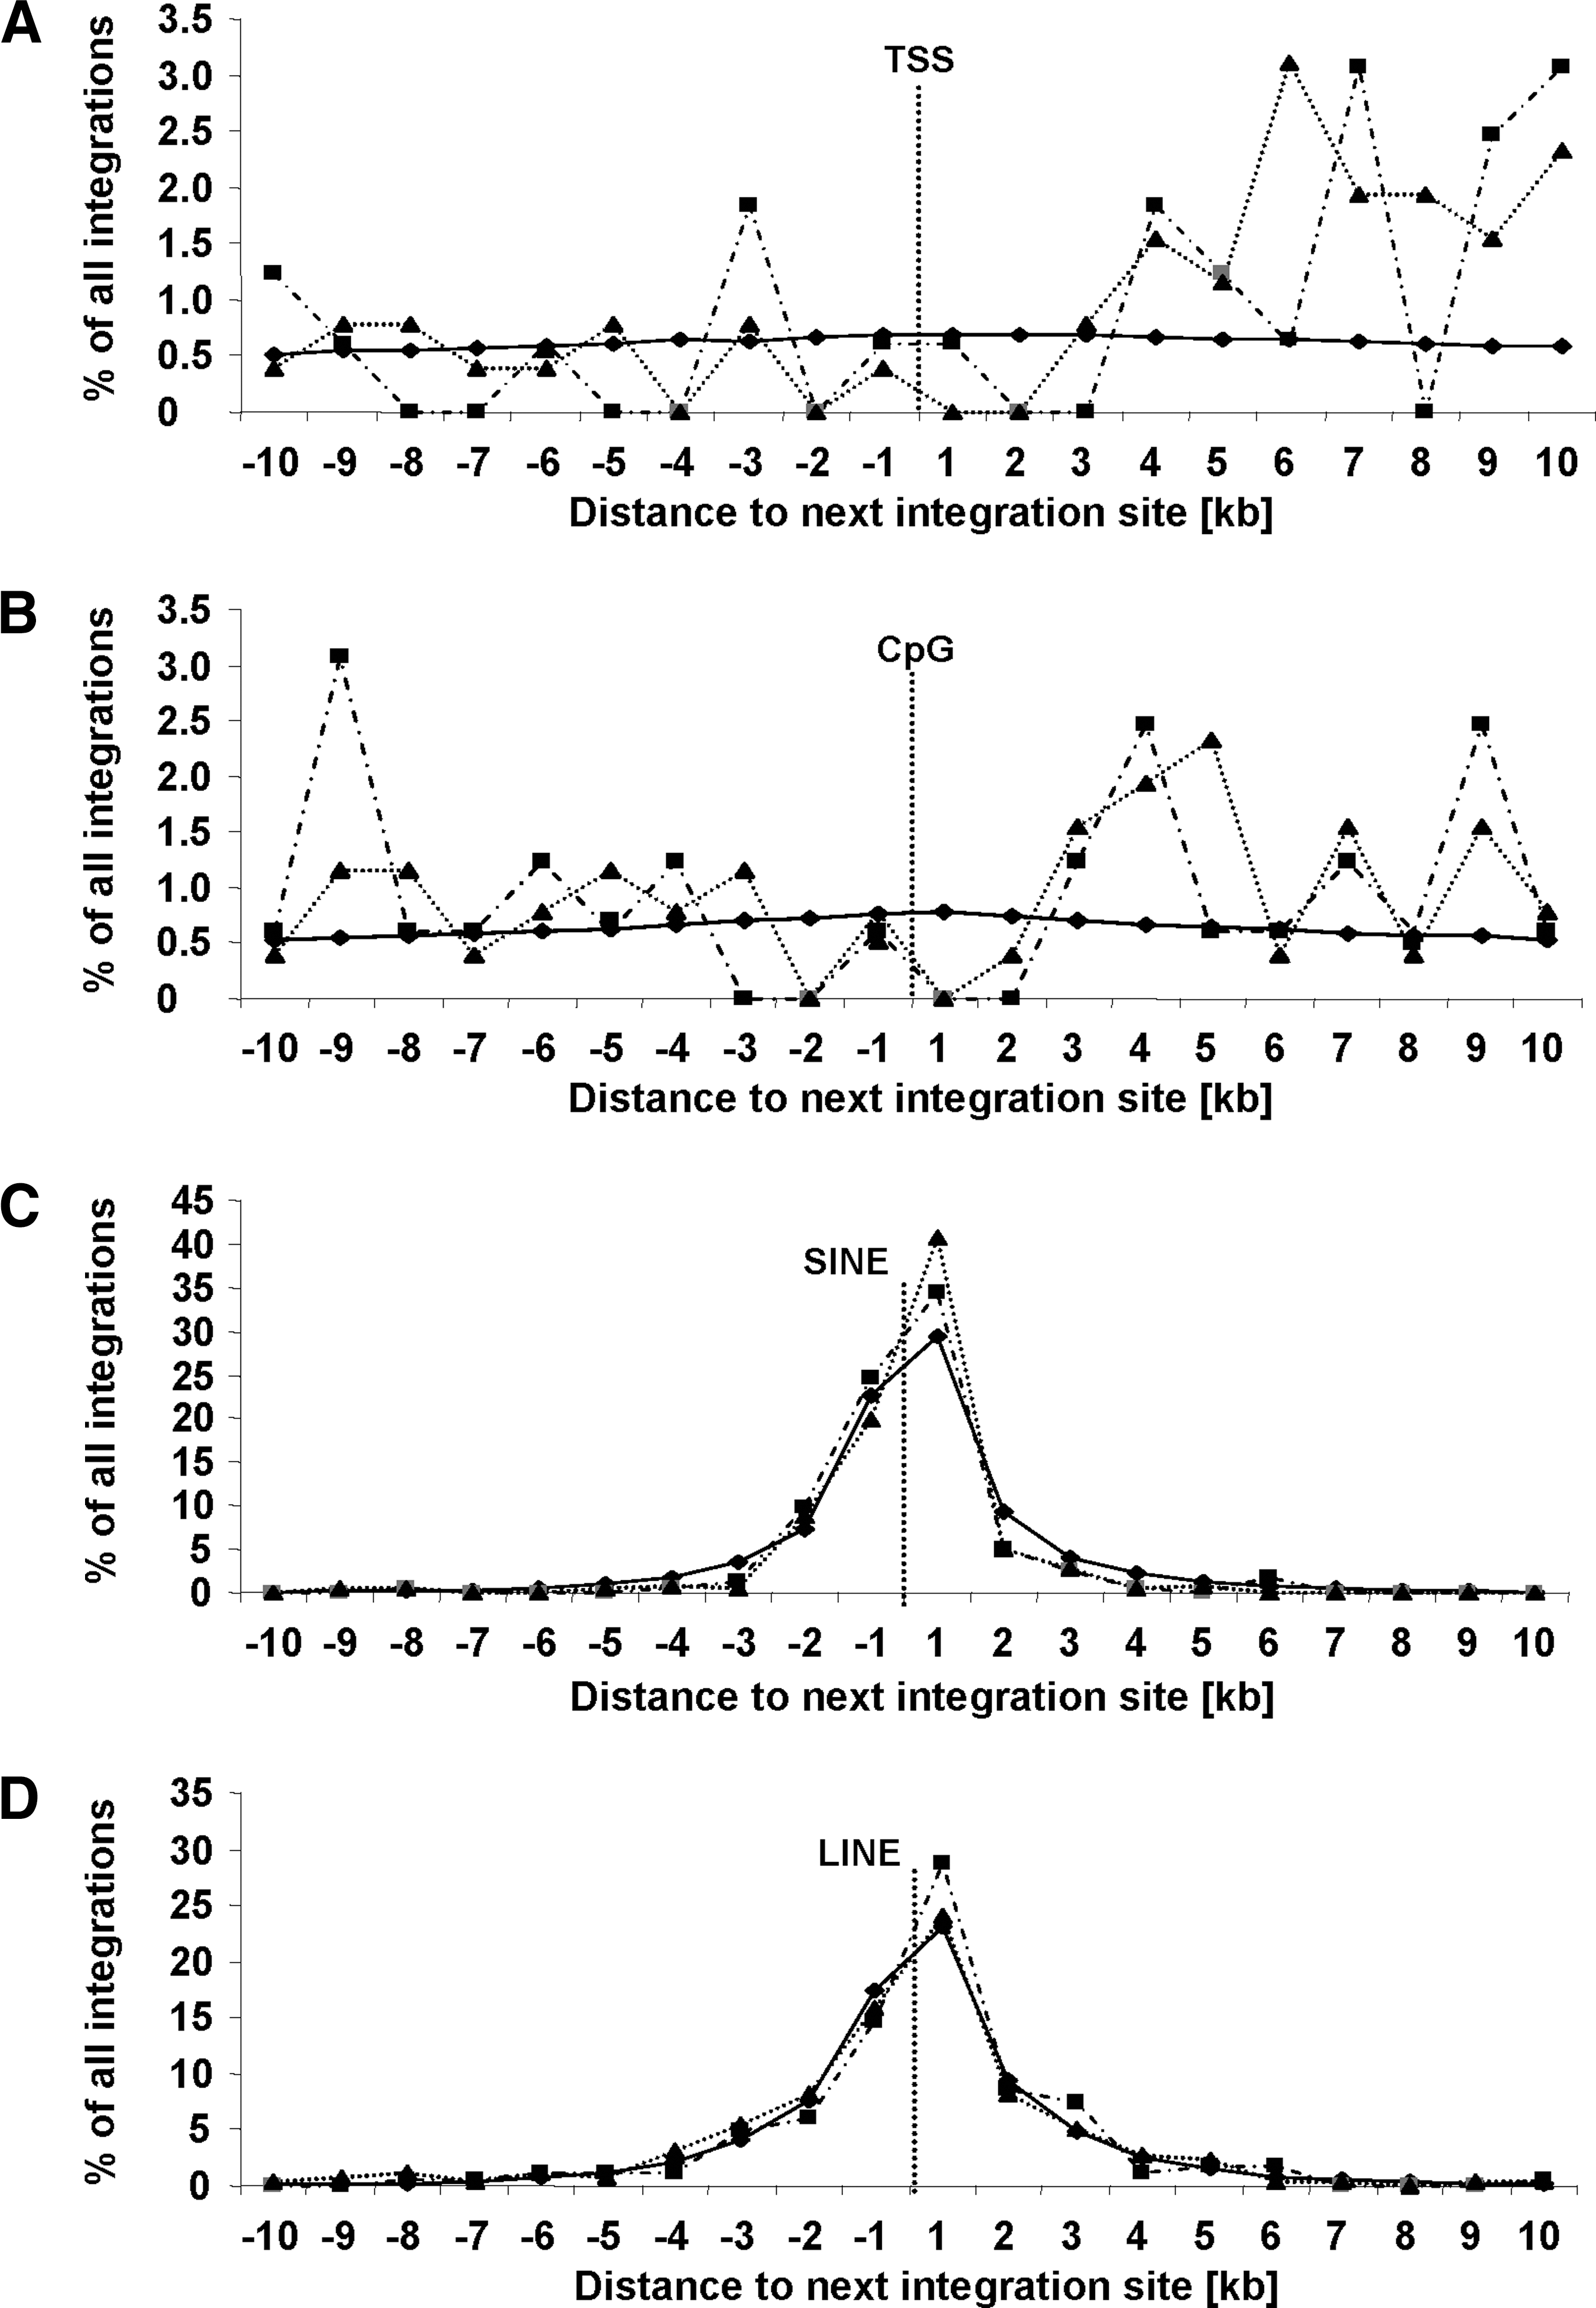
Genomic features around integration sites. We analyzed a region of ±10 kb around (
Moreover, functional annotation of genes hit by the vector in treated and untreated CD34+ cells, using DAVID/EASE, revealed (after Benjamini correction) no significant enrichment in specific gene classes (biological process, molecular function, and cell compartment). Adjustment of the p values for multiple testing, using the Benjamini correction, is required for limitation of false positive occurrences (Benjamini and Hochberg, 1995).
Vector integration in the untreated and treated groups is clustered in CIS
We found five CIS of second order in the untreated group, whereas nine CIS of second order and two CIS of third order in the treated group (for details see Supplementary Tables 3 and 4 at
Integration in fragile sites
We were further interested in integrations in common and rare fragile sites because they are vulnerable regions on mammalian chromosomes that are frequently found to be altered in leukemia, lymphomas, or solid tumors (reviewed in Popescu, 2003). Integration frequencies in 120 common and rare fragile sites were obtained from the AnalyzerReport generated by the QuickMap tool (Appelt et al., 2009). Here, none of the fragile sites showed significantly increased integration frequencies (p > 0.14).
Hit gene expression analysis
Previous studies reported that active genes are favored loci for HIV integration sites (Schroder et al., 2002; Mitchell et al., 2004). Here, we investigated whether BCNU treatment alters the integration pattern; it would be of interest if BCNU treatment selects for integration sites in more highly expressed genes. Therefore, we measured expression levels of hit genes by reanalyzing a published microarray data set obtained from human CD34+ cells (Gordon et al., 2006). Expression of 245 of the 313 genes that were seen to be hit in both groups (159 of the treated and 86 of the untreated CD34+ cells) was covered by the microarray analysis and therefore could be ranked. Analyzing both groups as a whole, we found genes hit by the virus to be expressed at a significantly higher level (data not shown; p < 2.2 × 10⁻¹⁶). Separate analyses of both hit gene sets (untreated and treated) revealed that BCNU treatment slightly, but insignificantly (p = 0.92), increased the number of detected integrations in genes with high expression rates at the time of transduction (Fig. 3).

Expression of vector-hit genes in treated and untreated CD34+ cells. In this graph, expression levels of hit genes (indicated as rank gene expression; x axis) are plotted against the corresponding integration frequency (y axis). The solid black curve depicts hit gene expression levels and integration frequencies found in treated CD34+ cells; the corresponding theoretical uniform distribution across ranks 1 to 22,306 is drawn as a horizontal gray line. A theoretical uniform distribution reflects a similar hit frequency across all 22,306 ranked genes spotted on the chip. Similarly, the ranks and expression levels of the hit genes found in untreated CD34+ cells are displayed as a dotted black curve and the corresponding theoretical uniform distribution across ranks 1 to 22,306 is shown as a dotted horizontal gray line. The null hypothesis that no correlation of gene expression and hit frequency exists (reflected by the two theoretical uniform distributions) was evaluated by two-sided Kolmogorov—Smirnov tests.
Expression analysis of hit and flanking genes
With respect to vector-related adverse events that have appeared in gene therapy studies, we were interested in assessing the deregulative potential of the SIN lentiviral MGMT vector. Overall, about 70% of the picked colonies contained the vector, as detected by MGMTP140K -specific PCR (data not shown). To this end, we extracted total RNA from 8 transduced, BCNU-selected CFCs as well as from 10 untransduced CFCs. Expression levels of 39 genes that were either hit by the provirus or found adjacent to the integration site were measured by quantitative real-time PCR (Fig. 4). For 23 of these genes, expression was detectable; 16 genes showed no expression in any of the analyzed colonies.
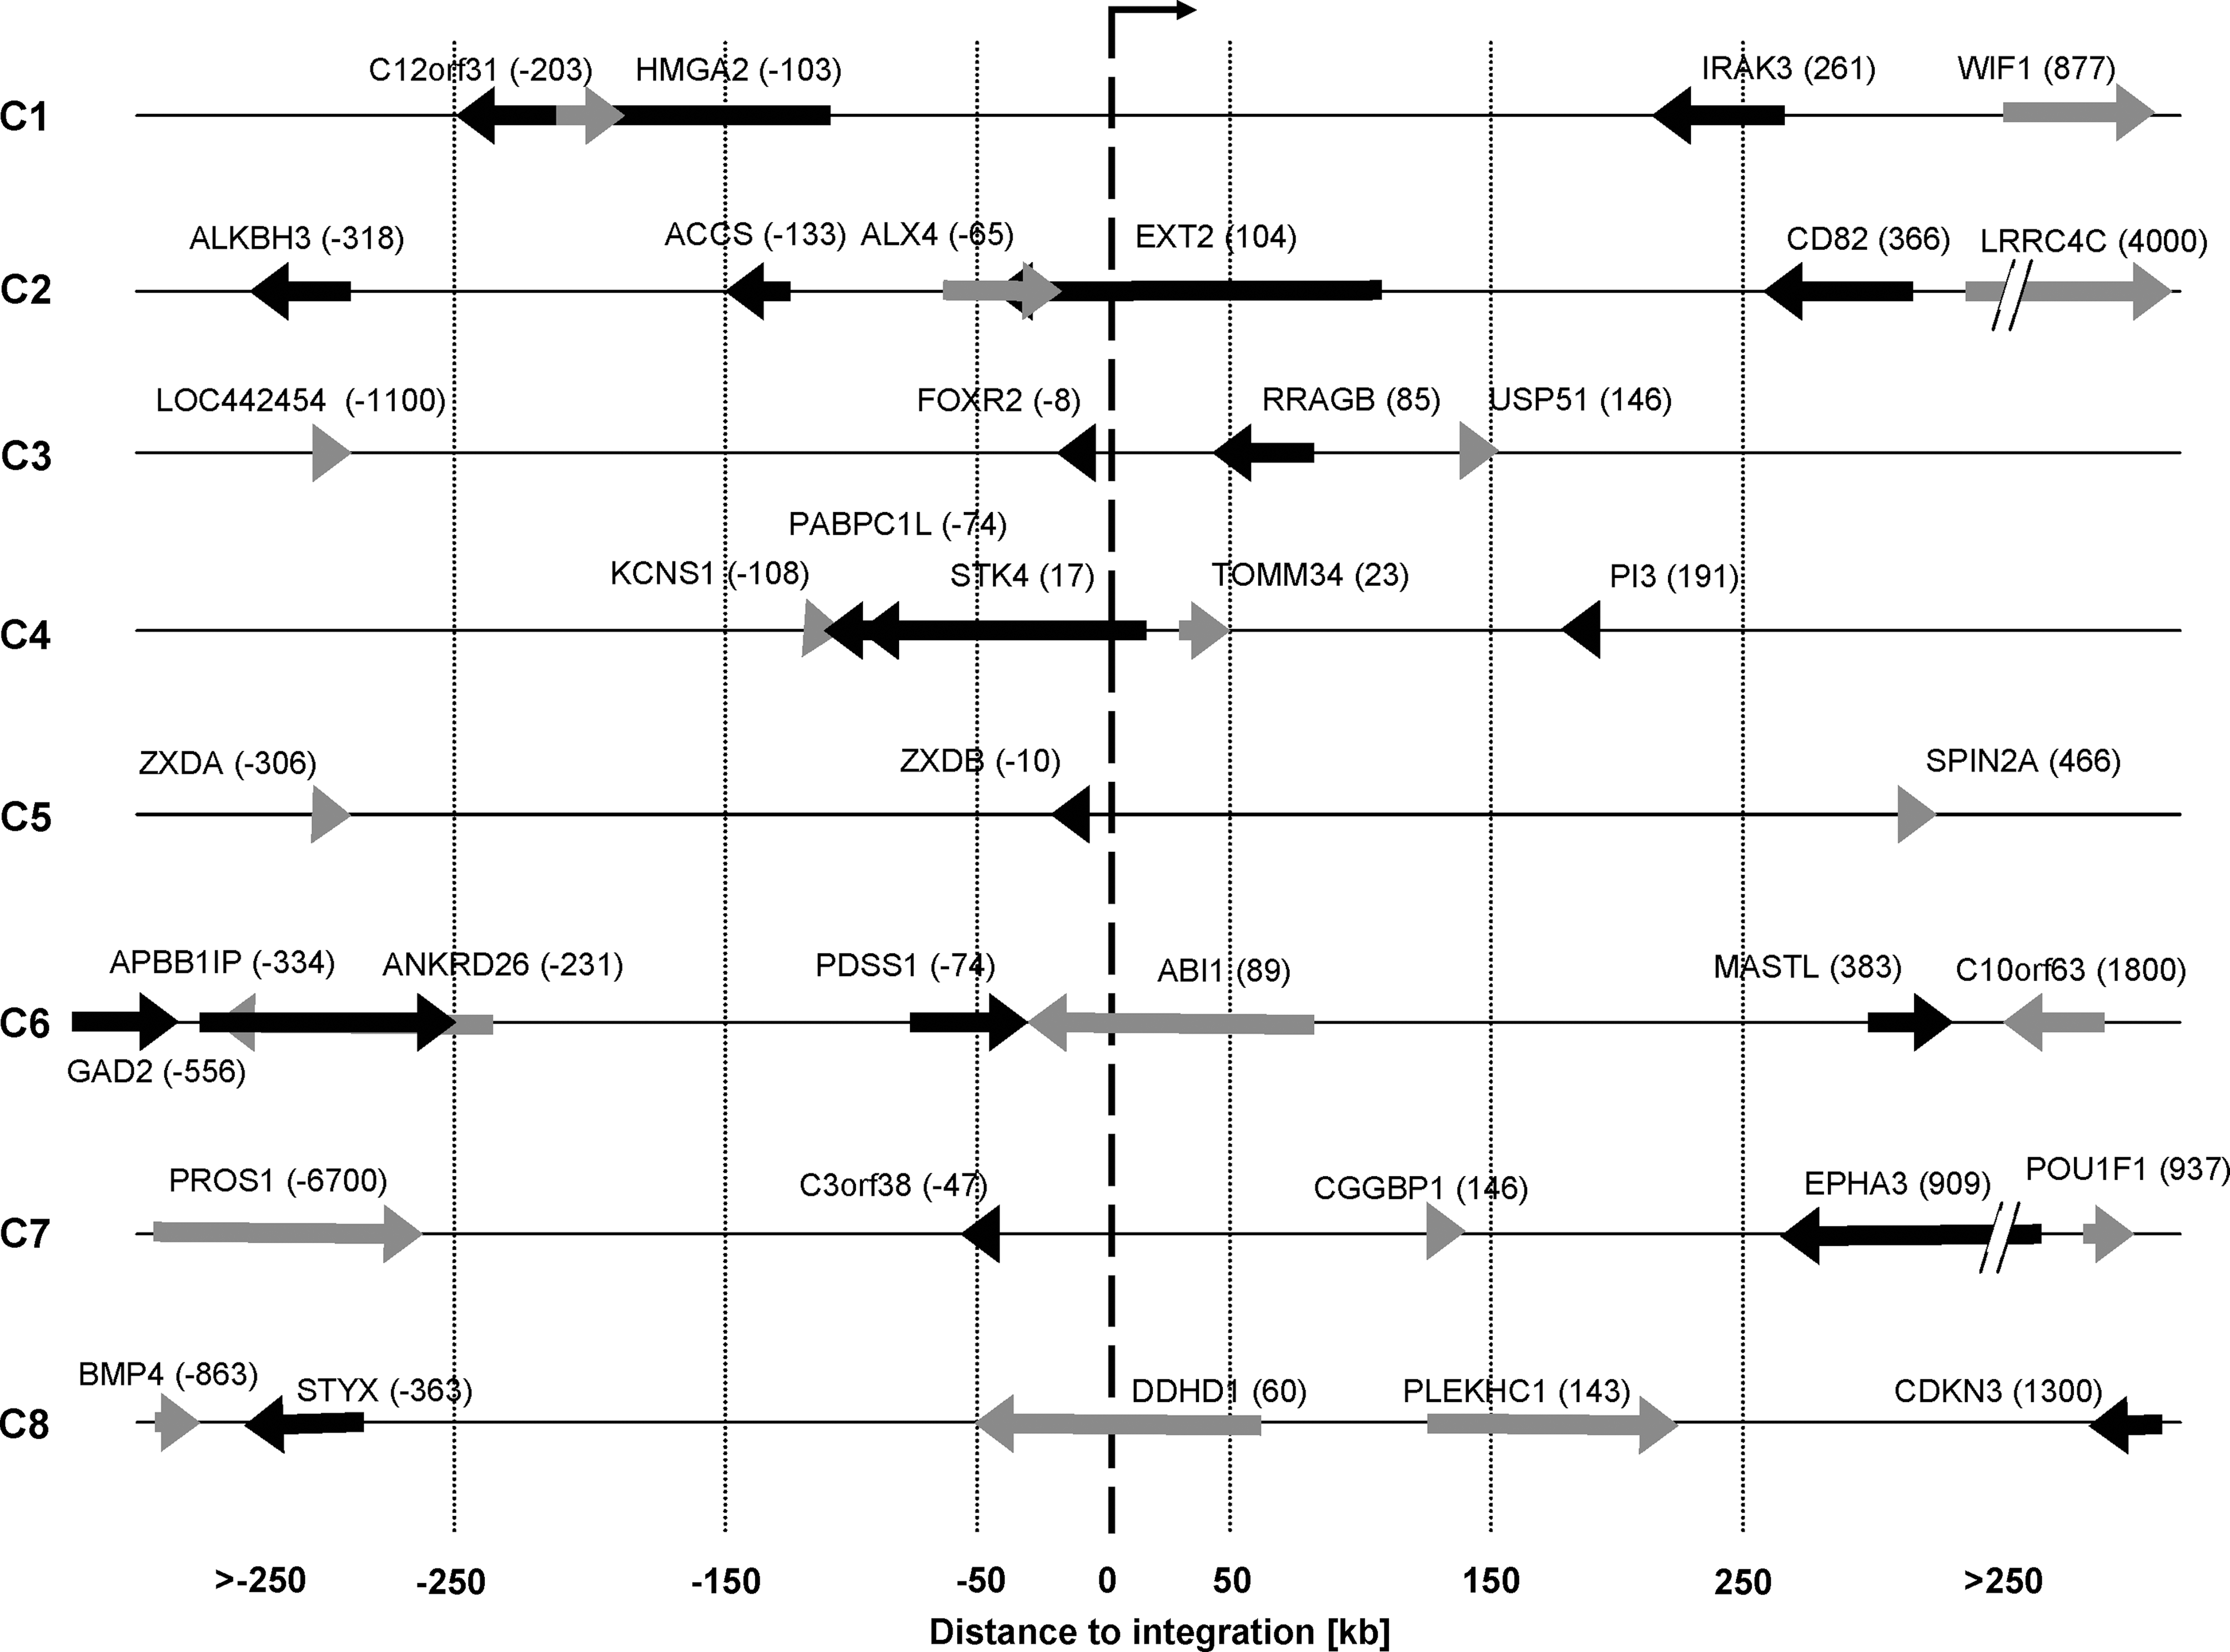
Overview of analyzed hit and flanking genes. Integration sites of eight transduced CFCs (C1–C8) are shown in a ±250-kb window around each integration site. The arrow at 0 kb indicates the orientation of the vector. Black/gray arrows represent genes hit or adjacent to the viral integration. Genes that are located on the plus strand are indicated as black arrows; genes located on the minus strand are depicted as gray arrows. The length of the arrows represents the gene length. The number behind each gene name indicates the distance of the TSS to the integration site in kilobases.
First, the expression level of a gene (referred to as the “gene of interest”) in the colony where the integration was located in or adjacent to the gene of interest (“test colony”) was compared with its expression levels detected in all other colonies (“control colonies”) where the integration occurred in other loci (Fig. 5A). Overall, after adjustment of the p values for multiple testing, no statistically significant difference between the expression levels of any gene in the test colonies and the control colonies could be detected (p > 0.72). For all genes, the expression value of the test colony fell in the 95% confidence interval (Clopper and Pearson, 1934). Importantly, three tested cancer genes, namely ABI1, EXT2, and HMGA2, showed either no abnormal gene expression level in the test colony (ABI1 and EXT2), or was not detected in any real-time PCR assay (HMGA2).
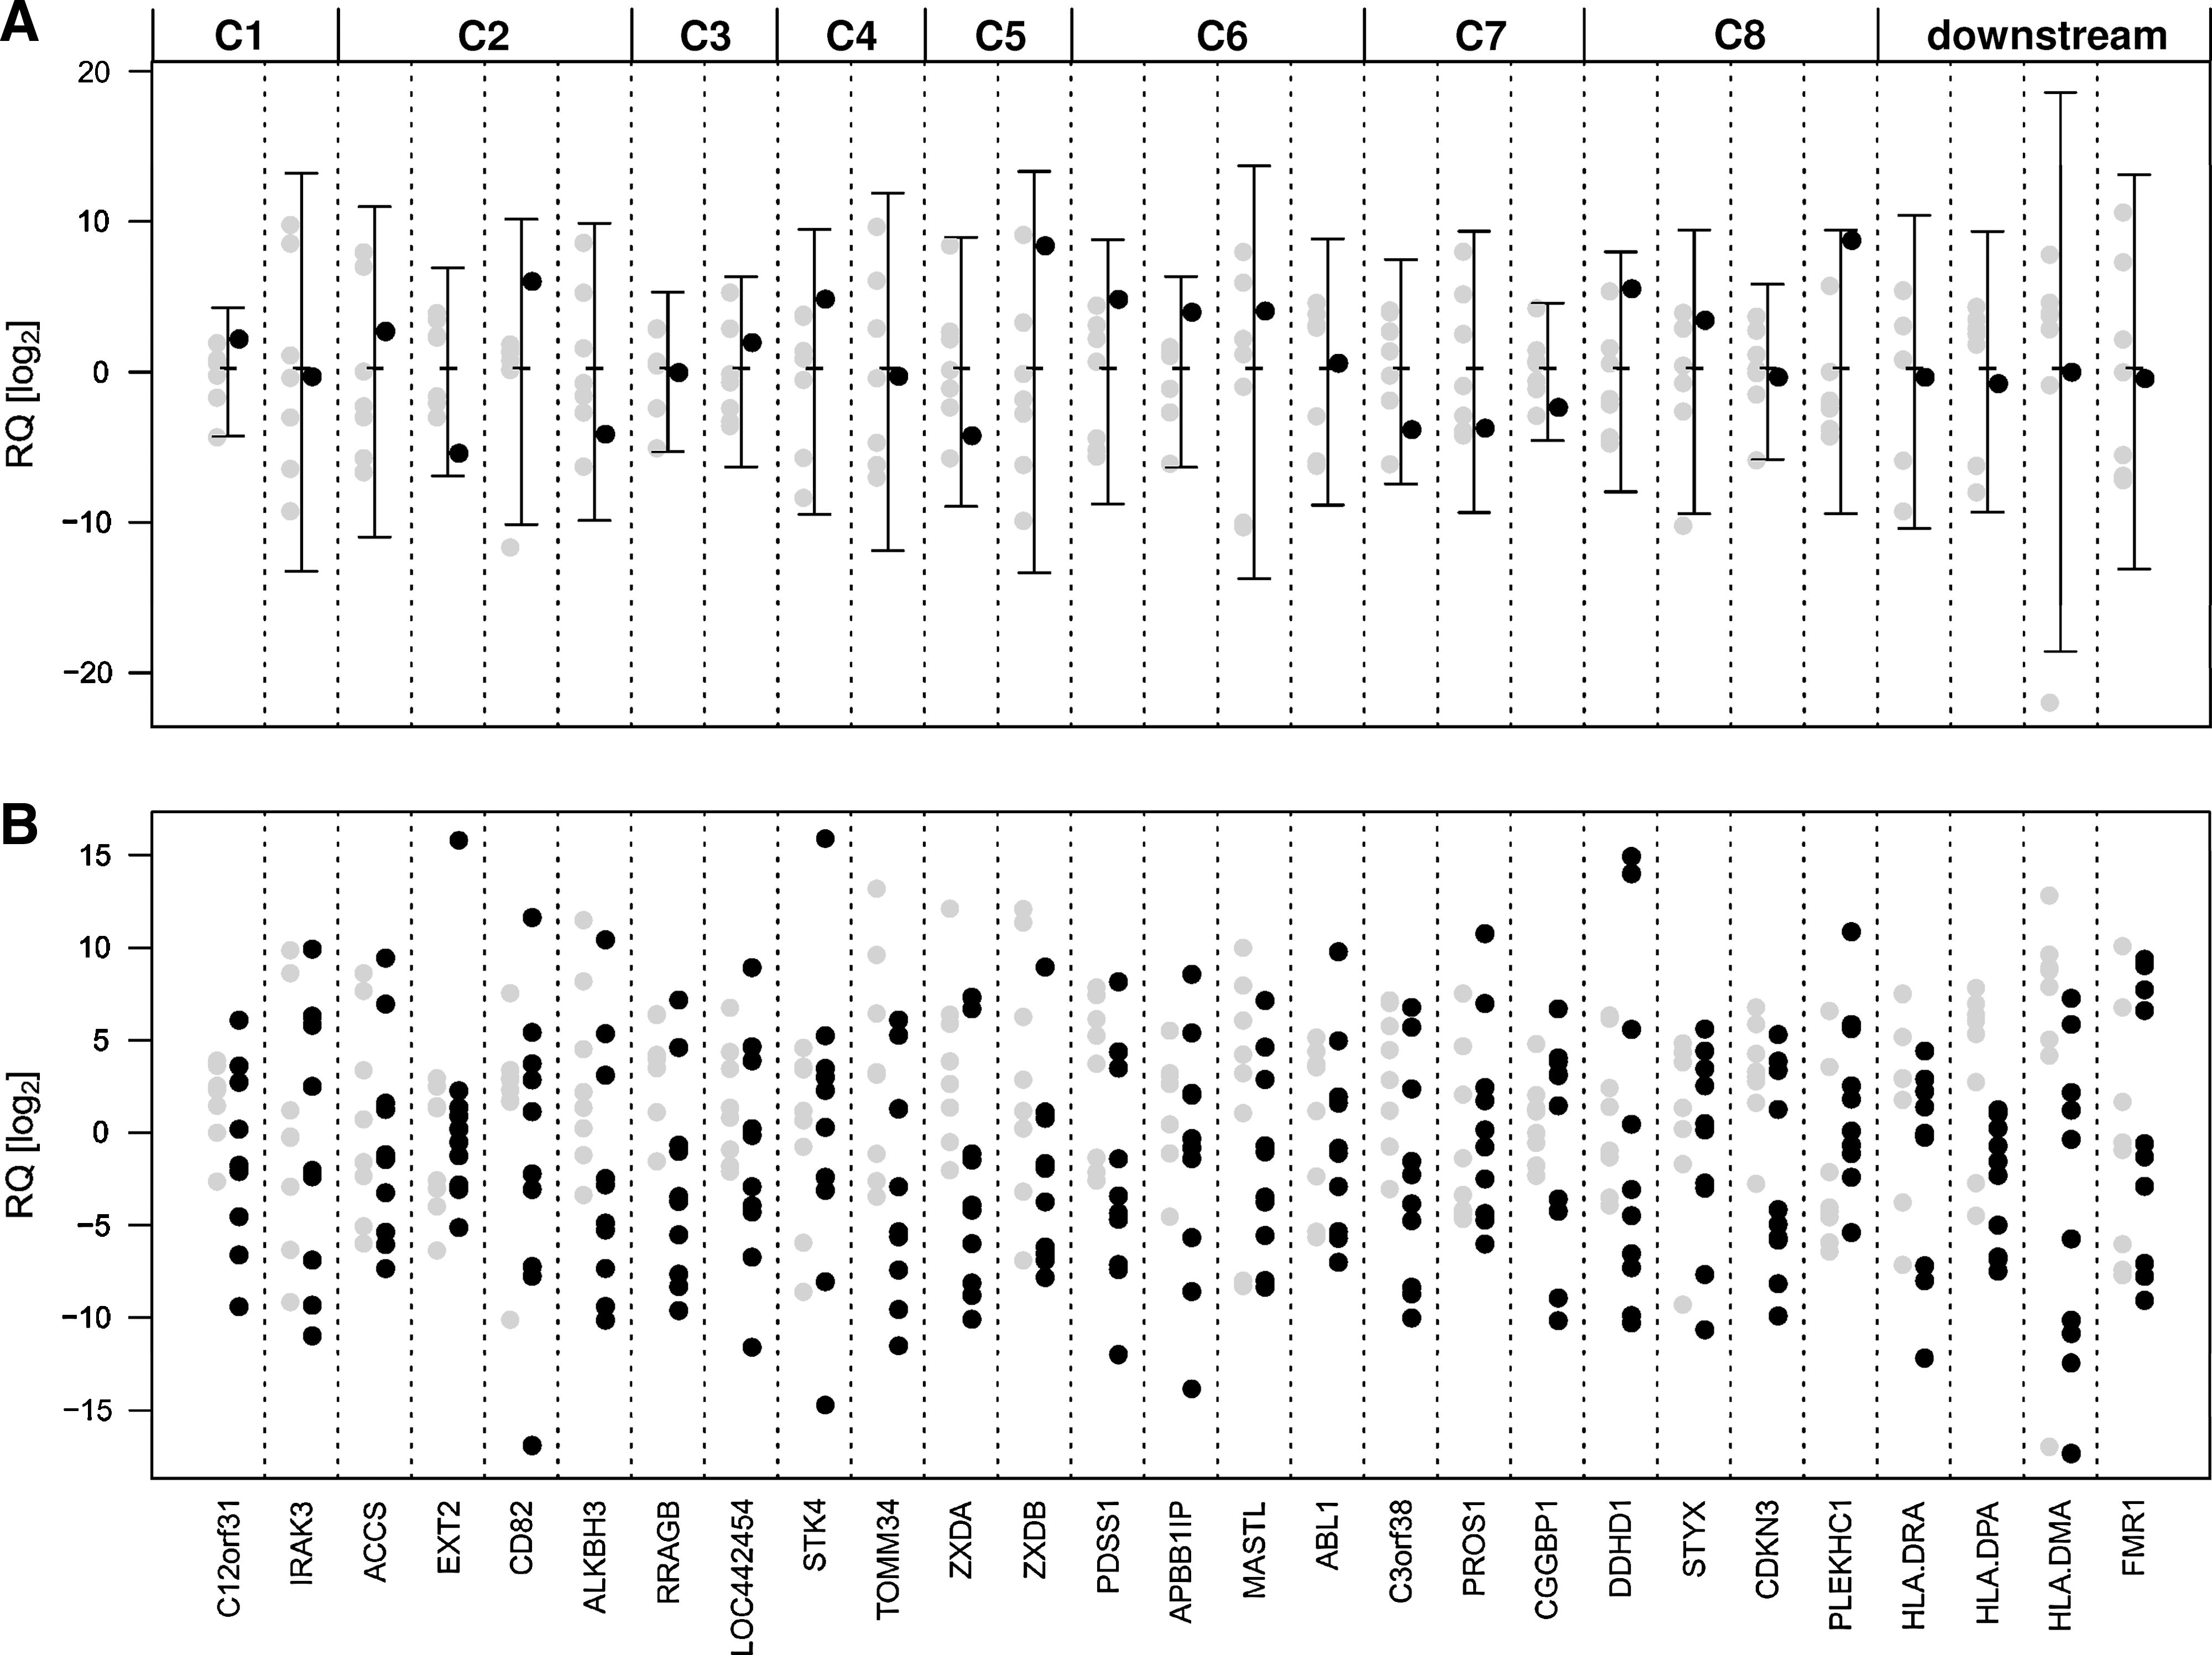
Flanking gene expression profiling. (
Because gene expression varied depending on the colonies tested, we analyzed whether these variations correlated with the gene expression. Here, linear regression analysis of mean gene expression levels versus the variance in gene expression across transduced colonies showed no correlation (p > 0.05).
Next, we compared expression levels of genes of interest in transduced CFCs with levels detected in 10 untransduced CFCs (Fig. 5B). Therefore, we compared the expression levels in the untransduced group with the expression levels in the transduced group for significant differences. We did not see any significant difference after adjustment for multiple testing between the untransduced and transduced CFCs (p > 0.3).
Expression of genes regulated by factors encoded by hit /adjacent genes
Of the 19 genes that were flanked by proviruses and found to be expressed, 2 genes encoded transcription factors or cofactors, namely ZXDA (C5) and CGGBP1 (C7). For both, we also analyzed genes (HLA-DRA, HLA-DPA, and HLA-DMA for ZXDA; FMR1 for CGGBP1) that were shown to be regulated by either factor (Chen et al., 2003; Al-Kandari et al., 2007). None of these “downstream” genes showed any deregulation in the test colony compared with the control colonies, although ZXDA and CGGBP1 had the lowest expression value (not significant) compared with the control colonies (Fig. 5A and B).
Discussion
Alkylating agents such as BCNU, 1-(4-amino-2-methyl-5-pyrimidinyl) methyl-3-(2-chloroethyl)-3-nitrosourea hydrochloride (ACNU), or temozolomide (TMZ) induce DNA modifications via transfer of alkyl groups to the base guanine, which can be efficiently removed by MGMT. These substances are included in current chemotherapy regimens for a variety of tumors, predominantly brain tumors (Phillips et al., 1986; Stupp et al., 2005). The antineoplastic therapy can be further improved on sensitization with the MGMT inhibitor O 6-BG (Dolan et al., 1990; Gerson et al., 1993). Specifically, in the treatment of high-grade gliomas, O 6-BG combination therapy improves patient survival because MGMT is frequently found to be overexpressed and highly active in these tumors (Wiestler et al., 1984; Hegi et al., 2005). However, O 6-BG also sensitizes HSCs toward alkylating agents, and adverse events such as myelosuppression are frequently dose-limiting during combination therapies (Friedman et al., 2000; Quinn et al., 2005, 2009; Ranson et al., 2006). Therefore, to efficiently protect HSCs, transfer of O 6-BG-resistant MGMT mutants (e.g., MGMTP140K) was necessary (Xu-Welliver et al., 1999).
Feasible and efficient chemoprotection based on retroviral vector-mediated MGMTP140K expression in HSCs and their progeny has been demonstrated in several in vivo studies (Ragg et al., 2000; Sawai et al., 2001; Jansen et al., 2002; Neff et al., 2005; Milsom et al., 2008; Beard et al., 2009; Larochelle et al., 2009). Although retroviral gene transfer enables sustained expression also in the HSC progeny, it has been shown to be associated with clonal imbalance or leukemia in animal studies (Li et al., 2002; Seggewiss et al., 2006; Modlich et al., 2008) and human studies (Ott et al., 2006; Hacein-Bey-Abina et al., 2008; Howe et al., 2008). Integration of the therapeutic vector in or close to proto-oncogenes such as LMO2 or EVI1/MDS and subsequent gene deregulation was postulated to display the key event preceding these severe adverse effects (Li et al., 2002; Ott et al., 2006; Seggewiss et al., 2006; Hacein-Bey-Abina et al., 2008; Howe et al., 2008). Although the actual incidence of flanking gene deregulation is to date largely unknown, it is thought to occur more frequently in studies using vectors derived from the murine leukemia virus (MLV), which exhibits integration preferences for transcription start sites and promoter regions (Wu et al., 2003). As an initial step in safety assessment it is therefore necessary to generate comprehensive integration profiles of candidate vectors for clinical applications.
Therefore, we performed a comprehensive analysis of integration patterns of a self-inactivating (SIN) lentiviral vector carrying the MGMTP140K transgene. In this regard, it was of special interest to find out whether chemotherapy might select for CD34+ cells that carry certain integrations (e.g., in or near genes/cancer genes) and thereby skew the lentiviral integration pattern. Despite recovering more initial integration site sequence reads for untreated CD34+ cells (7185 for untreated; 4931 for treated) we saw fewer unique sites, that is, clones, in the untreated group. These findings emphasize (1) the enrichment for transduced cells and (2) the stable polyclonal bulk after BCNU therapy and we therefore suggest that the difference in the sequence reads might be due to a different clonal diversity.
In line with previous reports (Schroder et al., 2002; Wu et al., 2003; Mitchell et al., 2004), we could show that the vector integrates preferentially into genes and, specifically, active genes. In addition, analysis of integrations in and near genes listed in the cancer gene census (Futreal et al., 2004) revealed that both treated and untreated CD34+ cells carried significantly more integrations in cancer genes than expected on the basis of a reference set of random integrations (Appelt et al., 2009). However, because this random set is not corrected for the gene expression levels in CD34+ cells, a possible bias introduced by (relatively) high expression levels of cancer genes at the time of transduction cannot be excluded.
Although we also detected an integration in the proximity of HMGA2, which has been reported to be involved in clonal imbalance observed in a thalassemia gene therapy trial (
In line with this, we also saw that integration frequencies around TSS, CpG islands, SINEs, and LINEs in treated and untreated CD34+ cells showed no significant differences. In addition, we could not calculate any significant difference between the numbers of CIS in both groups. The higher absolute number of CIS identified in the treated group might be explained with the also higher absolute number of all integrations found in this group. Because we found only two CIS that were already identified in other studies, we suggest that the total amount of integrations found in all hitherto performed studies is still too low to locate all possible CIS. It can be expected that future lentiviral integration analyses might deliver more CIS. Thus our integration analysis together with in vivo data from another study (Beard et al., 2009) demonstrates that MGMTP140K gene transfer to CD34+ cells and subsequent BCNU chemotherapy does not select for a subset of CD34+ colonies.
It has been proposed that DNA viruses such as human papillomavirus type 16 (HPV16), HPV18, hepatitis B virus (HBV), Epstein–Barr virus (EBV), adeno-associated virus (AAV) (reviewed in Popescu, 2003), and retroviral vectors such as MLV also integrate preferentially in fragile sites. It has been suggested that open chromatin structures, decondensed chromatin conformations (gaps), and double-strand breaks occur during the cell cycle and therefore facilitate integration (Bester et al., 2006). Yet, in contrast, we and others (Mitchell et al., 2004) have not observed that SIN lentiviral vectors prefer fragile sites.
In addition to “genomic” profiles of the vector-flanking regions, we also established “functional” profiles of these regions by assessing expression levels of genes that were hit or adjacent to the integration site. It is hypothesized that vector-induced deregulation might affect even more distant genes (Kustikova et al., 2005). In this regard, two reports showed that gene therapy vector integration in clonal T lymphocytes is associated with flanking gene deregulation within a 200-kb window around the site of vector integration (Recchia et al., 2006; Cassani et al., 2009). However, the mentioned studies used MLV-based vectors, carrying LTR-driven transgenes (truncated growth factor receptor [LNGFR] or adenosine deaminase [ADA]) and thus it remained questionable whether vector, promoter, or transgene might have played a role in their findings. To at least diminish the influence of the vector, “safer” SIN gene transfer vehicles have been developed in which a promoter element placed in between both LTRs, strong polyadenylation signals in the LTR, and strong internal splice acceptors prevent interaction of the retroviral splice donor with downstream sequences (Emery et al., 2002; Zaiss et al., 2002; Baum et al., 2003). Moreover, it was shown that the implementation of prototypical chromatin insulators, such as cHS4, in gammaretroviral vectors could significantly reduce the rate of their genotoxicity in cell lines and of malignant transformation (Li et al., 2009). Other studies indicate that especially lentiviral (Montini et al., 2009; Zychlinski et al., 2008), rather than retroviral (Modlich et al., 2006, 2008), SIN vectors, as used in our study, have low genotoxic potential and thus might act as safe transfer systems for future preclinical and clinical studies on MGMT-mediated hematoprotection. Nevertheless, findings suggest that the deregulative potential depends more on the level of activity of the internal enhancer/promoter elements than on the vector type used for transduction (Hargrove et al., 2008; Maruggi et al., 2009). In this regard, further investigations demonstrated that physiological promoters (i.e., phosphoglycerate kinase [PGK] or elongation factor [EF]-1α) were seen to be less genotoxic than viral promoters such as cytomegalovirus (CMV) or SFFV (Montini et al., 2009; Zychlinski et al., 2010). However, we show here that the SIN lentiviral vector carrying MGMTP140K did not deregulate any of the tested vector-flanking genes, although transgene expression in CD34+ cells in our study was driven by the strong viral SFFV promoter. Although we saw up to 3.5 vector copies present in certain colonies, repeated LM-PCR detected only one integration site per colony. To date, we know that only about 3% of all detectable integrations are accessible when using a restriction enzyme such as PauI with a CGCG motif as recognition site. In contrast, when using a restriction enzyme such as MseI, with an AATT motif as recognition site, the genomic accessibility of individual integration sites increases up to 50% (Gabriel et al., 2008; and M. Schmidt and C. von Kalle, personal communication). It remains unclear whether there were nondetectable multiple integrated vector copies or whether we detected rates of episomal vectors (Terskikh et al., 2005).
Therefore, we hypothesize that our concept, involving the implementation of this promoter in an SIN lentiviral vector to drive MGMTP140K expression in human CD34+ cells, lacks prerequisites for vector/promoter-induced deregulative events. This, together with our findings regarding unaltered integration site patterns before and after BCNU therapy, suggests that MGMTP140K gene transfer with the SIN lentiviral vector used might be a safe and feasible option for CD34+ cell chemoprotection in future clinical settings. Nevertheless, this application must be further elaborated and evaluated in suitable in vivo models by the transplantation of genetically modified human cells (e.g., NOD/SCIDγc mouse models).
Footnotes
Acknowledgments
The technical assistance of Bernard Berkus, Hans-Jürgen Engel, and Sigrid Heil (G402; DKFZ) is gratefully acknowledged. The authors thank Anne Arens and Stephan Wolf of the Genomics and Proteomics Core Facilities (DKFZ) for doing the 454 pyrosequencing. The authors also thank Blake Hale and Mohammed Abba for editorial advice and helpful discussion. This work was supported by grant FR1732/3-2 from the Deutsche Forschungsgemeinschaft (S.F.), grant 0315-452-C from the Federal Ministry of Education and Research (F.G., S.F., H.A., and S.L.), grants from the Stiftung Krebs- und Scharlachforschung Mannheim (F.G., S.L., and P.M.), the H.W. & J. Hector Foundation (H.A., S.F., S.L., and W.Z.), and Deutsche Krebshilfe (P.M.).
Author Disclosure Statement
The authors declare no competing financial interests.
References
Supplementary Material
Please find the following supplemental material available below.
For Open Access articles published under a Creative Commons License, all supplemental material carries the same license as the article it is associated with.
For non-Open Access articles published, all supplemental material carries a non-exclusive license, and permission requests for re-use of supplemental material or any part of supplemental material shall be sent directly to the copyright owner as specified in the copyright notice associated with the article.