




Abstract
Gene replacement therapy for the neurological deficits caused by lysosomal storage disorders, such as in Niemann-Pick disease type A, will require widespread expression of efficacious levels of acid sphingomyelinase (ASM) in the infant human brain. At present there is no treatment available for this devastating pediatric condition. This is partly because of inherent constraints associated with the efficient delivery of therapeutic agents into the CNS of higher order models. In this study we used an adeno-associated virus type 2 (AAV2) vector encoding human acid sphingomyelinase tagged with a viral hemagglutinin epitope (AAV2-hASM-HA) to transduce highly interconnected CNS regions such as the brainstem and thalamus. On the basis of our data showing global cortical expression of a secreted reporter after thalamic delivery in nonhuman primates (NHPs), we set out to investigate whether such widespread expression could be enhanced after brainstem infusion. To maximize delivery of the therapeutic transgene throughout the CNS, we combined a single brainstem infusion with bilateral thalamic infusions in naive NHPs. We found that enzymatic augmentation in brainstem, thalamic, cortical, as well subcortical areas provided convincing evidence that much of the large NHP brain can be transduced with as few as three injection sites.
Introduction
Because enzyme replacement therapy is effective only in treating peripheral symptoms (Barton et al., 1991), genetic replacement therapy is a critical avenue to explore for the treatment of the CNS component of the disease. In this respect, Niemann-Pick disease type A (NPD-A) is a template for the development of genetic therapies for the neurological manifestations of other LSDs. Various vectors such as adenoviral (Peltola et al., 1998; Ziegler et al., 1999), lentiviral (Bosch et al., 2000; Kim et al., 2004), and adeno-associated viral (AAV) vectors have been used in a number of models of LSD (Barranger and Novelli, 2001; Hsich et al., 2002; Watson and Wolfe, 2003). The efficacy studies most relevant to the present work, however, have been those in which ASM−/− mice received intracerebral injections of an AAV vector encoding human ASM. The first study (Passini et al., 2005) showed that treatment of ASM−/− mice with AAV2-hASM corrected the distended lysosomal pathology, and restored normal cholesterol levels in brain (secondary substrate). Moreover, AAV particles underwent axonal transport to distal areas of the brain, despite the fact that projecting neurons were diseased at the time of injection (i.e., even disease-compromised neurons support transport of AAV). Translation of these initial efficacy data from mice into clinical therapy for human infants, however, requires demonstration of effective gene delivery, transport, and expression in the large nonhuman primate (NHP) brain. The present study, therefore, explored vector delivery methods that maximized distribution into key regions of the NHP brain but minimized the number of injections that would be required. We have shown that infusion of AAV2 into NHP thalamus resulted in widespread expression of a secreted transgene (glial cell line-derived neurotrophic factor, GDNF) throughout the cortex (Kells et al., 2009). This focal delivery of vector exploited known thalamocortical projections to drive broad cortical expression in layers III and IV of the cortex. Here we show that AAV2 can also be infused safely into NHP brainstem and bilaterally into thalamus, such that the ASM transgene product can be detected throughout the CNS.
To achieve the safety and accuracy needed for this type of procedure, we performed infusions by magnetic resonance imaging (MRI)-guided, real-time* convective delivery (RCD) (Fiandaca et al., 2009). In this procedure, the coinfusion of a contrast reagent (Gd) with AAV2 particles provides visual feedback to the surgeon performing the infusion as to cannula placement (Yin et al., 2009) and possible untoward reflux or leakage of infusate (Varenika et al., 2008). This study provides a broad gene augmentation strategy for neurological defects in NPD-A that is also likely to be applicable to other LSDs with neurological symptoms.
Materials and Methods
Nonhuman primate subjects
Four NHPs (cynomolgus) were used in this study and were randomized to a 5-week (n = 2) or 9-week (n = 2) survival group from the time they received their last infusion treatment. No differences in body weight, neurological deficits, or adverse clinical symptoms were observed throughout the study. All procedures were carried out in accordance with the University of California San Francisco (UCSF) Institutional Animal Care and Use Committee. NHPs received either gadoteridol alone (Gd, ProHance; 2 mM) or a mixture of AAV2-hASM-HA and Gd. The timeline for all NHP procedures was as follows: baseline MRI (week 0), administration of implants (2 weeks after baseline MRI), Gd-only infusion (2 weeks after implants), Gd plus AAV2-hASM-HA (7 weeks after the Gd-only infusion), and NHP perfusion (5 or 9 weeks after the last AAV infusion).
Adeno-associated viral vector construction
An AAV shuttle plasmid encoding human acidic sphingomyelinase (hASM) (Passini et al., 2005) was modified by inclusion of a sequence at the 3′ end of the ASM cDNA that generated a C-terminal synthetic hemagglutinin epitope derived from viral hemagglutinin in order to facilitate immunodetection of transgene expression in the NHP brain. This shuttle plasmid was then used to manufacture AAV2-hASM-HA (1.0 × 10¹² vector genomes [VG]/ml) at the Vector Core at Children's Hospital of Philadelphia (Philadelphia, PA) (Matsushita et al., 1998).
AAV2-hASM-HA infusion
All NHPs underwent a baseline MRI before surgery to visualize anatomical landmarks and to generate stereotactic coordinates of the proposed infusion target sites. NHPs underwent stereotactic placement of the MRI-compatible plastic cannula guide array (12 mm diameter × 14 mm height, containing 27 access holes) for convection-enhanced delivery (CED) into the brainstem and thalamus. Each cannula guide array was secured to the skull with plastic screws and dental acrylic. After placement of the array, animals recovered for at least 2 weeks before initiation of infusion procedures. On the day of infusion, animals were anesthetized with isoflurane (Aerrane; Ohmeda Pharmaceutical Products Division, Liberty Corner, NJ). Each animal's head was then placed in an MRI-compatible stereotactic frame, and a baseline MRI was performed. The selection of cannula tract/access port for each infusion was based on the best trajectory to the targeted region that avoided damage to the lateral ventricles such that the 3-mm step rested in the middle of the targeted region, determined from the MR images (T2-MRI and MP-RAGE [magnetization
Magnetic resonance imaging
NHPs were sedated with a mixture of ketamine (Ketaset, 7 mg/kg, intramuscular) and xylazine (Rompun, 3 mg/kg, intramuscular). After sedation, each animal was placed in a MRI-compatible stereotactic frame. The ear-bar and eye-bar measurements were recorded, and an intravenous line was established. MRI data were then obtained, after which animals were allowed to recover under close observation until able to right themselves in their home cages. MR images for CED infusions delivering Gd alone (total of four) were acquired on a 1.5-T MAGNETOM Avanto (Siemens, Munich, Germany). Three-dimensional (3D) MP-RAGE images were obtained with repetition time (TR) = 2110 msec, echo time (TE) = 3.6 msec, and a flip angle of 15°, number of excitations (NEX) = 1 (repeated three times), matrix = 240 × 240, field of view (FOV) = 240 × 240 × 240 mm, and slice thickness = 1 mm. These parameters resulted in a 1-mm3 voxel volume. The scanning time was approximately 9 min.
MR images for CED infusions delivering AAV2-hASM-HA/Gd (total of 12) were acquired on a 1.5-T Signa LX scanner (GE Medical Systems, Waukesha, WI) with a 5-inch surface coil on the subject's head, parallel to the floor. SPGR (spoiled gradient recalled) images were T1-weighted and obtained with a spoiled GRASS (gradient recalled acquisition in steady state) sequence, a TR = 2170 msec, a TE = 3.8 msec, and a flip angle of 15°, NEX = 4, matrix = 256 × 192, FOV = 16 cm × 12 cm, and slice thickness = 1 mm. These parameters resulted in a 0.391-mm3 voxel volume. Scanning time was approximately 11 min.
Tissue processing
NHPs were transcardially perfused with PBS followed by 4% paraformaldehyde (PFA) in PBS. Their brains were harvested and sliced coronally into 6-mm blocks that were postfixed in 4% PFA–PBS and cryoprotected in 30% (w/v) sucrose. A sliding microtome (HM 450; Thermo Scientific, Waltham, MA) was used to cut blocks into 40-μm-thick serial sections that were then processed for histology.
Immunoperoxidase staining
A monoclonal antibody against the hemagglutinin (HA) tag (mouse anti-HA, diluted 1:10,000, clone 16B12; Covance, Princeton, NJ) or ASM (mouse anti-ASM-biotinylated, diluted 1:100; Genzyme, Framingham, MA) was used to detect expression of the human transgene. Briefly, sections were washed with PBS (three times, 5 min each) and were quenched for endogenous peroxidase activity in 1% H2O2 in PBS (20 min), and then washed again in PBS as described previously. Sections were blocked for 30 min in Background Sniper (BS966G; Biocare Medical, Concord, CA) and incubated overnight with the HA and/or ASM primary antibody or with anti-biotin-M antibody (mouse, diluted 1:200, MB-9100; Vector Laboratories, Burlingame, CA) in Da Vinci green diluent (PD900; Biocare Medical). The next day, after washing sections in PBS, sections were incubated in MACH 2 mouse HRP polymer (MHRP520; Biocare Medical) for 1 hr, washed in PBS, and developed with 3,3′-diaminobenzidine (DAB) for 6 min (DAB peroxidase substrate kit, SK-4100; Vector Laboratories). DAB-processed sections were washed in PBS, mounted on frosted slides, and counterstained with cresyl violet.
Immunofluorescence staining
Brain sections were immunostained with anti-HA (mouse monoclonal, diluted 1:200; Covance) and either anti-Iba1 (rabbit polyclonal, diluted 1:100, Biocare Medical) or anti-NeuN (mouse, monoclonal, diluted 1:500; Millipore). Alternatively, anti-HA was used in combination with anti-S100 protein (rabbit polyclonal, diluted 1:100; Biocare Medical). Sections were washed with PBS containing 0.1% Tween 20 (PBST; three times for 5 min each), endogenous peroxidase activity was quenched in 1% H2O2 in 50% ethanol (30 min), and the sections were washed again in PBST as described previously. Sections were blocked for 60 min in 20% normal horse serum (NHS; Jackson ImmunoResearch, West Grove, PA) and incubated for at least 24 hr at 4°C with each of the primary antibody cocktails in Da Vinci green diluent (PD900; Biocare Medical). After incubation with primary antibodies, sections were washed in PBST, incubated with a cocktail of secondary antibodies (fluorescein isothiocyanate [FITC]-conjugated anti-mouse [diluted 1:200] and tetramethylrhodamine isothiocyanate [TRITC]-conjugated anti-rabbit [diluted 1:200]; Jackson ImmunoResearch) in PBST for 1 hr at room temperature, washed in PBST, and wet-mounted on frosted slides. These sections were coverslipped with a 4′,6-diamidino-2-phenylindole
Ratio of volume of distribution to volume infused
The volume of distribution (V d) for each brainstem and thalamic infusion was measured with OsiriX software for the analysis of DICOM images (version 3.6). Briefly, regions of interest (ROIs), defined as the areas of visualized Gd signal on each DICOM, were manually delineated with the ROI tool. Ratios were calculated by taking the volume of the resulting 3D reconstruction of the combined infusate (either Gd only or AAV-hASM-HA/Gd) distribution (V d) and dividing it by the volume infused (V i). To compare V d:V i ratios for repeated infusions, V d was measured on DICOM series at equivalent V i. Note that MRI sequences necessary to quantify tissue concentration as a means to calculate V d were not acquired. However, the sensitivity of this Gd detection, based on the available images, was sufficient to calculate accurate ROIs manually.
Area of HA immunostaining transferred to MR images
The transference of HA-positive areas was conducted first by scanning (Epson 1660 photo scanner at 300 dpi) all histology-processed slides counterstained with cresyl violet. Bright-field microscopy sections were used to delineate manually the extent and boundary of immunoreactivity per infused region. The resulting outlines were then copied to a transparency paper, individually matched to the corresponding baseline MR images, and drawn with the Osirix ROI tool. In one instance (NHP1260), MR imaging showed good tracer distribution in the right thalamus, but no transgene expression was detected by immunohistochemistry. It is not clear why this thalamic infusion did not transduce any neurons, but we suspect it might be due to vector aggregation during the procedure (Wright et al., 2003). Nevertheless, in the absence of transgene expression, no analysis was possible and results from the specific thalamic infusion were not included in the study.
Percentage of HA-positive neuronal transduction
In adjacent serial sections (thickness, 40 μm), immunostaining for neuronal marker (anti-NeuN) or HA tag (anti-HA) was performed, and randomized × 20 magnification images (698 × 522 μm) were taken per targeted region (two images per infusion site) across all NHPs (n = 4). In these images, neuronal cell bodies stained for NeuN and HA were manually counted, and their number was tabulated and analyzed collectively per region infused (i.e., thalamus and brainstem). Comparison between NeuN- and HA-stained cell bodies was expressed as the percentage of neurons positive for the HA tag per infused region.
Statistical analysis
The distribution of Gd alone and of AAV2-hASM-HA/Gd were compared by Student t test and Pearson's correlation. Results were considered statistically significant when p < 0.05.
Results
Real-time MR imaging of CED
The outcome of intraoperative MR imaging of cannula placement and monitoring of CED is illustrated in Fig. 1, where the placement of the cannula tip into predetermined brainstem or thalamic structures could be observed with infusion of MRI contrast reagent in all cases (Fig. 1A and B). Unilateral infusions in the brainstem and bilateral infusions in the thalamus were performed simultaneously (Fig. 1A and B, white arrows). Consistent with previous observations from our laboratory, we found radial convection of delivered infusate with no signs of untoward leakage or reflux (Varenika et al., 2008).

Intraoperative use of real-time convection-enhanced delivery (CED) in the nonhuman primate (NHP) brainstem and thalamus. Infusion of AAV2-hASM-HA/Gd visualized as a contrast demarcation on MRI indicates cannula tip placement in the targeted region (
Volume infused versus volume of distribution
A direct linear relationship was found between V d and V i for brainstem and thalamic infusions (R 2 = 0.93; Fig. 2) as previously described for liposomal infusions (Yin et al., 2010). The mean V d:V i ratio for brainstem (n = 6) was 3.3 ± 0.17 and for thalamus (n = 10) it was 3.86 ± 0.25; the ratios were not significantly different from each other (p = 0.14). More importantly, we demonstrated that repeated infusions of the MRI tracer into the same anatomical regions resulted in consistent infusate distribution (Fig. 3). We observed similar distribution patterns and V d:V i ratios in brainstem and thalamic infusions, with no statistically significance difference between primary and secondary deliveries (p = 0.96). Note that, because of the size and volume of the brainstem relative to thalamus, greater volumes were infused into the brainstem region compared with thalamus, with no apparent adverse effects.

Coinfusion of AAV2-hASM-HA and gadoteridol (Gd) into the brainstem (open circles) and thalamus (solid circles). Shown are the results of single delivery of various amounts of infusate into the brainstem (open circles, n = 6; mean V i:V d ratio, 3.3 ± 0.17) and thalamus (solid circles, n = 10; mean V i:V d ratio, 3.86 ± 0.25). There is a linear relationship between V d and V i (overall, n = 16, R 2 = 0.93), with higher V i delivered to the brainstem region as compared with the thalamus. No significant difference was found between ratios in these two regions (p > 0.05).

Comparison of V d:V i ratios with repeated brainstem and thalamic infusions. Initial V d:V i delivery parameters during Gd-only infusions (solid squares, n = 5; mean V d:V i ratio, 3.74 ± 0.25; R 2 = 0.96) were replicated in later infusions consisting of AAV2-hASM-HA/Gd (open squares, n = 5; mean V d:V i ratio, 3.72 ± 0.24; R 2 = 0.98). Note the consistent distribution patterns in consecutive infusions with or without therapeutic agent (overall, n = 10, R 2 = 0.96). No significant difference was found between primary and secondary infusions (p > 0.05).
AAV transduction and distribution
Robust levels of transduction were achieved in the brainstem and thalamus after targeted infusions into these regions (Fig. 4). These images show the transduction of cells resembling neurons or with neuron-like morphology. CED delivery into the thalamus resulted in direct transduction and global distribution of this transgene to cortical regions not directly targeted by the infusion (Table 1). This was indicated by the detection of HA-positive cells dispersed throughout many cortical regions.
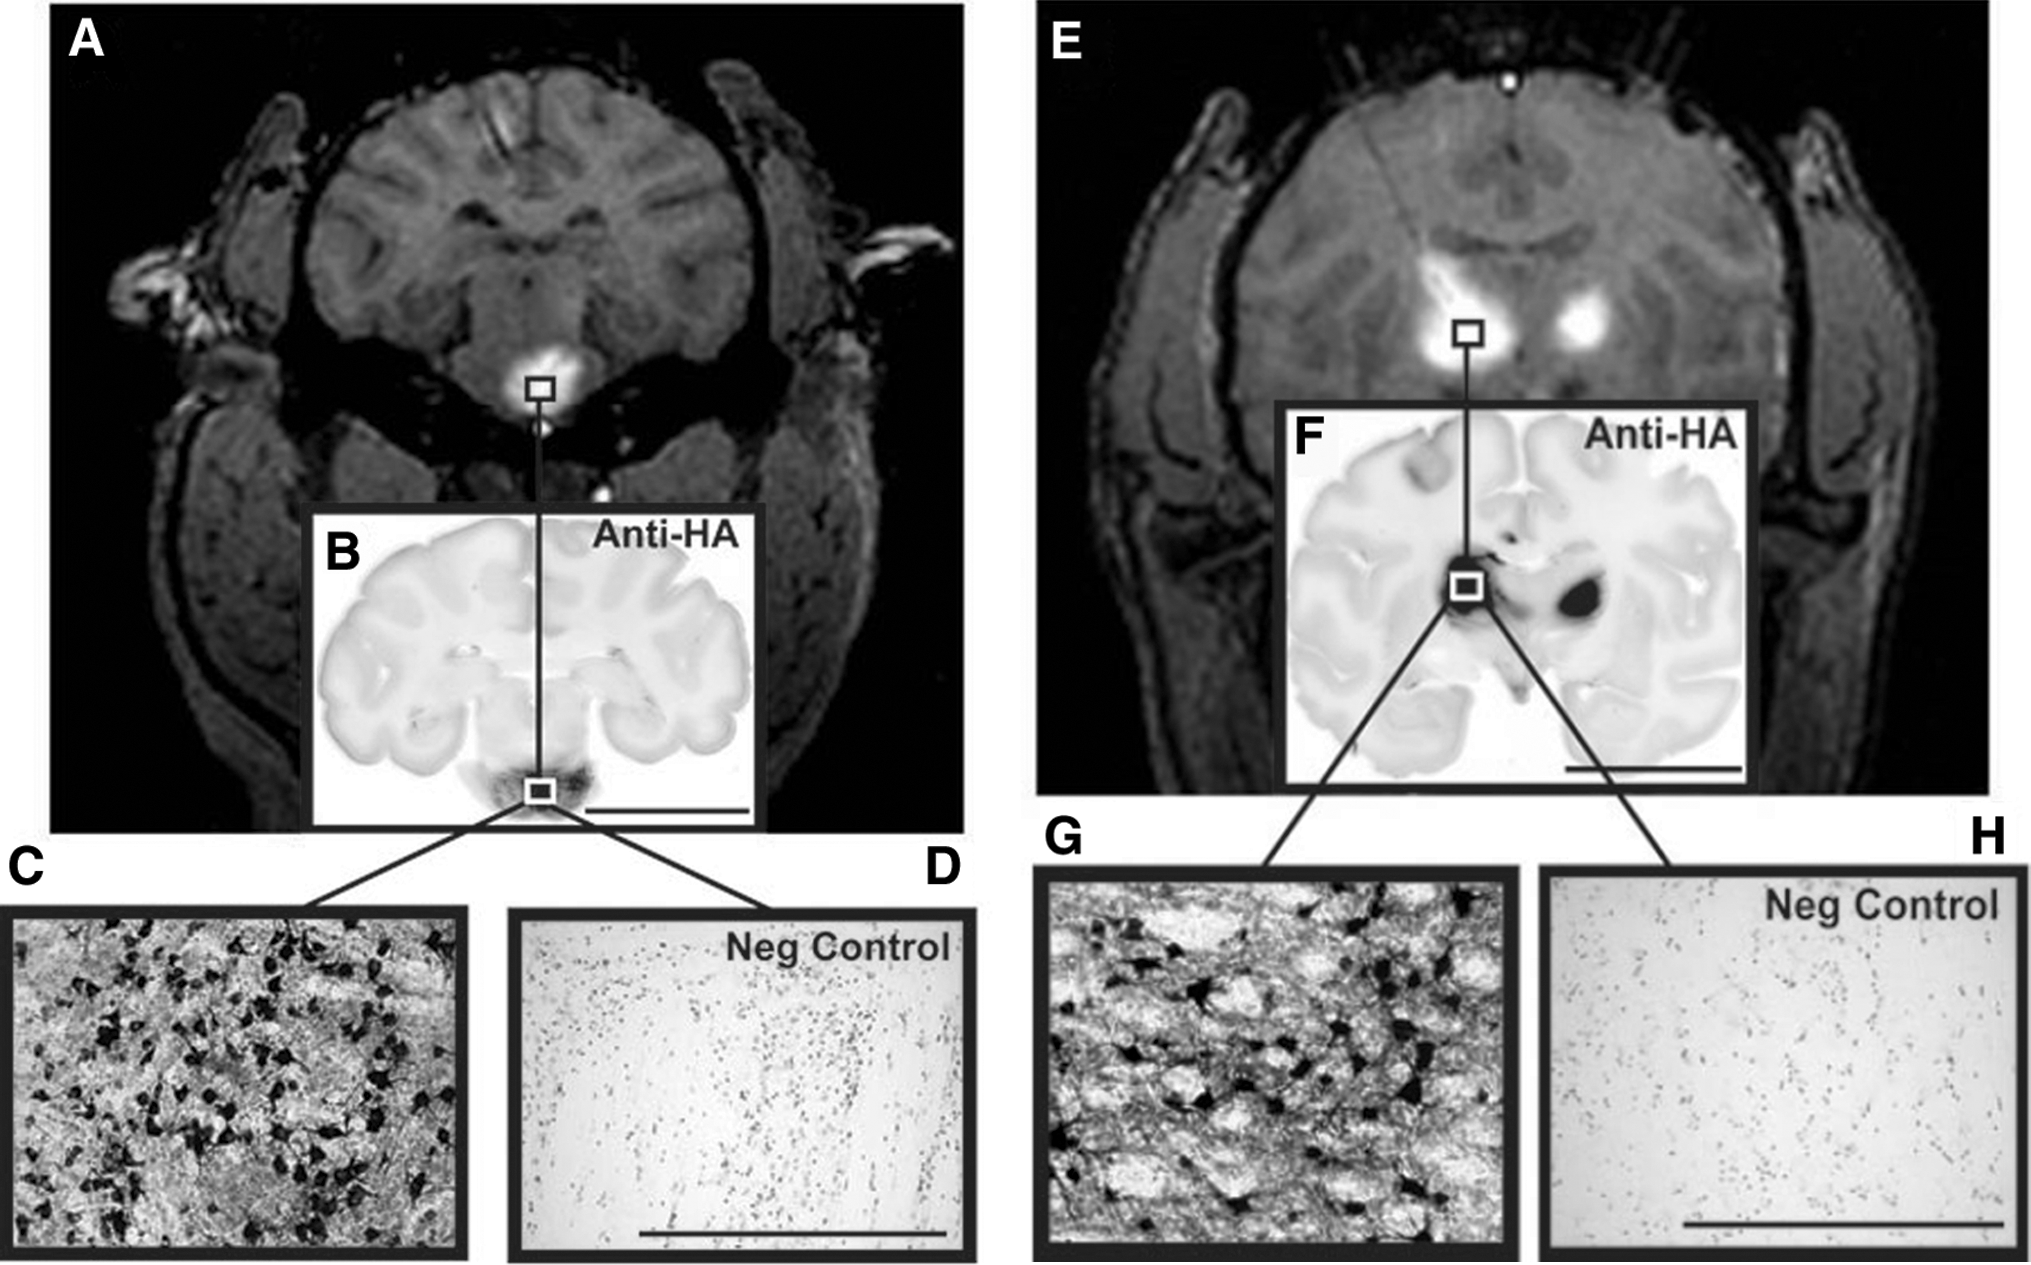
AAV infusion and transduction in brainstem and thalamus. Shown are DICOM MR images representative of brainstem and thalamic infusion (
Abbreviations: L, left; NHP, nonhuman primate; R, right.
Distribution of transduction: +++, ≥ 50 positive cells; ++, 10–49 positive cells; +, ≤9 positive cells; —, no transduced cells.
Efficiency of transgene expression
Another important factor in the establishment of a successful infusion protocol is the correlation between the distribution of MRI tracer and the resulting area of transgene expression (Fig. 5; Table 2). Counting of neuronal cell bodies, immunostained with the neuronal marker (anti-NeuN) or HA epitope tag (anti-HA), revealed that up to 82 ± 7.8% of neurons were positive for HA in the brainstem, and 68 ± 11.3% of neurons were positive in the thalamus. Comparison of the area of transgene expression and that of Gd distribution for brainstem infusions revealed that, in the brainstem, the expression area slightly exceeded the area of MR tracer distribution (117 ± 7.2%), but in the thalamus the corresponding overlap was only 82 ± 8.4%. Closer examination of transduced regions indicated that the vector specifically transduced neurons (Fig. 6A–C) with no cellular transduction detected in astrocytes (Fig. 6D–F) or microglia (Fig. 6G–I), in agreement with previous demonstrations of the neuronal specificity of AAV2 (Daadi et al., 2006; Cunningham et al., 2008). A modest increase in microglial activation was apparent in directly infused regions (Fig. 6G–I); however, this was confined to the immediately infused area, with no significant immune activation detected in cortical regions (data not shown).
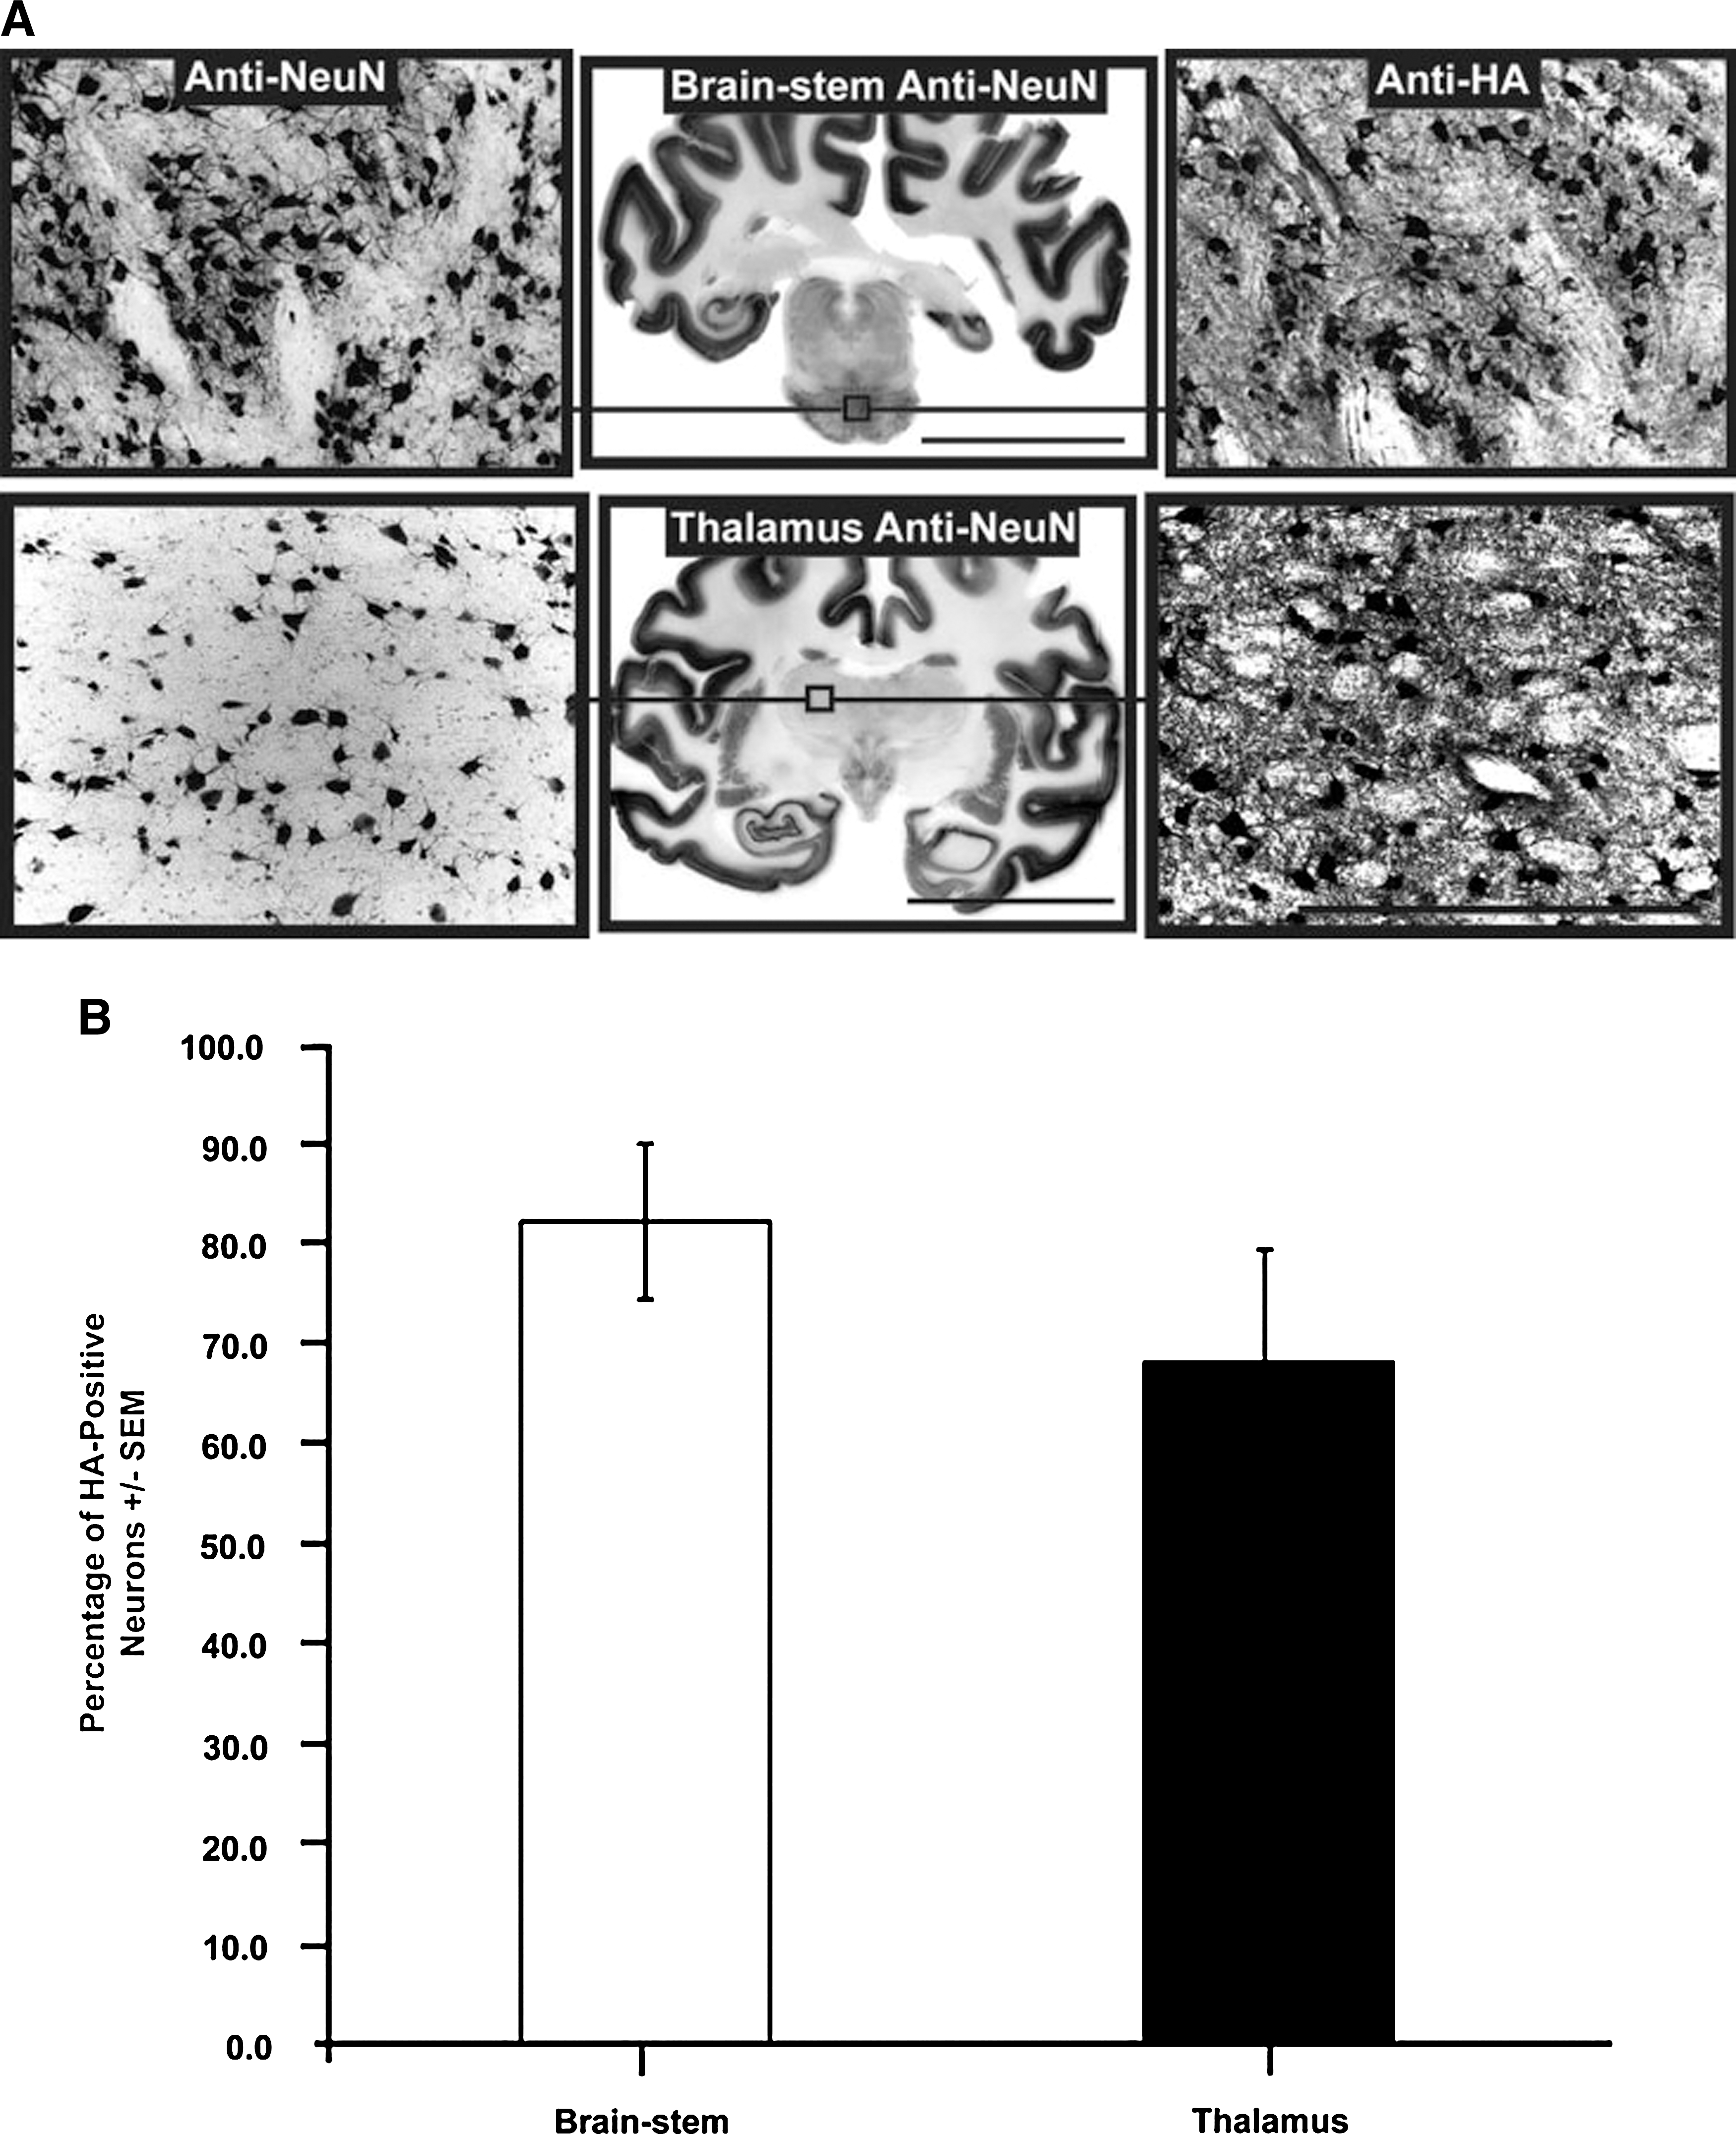
High neuronal transduction numbers in targeted regions. (
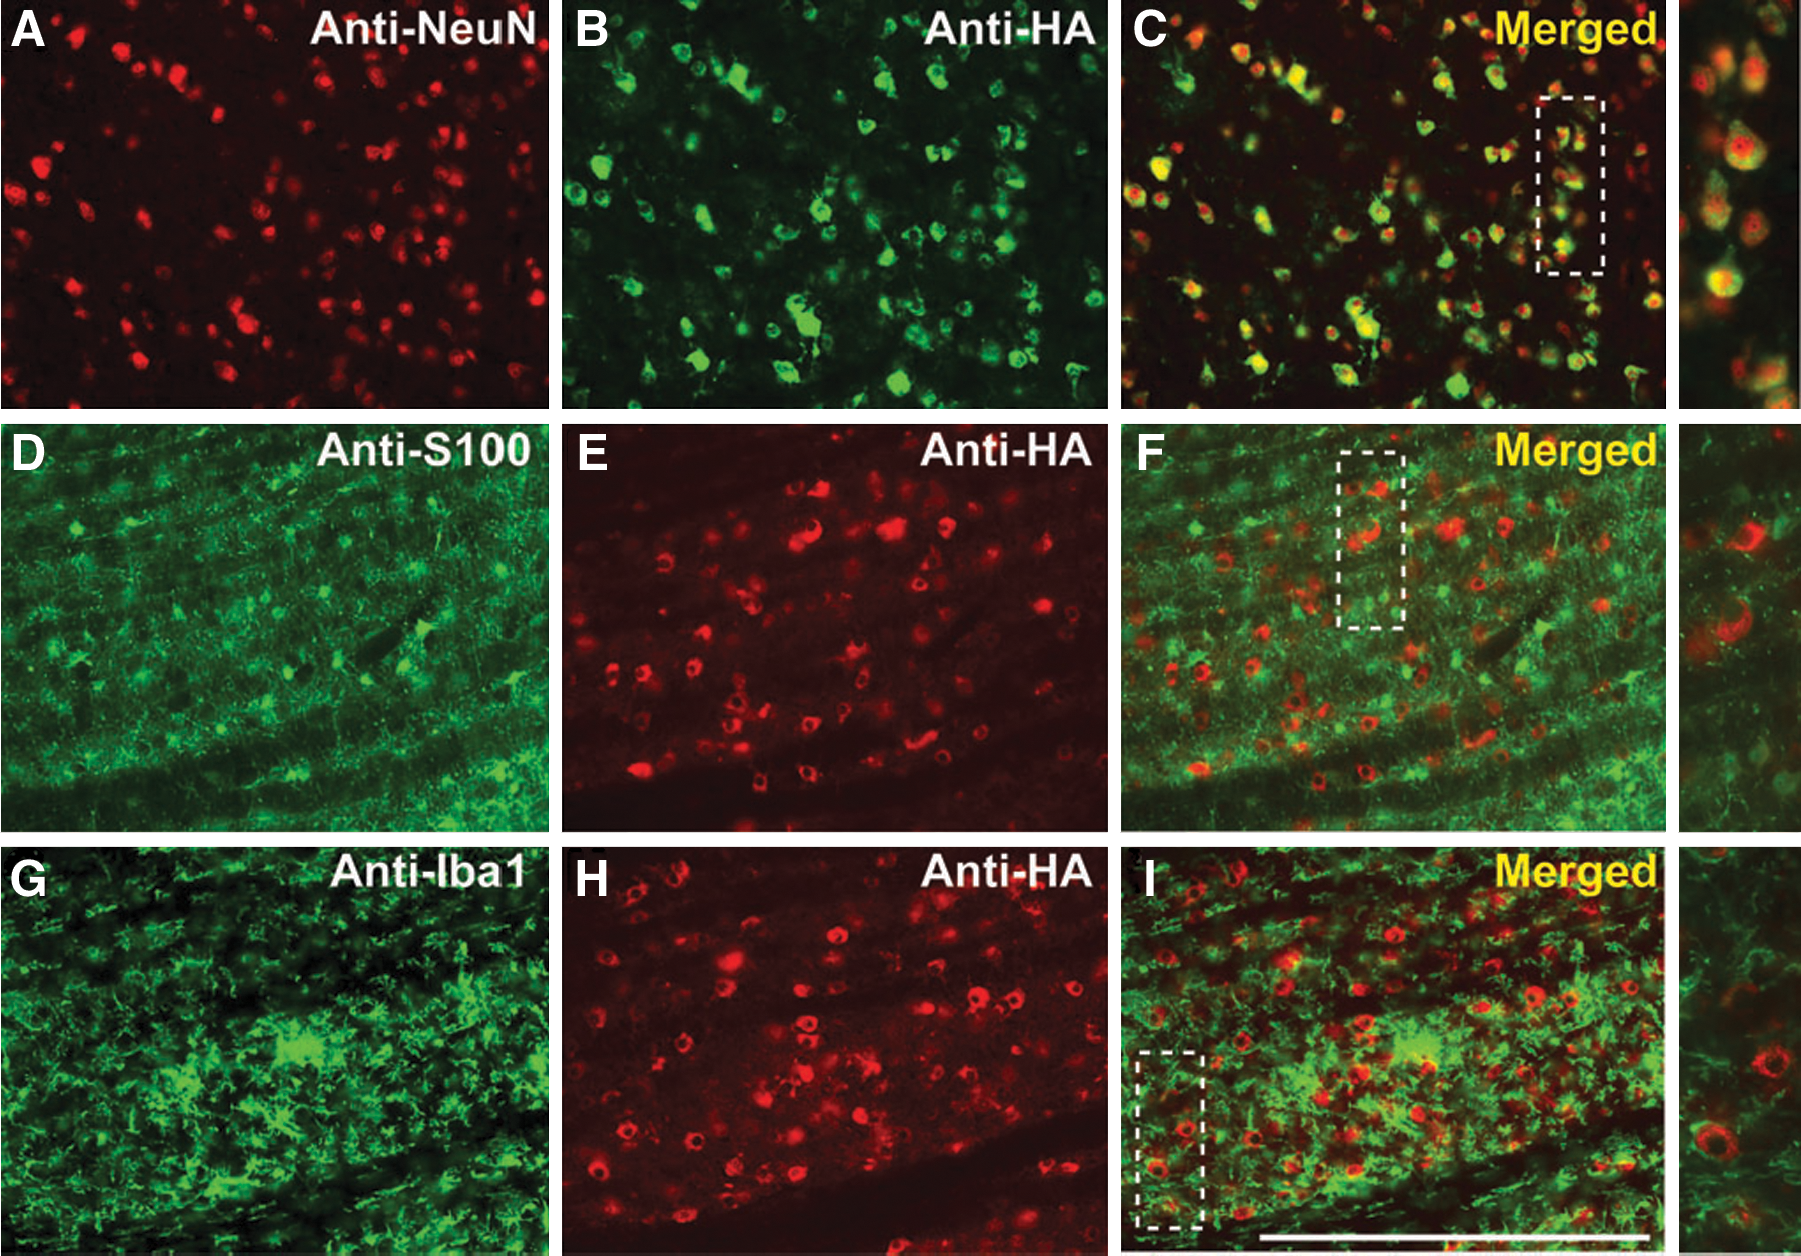
Efficient neuronal transduction in brainstem. Immunostained brainstem sections indicate neuron-specific transduction (
Abbreviations: Gd, gadoteridol; L, left; NHP, nonhuman primate; R, right.
Comparison of HA tag and hASM expression
We anticipated that an HA epitope tag might be required in order to distinguish expressed hASM from endogenous NHP ASM. However, we found that anti-HA and anti-hASM staining were superimposable with no evident staining of endogenous ASM (see Supplementary Fig. 7 at
Discussion
We have shown for the first time that AAV2 carrying the human ASM cDNA can be delivered safely into the NHP brainstem and thalamus with no apparent adverse effects. Moreover, we have demonstrated widespread distribution of gene expression throughout the large NHP brain with as few as three infusions via CED into brain regions clinically relevant to patients with NPD-A. In contrast, a gene therapy protocol for Canavan disease proposed that an AAV2 vector encoding aspartoacylase (ASPA) cDNA be injected into six sites bilaterally in the frontal, parietal, and occipital regions, delivering up to 150 μl/site (Janson et al., 2002). Similarly, another protocol for AAV2-based gene therapy of late infantile neuronal ceroid lipofuscinosis (LINCL) proposed delivery into 12 target sites per brain (Crystal et al., 2004). In our procedure, broad transgene expression in the brain seems to be possible with as few as three infusion sites, thereby reducing the invasiveness of the procedure and consequently reducing risk to these fragile pediatric patients.
RCD of AAV2-hASM-HA resulted in robust transduction in directly targeted regions with the therapeutic transgene, with 82% of neurons in the brainstem and 68% in the thalamus positive for HA. Expression was also found in areas distal to the infusion site. This is an important finding given that gene transport to distal locations in the CNS has been shown to have significant effects in the pathological correction of NPD in ASM−/− mice (Passini et al., 2005) and has clinical implications for NPD-A.
The use of imaging to visualize cannula placement, as well as the distribution and monitoring of drug delivery, maximizes procedure efficacy and provides accurate targeting of the clinically relevant CNS anatomy (Fig. 1). RCD provides neurosurgeons with an added level of control and knowledge that the therapeutic agent has not been incorrectly delivered into a cerebrospinal fluid (CSF) compartment or undesired brain regions (Yin et al., 2009). In addition, data showing significant reproducibility (R 2 = 0.96) of V d:V i ratios after repeated, targeted infusions into the same anatomical regions (Fig. 3) suggest that CED does not disturb the maintenance of normal tissue function and the movement of virions through the CNS parenchyma. This safety aspect is especially relevant for delivery into the immature nervous system of children with NPD-A.
Analysis of infusate delivery revealed a linear correlation between V d and V i (R 2 = 0.93) for CED procedures combining Gd only and AAV/Gd infusions (Fig. 2). This result accorded with findings from previous experiments describing the safety of CED with Gd-loaded liposomes (Krauze et al., 2008), and is consistent with other observations from brainstem CED infusions in rodents, where linear increases in V d proportional to increases in V i were described (Sandberg et al., 2002). We found volumetric dimensions of the brainstem to be extremely accommodating to delivery volumes up to 200 μl, with no apparent adverse effects. Fluctuation in this V d:V i linearity correlate with failure of infusate distribution as demonstrated previously by us in NHPs (Varenika et al., 2008) and in a clinical brainstem infusion case, where nonlinearity was caused by leakage into the surrounding ventricular space (Lonser et al., 2007). Along with infusate leakage (Varenika et al., 2009), other factors such as infusion rate and cannula size have been shown to affect the efficacy of CED (Chen et al., 1999). It should also be noted that V d:V i ratios are also affected by the composition of various anatomical regions, perhaps dependent on whether these regions are structurally composed of mainly gray or white matter (Szerlip et al., 2007).
Targeted CED delivery to the brainstem and thalamus with the HA-tagged vector resulted in the global distribution of the human transgene. This result was verified by immunohistochemical techniques staining for either the HA tag epitope or the human transgene, demonstrating colocalized immunoreactivity and similar distribution patterns for both markers (Supplementary Fig. 7). The data resolved prior concerns, namely adequate detection and discrimination between the human transgene and endogenous monkey ASM. The fact that the HA tag did not engender a strong cell-mediated immune response is in line with previous observations that transduction of non-antigen-presenting cells such as neurons by AAV2 does not elicit a cell-mediated immune response, in contrast to vectors such as AAV1 that evince a broader tropism (Hadaczek et al., 2009). The exact mechanism by which vector particles move within the CNS parenchyma has not been fully elucidated (Cearly and Wolfe, 2007). However, it is possible that transsynaptic transport might be contributing to the widespread distribution of AAV2-hASM-HA. In addition, previous observations from our laboratory have also speculated on alternative routes for gene trafficking, such as alongside axonal projections (Kells et al., 2009) and through the perivascular space (Hadaczek et al., 2006). It is also possible that highly interconnected projections of transfected neurons might secrete ASM to neighboring neurons, thus contributing to the spread of therapeutic agent to other regions not detectable by the immunohistochemical technique employed in this study. In agreement with this idea, correction of CNS pathology in ASM knockout mice occurred in distal regions where ASM expression was not detected (Passini et al., 2005).
Targeting of brain regions containing numerous reciprocal connections such as the thalamus contributes greatly to the distribution of therapeutic agents throughout the brain (Kells et al., 2009). In fact, HA-positive neurons, indirectly indicative of AAV2 transduction, were found both in subcortical regions directly targeted by CED (Fig. 4) and in related cortical regions extending as far as the prefrontal cortex. Cortical distribution of this lysosomal enzyme was found in several clinically relevant areas such as the primary and secondary motor cortex, somatosensory cortex, and Broca's area (Table 1). We believe that the prominent gene transfer shown here sets the foundation for ASM gene replacement in the human CNS, an eminently achievable goal in that ASM−/− mice required only a slight increase of approximately 11–18% in enzyme activity to dramatically preserve normal CNS function (Marathe et al., 2000).
RCD offers a high level of predictability in gene expression (Fig. 5; Table 2). We have reported similar findings with other transgenes delivered into NHP putamen (Fiandaca et al., 2008b; Fiandaca et al., 2009). In the brainstem, infusions of AAV2-hASM-HA resulted in a 17% greater area of transduction than was predicted by MRI. In contrast, thalamic infusions gave transduction areas equal to only 82% of that predicted by MRI. It is not clear why this is so, but previously we found that the V d:V i ratio of liposomes was greater in white matter than in regions of predominantly gray matter, such as putamen (Krauze et al., 2005). It is also important to consider that transduction patterns with any type of parenchymal CNS delivery may vary when different AAV serotypes and transgenes are employed (Hadaczek et al., 2009).
Clinically, AAV2 has been regarded as the vector of choice for CNS gene delivery for several reasons, including its relatively widespread use in neurological gene therapy in Parkinson's disease (Kaplitt et al., 2007; Eberling et al., 2008; Marks et al., 2008; Christine et al., 2009), its tropism for neurons (Bartlett et al., 1998), and long-term CNS expression after delivery (Bankiewicz et al., 2006; Daadi et al., 2006). Consistent with previous observations, we have also demonstrated high efficiency and cellular tropism of AAV2 for neurons after CED, with no astrogliosis (Fig. 6) or systemic immune response within the CNS (data not shown). The use of AAV2 encoding human ASM has been described in several experiments, all of which have repeatedly reported the successful pathological correction of the pathology associated with low ASM activity in ASM−/− mice (Barbon et al., 2005; Dodge et al., 2005; Passini et al., 2005, 2007).
We have safely delivered AAV2 particles to highly vascularized regions with no evidence of hemorrhage or significant tissue disruption. This study provides the foundation for translation of AAV2-hASM into clinical study, through the use of large animal models that facilitate the assessment of likely tropism, biodistribution, and persistence of gene therapy vectors in human clinical trials (Fiandaca et al., 2008a). The fact that the movement of AAV is influenced by region-specific connectivity is an opportunity that needs to be explored further. The use of MRI-based CED of AAV2-hASM is a novel treatment approach that may eventually provide significant neurological improvement to patients with NPD-A.
Footnotes
Acknowledgments
This study was supported by a grant to K.S.B. from NIH-NINDS (R01 NS056107-01).
Author Disclosure Statement
No competing financial interests exist.
*
In practice, acquisition of the MRI image lags the infusion by 6–12 min.
References
Supplementary Material
Please find the following supplemental material available below.
For Open Access articles published under a Creative Commons License, all supplemental material carries the same license as the article it is associated with.
For non-Open Access articles published, all supplemental material carries a non-exclusive license, and permission requests for re-use of supplemental material or any part of supplemental material shall be sent directly to the copyright owner as specified in the copyright notice associated with the article.
