
Abstract
Vector integration can lead to proto-oncogene activation and malignancies during hematopoietic stem cell gene therapy. We previously used foamy virus vectors to deliver the CD18 gene under the control of an internal murine stem cell virus promoter and successfully treated dogs with canine leukocyte adhesion deficiency. Here we have tracked the copy numbers of 11 specific proviruses found in these animals for 36–42 months after transplantation, including examples within or near proto-oncogenes, tumor suppressor genes, and genes unrelated to cancer. We found no evidence for clonal expansion of any of the clones, including those with proviruses in the MECOM gene (MDS1-EVI1 complex). These results suggest that although foamy virus vectors may integrate near proto-oncogenes, this does not necessarily lead to clonal expansion and malignancies. Additionally, we show that copy number estimates of these specific proviruses based on linker-mediated PCR results are different from those obtained by quantitative PCR, but can provide a qualitative assessment of provirus levels.
Introduction
Foamy virus (FV) vectors are an alternative retroviral vector system that efficiently transduces HSCs from mice, dogs, and humans (Vassilopoulos et al., 2001; Josephson et al., 2002, 2004; Leurs et al., 2003; Kiem et al., 2007; Trobridge et al., 2009). FV vectors may be less genotoxic than gammaretroviral or LV vectors, because they do not preferentially integrate within transcription units or actively transcribed genes (Trobridge et al., 2006), and they have reduced potential to activate neighboring genes due to a lack of read-through transcription and enhancer activity from the partially deleted LTRs (Hendrie et al., 2008). We previously used FV vectors to express the canine leukocyte integrin gene CD18 (also known as ITGB2) from an internal murine stem cell virus (MSCV) promoter (Hawley et al., 1994) and treat dogs with canine leukocyte adhesion deficiency (CLAD) by HSC gene therapy (Bauer et al., 2008). This produced long-term leukocyte marking rates of 5–10% based on CD18 expression, and the animals no longer suffered from the recurrent infections characteristic of CLAD. We determined the chromosomal locations of over 800 vector proviruses isolated from the blood cells of four treated dogs, and 26 were present within 30 kb of known cellular proto-oncogenes (Bauer et al., 2008). This was less than that observed in CLAD dogs treated with gammaretroviral vectors (Hai et al., 2008), and not significantly different from the number expected for random integration, arguing against a genotoxic effect of FV vector integration. Still, because the FV vector contained an internal MSCV promoter with strong enhancer activity that could potentially activate nearby proto-oncogenes, these particular clones might preferentially expand over time. Here we have measured the copy numbers of 11 clones containing specific FV proviruses to determine if vector-induced clonal expansion occurred.
Materials and Methods
Cell samples were obtained from transplanted dogs, and their genomic DNAs were purified from peripheral blood leukocytes, lymphocytes, and neutrophils as described (Bauer et al., 2008). Quantitative PCR (qPCR) was performed using a StepOnePlus Real-Time PCR System (Applied Biosystems, Carlsbad, CA) using the manufacturer's recommended conditions. Each integrant-specific qPCR reaction used 200 ng of genomic DNA, an LTR-specific primer, a unique flanking genomic DNA primer for each specific junction, and a vector-specific probe (Table 1), with 45 cycles of PCR (95°C for 15 sec, 60°C for 60 sec). Copy numbers were determined by using a different set of standards for each provirus, made by diluting a plasmid containing the specific junction fragment sequence to be amplified, similar to what has been done previously (Nagy et al., 2004; Bozorgmehr et al., 2007). Each set of standards included reactions with 0, 1, 10, 100, 1,000, and 10,000 copies of the standard plasmid (corresponding to 0, 2.6 × 10⁻⁵, 2.6 × 10⁻⁴, 2.6 × 10⁻³, 2.6 × 10⁻², and 2.6 × 10⁻¹ copies/cell, respectively) that showed a correlation coefficient of over 0.97 when plotted against PCR cycles. The copy number was corrected for DNA quality based on the copy number obtained when amplifying the chromosomal B2M gene on dog chromosome 30 using primers 5’-GCACTGTGTCACTATGCTTGACCTA and 5’-AGCTTCCAGCCCCACAACTA, with probe 5’-CTGGGCCAGTAGCT.
For linker-mediated PCR (LM-PCR), 500 ng of genomic DNA from FV vector-treated dogs was digested with MseI and PstI in 10 μl, and the fragments were ligated to an MseI linker (5’-GTAATACGACTCACTATAGGGCTCCGCTTAAGGGAC and 5’-PO4-TAGTCCCTTAAGCGGAG). One microliter of linker-ligated genomic DNA (7.5% of the total sample, representing 37 ng of DNA) was used in each PCR reaction with a linker-specific primer (5’-GTAATACGACTCACTATAGGGC), an FV LTR-specific primer (5’-GTCTATGAGGAGCAGGAGTA), and Platinum Taq Polymerase (Invitrogen, Carlsbad, CA) in a 50-μl volume (95°C for 2 min, then 25 cycles of 95°C for 15 sec, 55°C for 30 sec, 72°C for 60 sec). Nested PCR was performed using 1 μl (2%) of the first PCR product as template, with a linker-specific nested primer (5’-AGGGCTCCGCTTAAGGGAC) and an FV LTR-specific nested primer (5’-CCTCCTTCCCTGTAATACTC) in a 50-μl volume under the same conditions. One microliter (2%) of these nested PCR products was then cloned into the pCR4-TOPO cloning vector and transformed into TOP10-competent cells by using the TOPO TA Cloning Kit for Sequencing (Invitrogen). Gel electrophoresis was also performed on these samples to assess the diversity of junctions that were amplified (see Fig. 3B). Sequencing of cloned junctions was performed by using the M13 Reverse primer (5’-CAGGAAACAGCTATGAC) that reads into the FV LTR and flanking genomic DNA sequences. Integration sites were determined for each cloned LM-PCR product when the sequence read included LTR sequence, canine genomic sequence, and linker sequence.
Results and Discussion
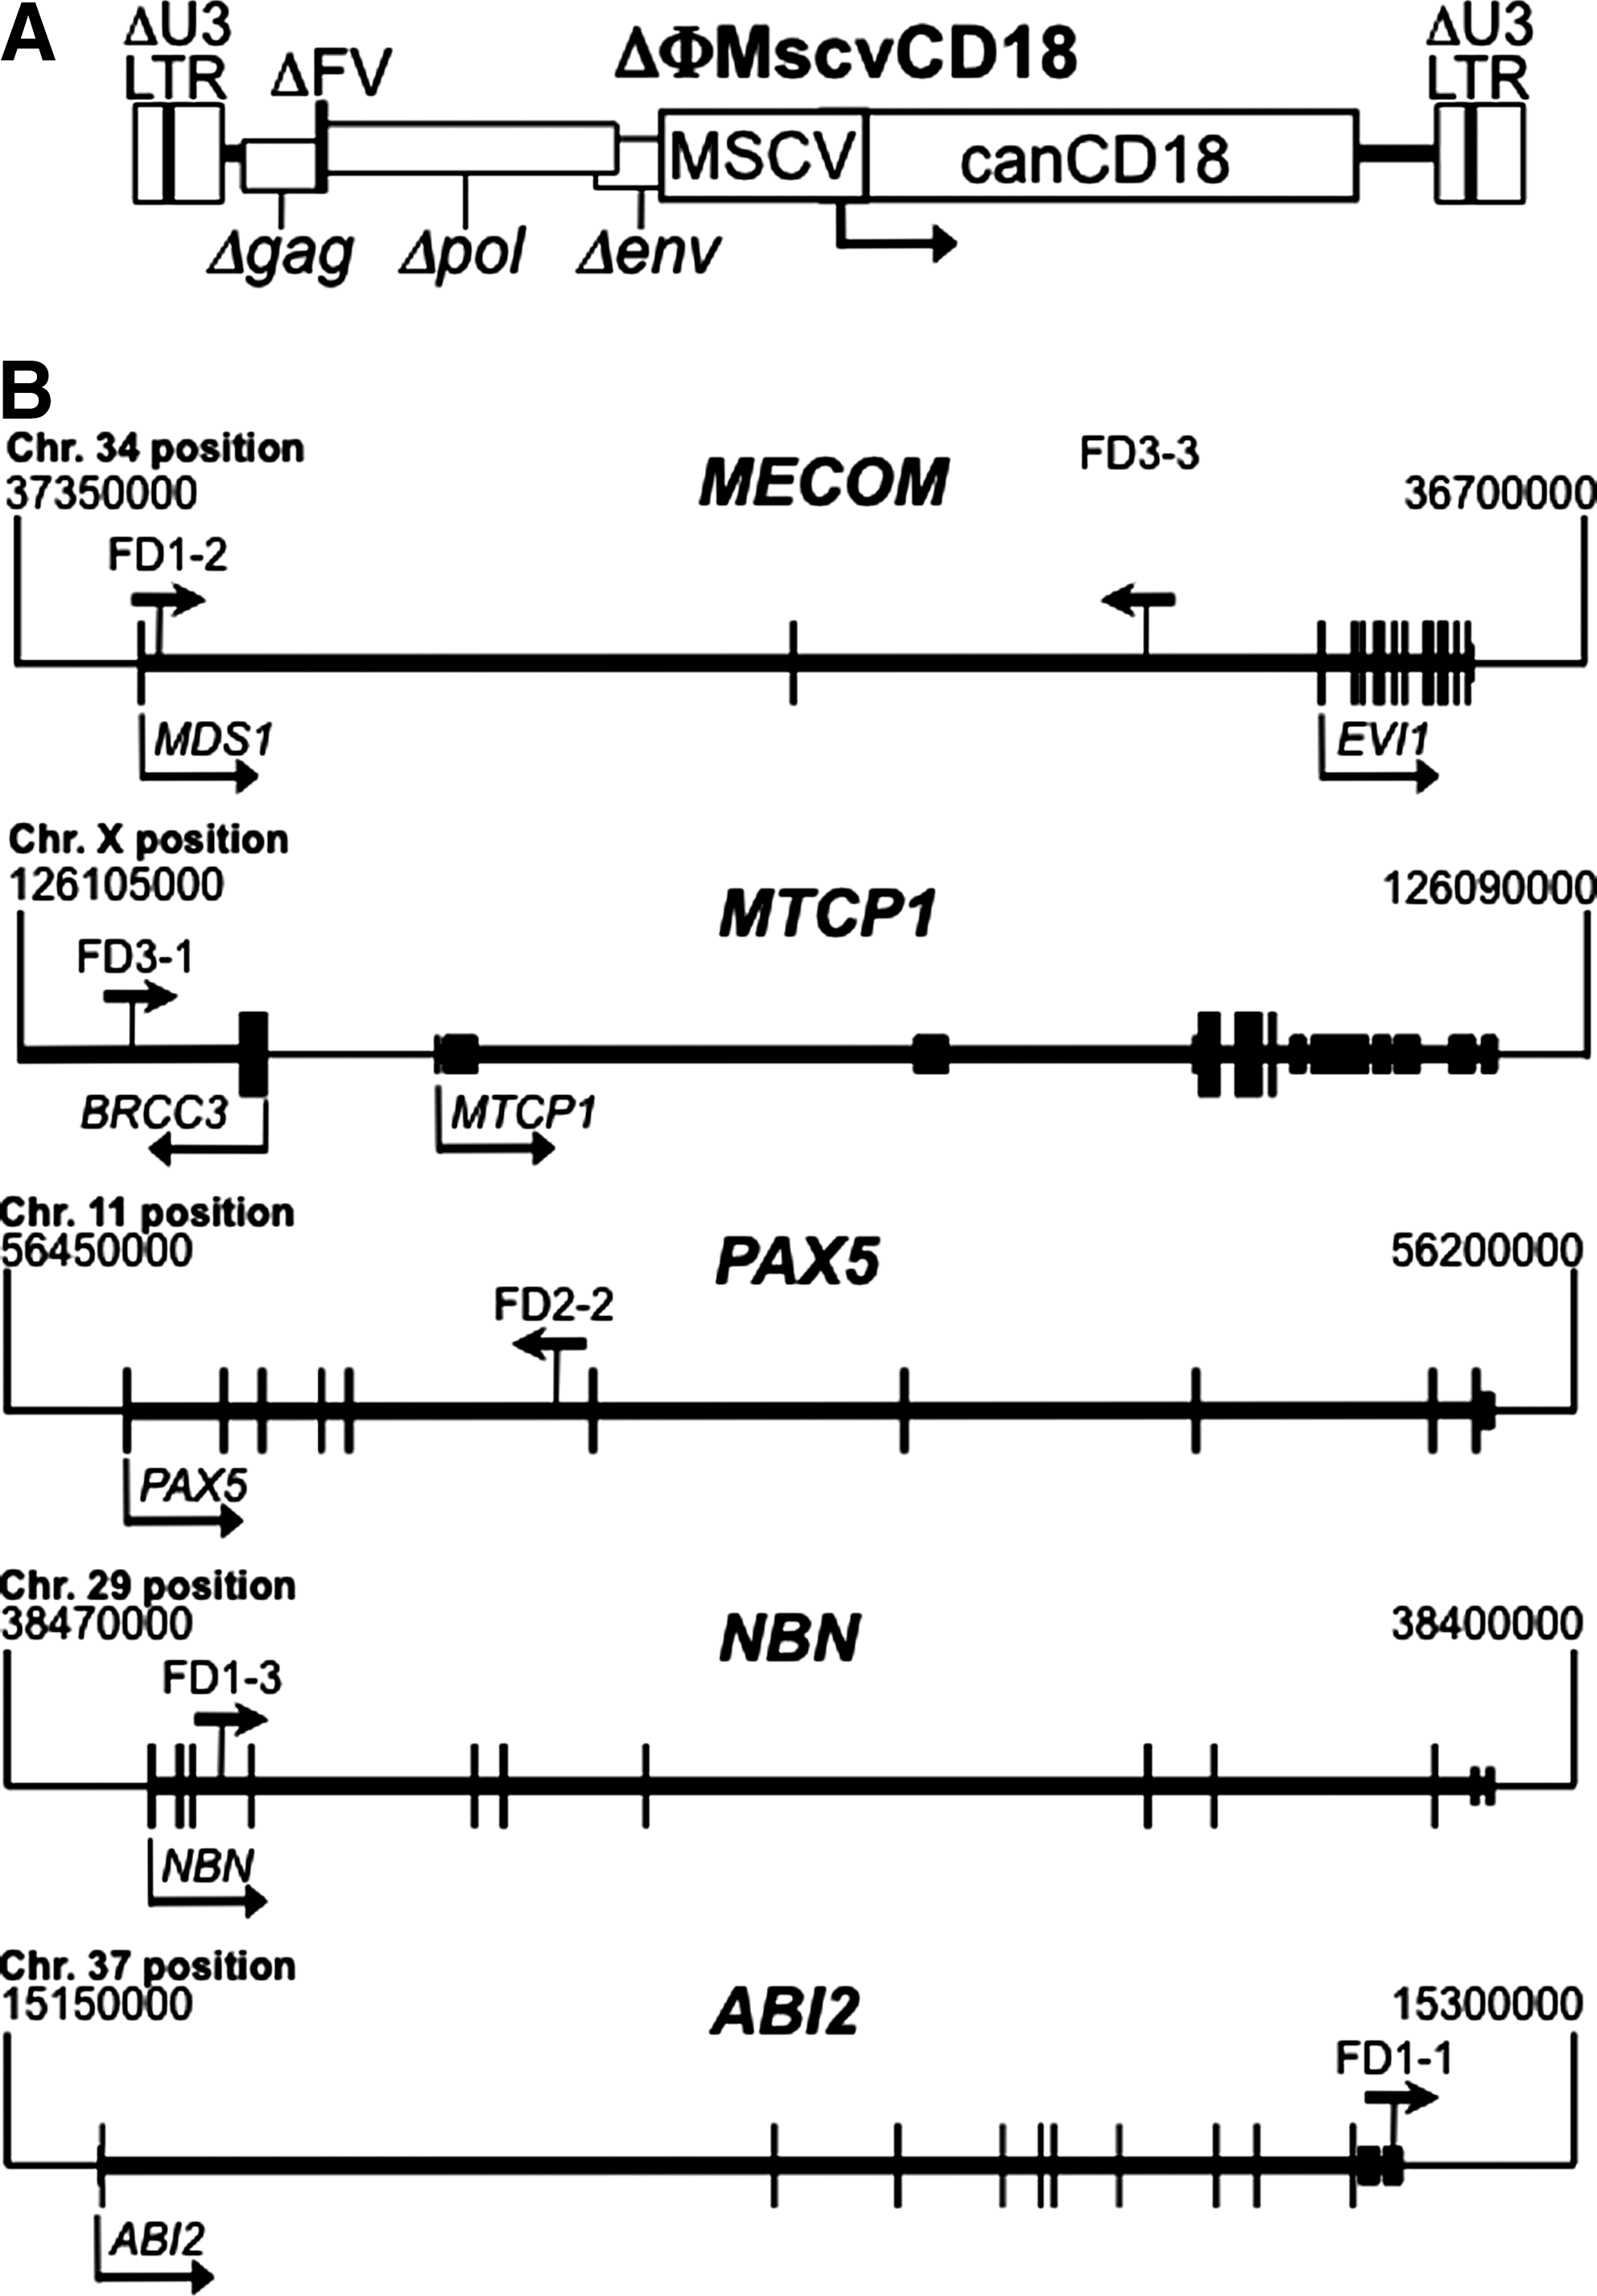
A total of 11 clones from four transplanted CLAD dogs (FD1-4) were chosen for this study (Table 2). Previously, each dog received CD34+ cells transduced with the ΔΦMscvCD18 vector (Fig. 1A) after partial myeloablation with 200 cGy of total body irradiation (Bauer et al., 2008). ΔΦMscvCD18 expresses canine CD18 from an internal MSCV promoter in a foamy vector backbone with deleted, silent LTRs (Trobridge et al., 2002; Hendrie et al., 2008). One year after receiving transduced cells, 466 distinct provirus junctions were mapped from unfractionated peripheral blood leukocytes, and 2 years after transplantation 293 and 251 junctions were mapped from CD3+ T-lymphocytes and neutrophils, respectively. The specific clones tracked here were chosen from these integrants, and included examples with proviruses present near proto-oncogenes, tumor suppressor genes, or genes unrelated to cancer (Table 2). Provirus positions within or near cancer-related genes are shown in Fig. 1B.
Vector structure and integrant localization. (
Genes listed as human RefSeq gene homologs, except for canine REFSEQ gene FUT8.
Distance in bp to transcription start site (TSS); minus and plus signs indicate upstream and downstream, respectively.
F (forward) and R (reverse) refer to same and opposite orientations of provirus and gene transcription, respectively.
N, not cancer-related; O, proto-oncogene; TS, tumor suppressor.
Its role as a tumor suppressor remains unproven.
The nearest gene is actually BRCC3, which is not known to be a proto-oncogene (see Fig. 1).
Four of the clones contained integrations within or near known proto-oncogenes. Two of these (FD1-2 and FD3-3) were in MECOM (MDS1-EVI1 complex). This gene contains transcripts for both MDS1 (Myelodysplasia syndrome 1) and EVI1 (Ecotropic viral integration site 1), is involved in translocations that cause human leukemia (Morishita et al., 1992), and is a frequent site of gammaretrovirus integration associated with murine leukemia and primary bone marrow cell immortalization (
Four other clones contained integrations in or near cancer-related genes (Table 2 and Fig. 1B). The FD3-1 integrant contained a provirus upstream of MTCP1, a proto-oncogene associated with T-cell leukemia in mice (Gritti et al., 1998) and T-cell proliferation in humans (Stern et al., 1993). The FD2-2 provirus was in PAX5, a proto-oncogene involved in human lymphoma (Busslinger et al., 1996; Iida et al., 1996; Pasqualucci et al., 2001) and leukemia (Cazzaniga et al., 2001). Overexpression of these proto-oncogenes due to enhancer and/or promoter activity of the vector provirus could potentially lead to oncogenic transformation. The FD1-3 provirus was in the tumor suppressor gene NBN, which encodes a component of the MRE11/RAD50 double-strand break repair complex (Carney et al., 1998) and, when mutated, can predispose to lymphoma and leukemia (Varon et al., 2001; Resnick et al., 2003). The FD1-1 provirus was in the ABI2 gene, which encodes a substrate for the c-ABL tyrosine kinase that impairs ABL-dependent leukemogenesis, promotes inactivation of CDC2, and suppresses cell growth (Dai et al., 2001; Lin et al., 2004), suggesting it could function as tumor suppressor [although Abi2-/- mice were not reported to have a higher incidence of tumors (Grove et al., 2004), arguing against this role]. Inactivation of a tumor suppressor gene by provirus insertion, followed by a second mutation in the other allele, could promote tumorigenesis. The other five integrants were not in cancer-related genes (Table 2), and were chosen as controls that might be present at high levels due to their recurrent identification when sequencing junctions and/or their presence in different cell samples (Table 3).
Number of sequence reads obtained from that cell source in that animal.
Number of sequence reads obtained for that specific provirus junction.
Equals [(no. of specific junction reads)/(total no. of reads with junction sequence)] × [(% CD18+ cells)/100].
qPCR copy no./LM-PCR copy no.
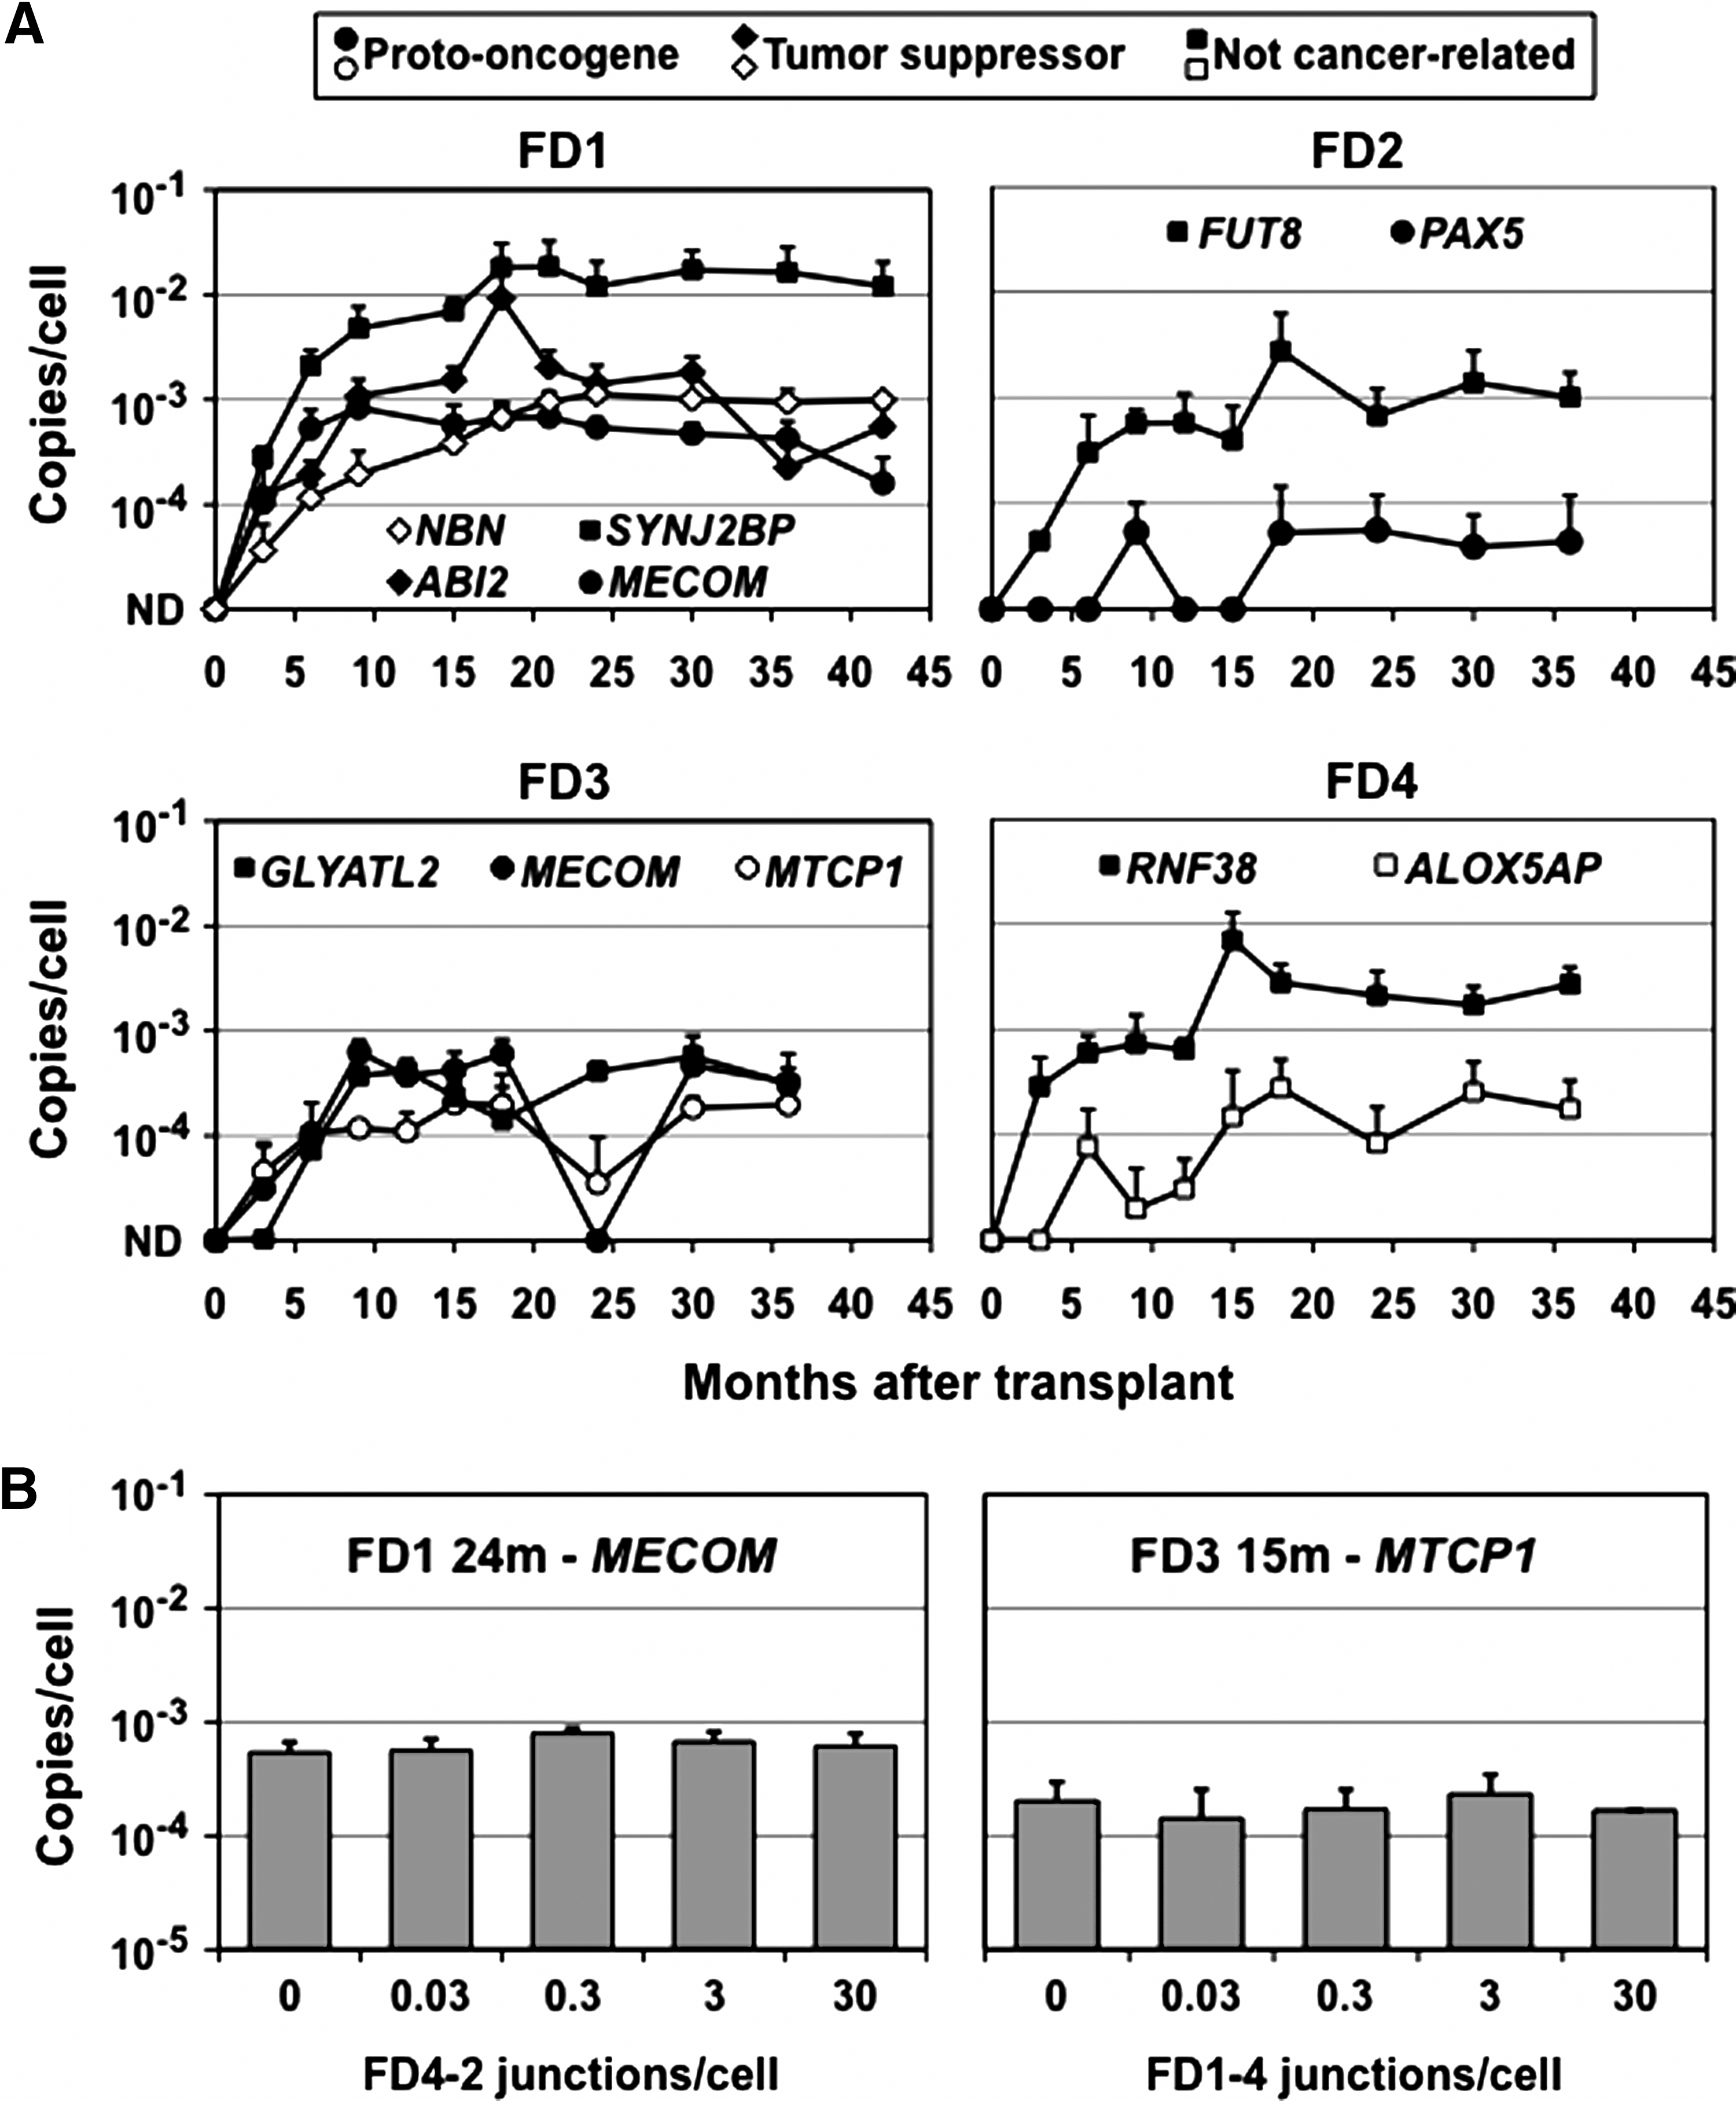
We used specific qPCR primers and probes to detect each provirus junction and track the levels of each clone in transplanted animals. Genomic DNA was purified from peripheral blood leukocytes during the 36–42-month period following transplantation, and the number of provirus copies per cell was determined for each sample. As shown in Fig. 2A, all the marking levels were initially below detection (<0.0001 copies/cell) and then increased over time. Importantly, the four clones with proviruses in or near proto-oncogenes, and the two with proviruses in potential tumor suppressor genes, did not preferentially expand over time as compared with the five control clones with proviruses near genes unrelated to cancer. The clone with a provirus in PAX5 (FD2-2) and one of those with a provirus in MECOM (FD1-2) decreased in abundance during the later time points. The clone with the highest marking rate was FD1-4, with a provirus near SYNJ2BP, which comprised 2–4% of FD1's leukocytes over a 24-month period. SYNJ2BP is also known as ARIP2, and although there are some data that its overexpression promotes the growth of breast cancer cells (Li et al., 2009), it is down-regulated in renal carcinoma cells (Brito et al., 2008), and there is no definitive evidence for a role in cancer. In addition, the marking levels for this clone changed very little once they reached 2%, arguing against vector-induced clonal expansion.
Provirus copy numbers. (
As a further test of the accuracy of our qPCR assay, we measured the copy numbers of two of these specific junctions in the presence of increasing amounts of unrelated junction sequences, to determine if other sequences might influence the PCR reaction. The unrelated junction sequences included the same LTR as the junction being measured so that the qPCR probe and LTR primer were complementary to these sequences (see Table 2). In each case, the addition of up to 30 excess junction copies per cell (>300-fold over the total provirus copy numbers in these samples) did not have an impact on our results (Fig. 2B).
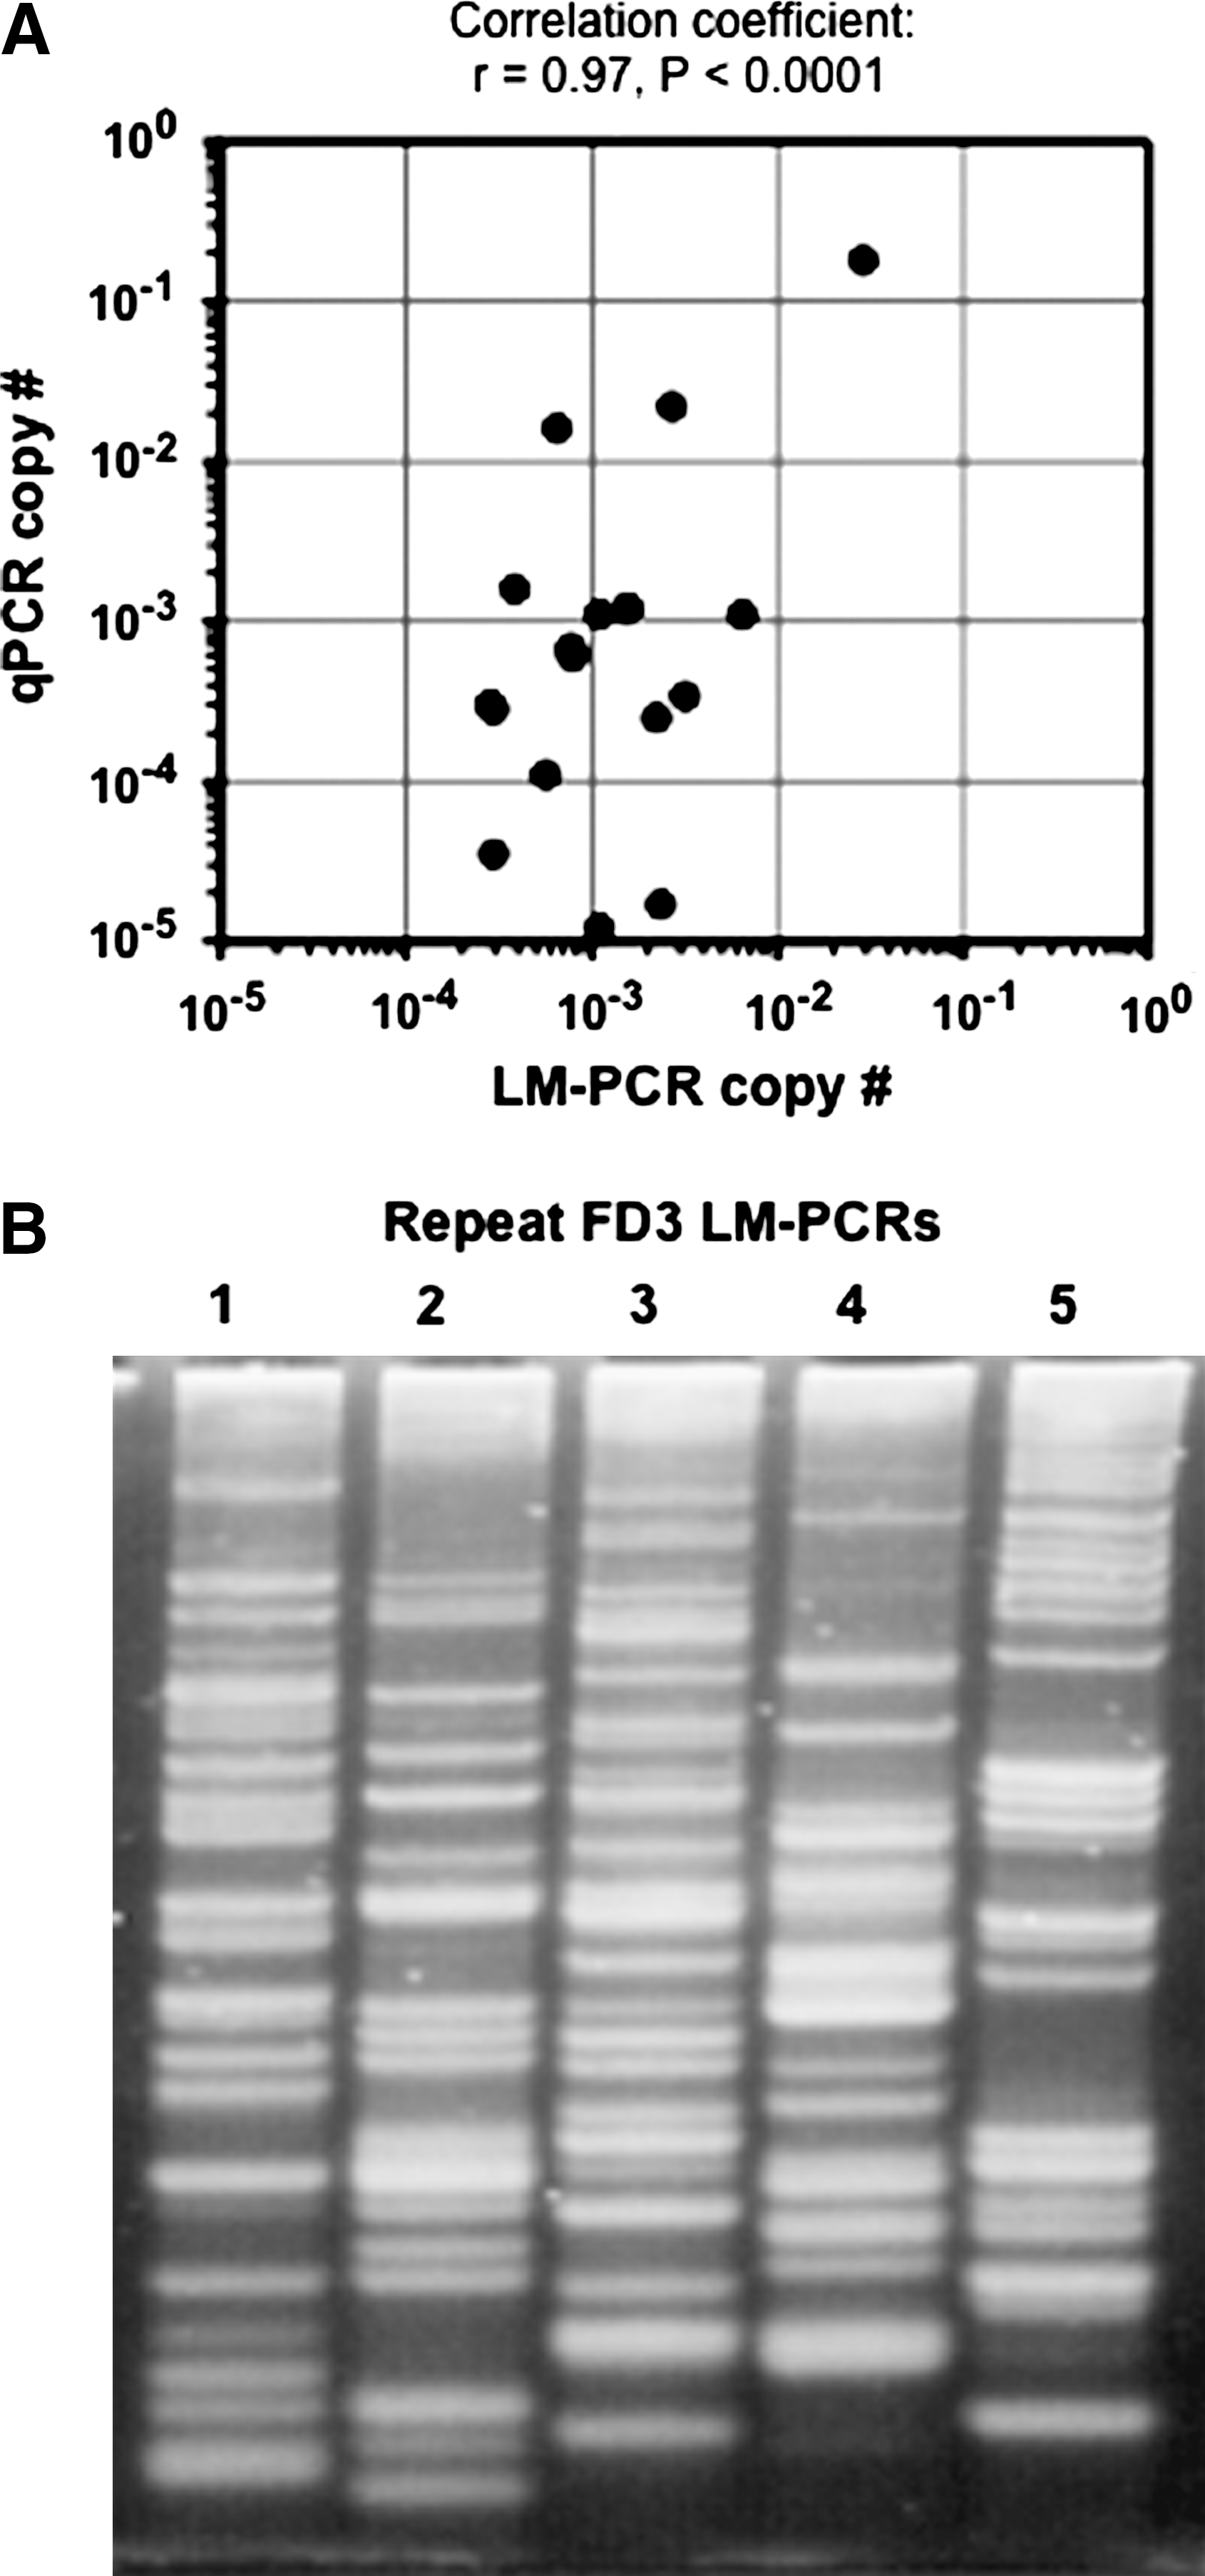
We also used qPCR to measure provirus copy numbers in the same samples originally used to isolate and sequence junctions by LM-PCR, and asked if the relative abundance of specific junction sequence reads correlated with the qPCR results. In other words, does the number of times a particular junction sequence is obtained from a sample by LM-PCR predict its copy number? This can be calculated as the proportion of sequence reads representing a particular junction times the percentage of transduced (CD18+) cells in the sample. As shown in Table 3, the LM-PCR copy number estimates were very different from those obtained by qPCR, and varied by more than 3 logs (0.0072–25; Table 3). Given that the qPCR results were obtained in a quantitative manner by comparison with known amounts of junction sequence copies present in the standards, these results underscore the inaccuracy of LM-PCR for measuring copy number. However, there was still a strong and statistically significant correlation between the qPCR and LM-PCR results (Fig. 3A), suggesting that the repeated recovery of the same junction sequence by LM-PCR is a qualitative indicator of copy number in the sample. It is possible that, with improved sequencing technologies and larger numbers of sequencing reads, this type of approach could lead to more accurate estimates of provirus copy numbers.
Copy number estimates by LM-PCR. (
One factor that may influence which sequences are obtained by LM-PCR is variation in the particular junctions amplified during PCR. Figure 3B shows that this occurred. When five different LM-PCR reactions were performed on the same genomic DNA sample from dog FD3, distinct PCR products were obtained in each reaction. For some of the junctions, this may have been due to a limiting amount of template DNA, because each PCR reaction was performed on 37 ng of genomic DNA (see Materials and Methods), which represents approximately 7,115 cell genomes (assuming 5.2 pg/cell and 2.4 Gb/haploid genome). Thus, any junction sequence present at less than 1.4 × 10⁻⁴ copies/cell (1/7,115) may have been absent in a single PCR reaction. Although this could have prevented LM-PCR-based detection of some junctions (FD2-2 in neutrophils, FD3-1 in leukocytes, and FD3-2 in neutrophils; see Table 3), most of the junctions we analyzed were present at higher copy numbers than this and presumably available for amplification, suggesting that other variables played a role, too. For example, which PCR cycle produced the first round of amplification of a particular junction could have had a large downstream effect on the total amount of product produced, as could sequence-specific effects on polymerization rates. Limiting genomic DNA amounts were less of an issue for the qPCR assay, which was performed on 200 ng of genomic DNA in triplicate, representing 1.2 × 10⁵ cells, and thereby increasing the sensitivity of the reaction.
In conclusion, our results show that there was no evidence for selective expansion of clones with FV vector proviruses near cancer-related genes. As with any study of this sort, it is possible that a longer follow-up or analysis of additional transduced clones could identify a provirus-related clonal expansion event. In other studies, specific gammaretroviral integrants in proto-oncogenes have been tracked over time without the detection of clonal expansion (Aiuti et al., 2007; Bozorgmehr et al., 2007; Metais and Dunbar, 2008; Hayakawa et al., 2009), despite the known genotoxicity of these vectors. However, there are several reasons to be encouraged by our results. First, the MECOM integrants we tracked were in a gene with well-established potential for vector-induced malignant transformation, and they were located in introns 1 and 2 (Fig. 1B), a region particularly prone to genotoxic effects (
Footnotes
Acknowledgments
This research was supported by the Intramural Research Program of the U.S. National Institutes of Health, National Cancer Institute, Center for Cancer Research, and by U.S. National Institutes of Health grants HL53750 and HL085107. We thank Laura Tuschong for processing blood samples and Mehreen Hai for assistance with LM-PCR.
Author Disclosure Statement
No competing financial interests exist.