
Abstract
Gene transfer of mutant O6-methylguanine-DNA-methyltransferase (MGMT P140K) into hematopoietic stem cells (HSCs) protects hematopoiesis from alkylating agents and allows efficient in vivo selection of transduced HSCs. However, insertional mutagenesis, high regenerative stress associated with selection, and the genotoxic potential of alkylating drugs represent considerable risk factors for clinical applications of this approach. Therefore, we investigated the long-term effect of MGMTP140K gene transfer followed by repetitive, dose-intensive treatment with alkylating agents in a murine serial bone marrow transplant model and assessed clonality of hematopoiesis up to tertiary recipients. The substantial selection pressure resulted in almost completely transduced hematopoiesis in all cohorts. Ligation-mediated PCR and next-generation sequencing identified several repopulating clones carrying vector insertions in distinct genomic regions that were ∼9 kb of size (common integration sites). Beside polyclonal reconstitution in the majority of the mice, we also detected monoclonal or oligoclonal repopulation patterns with HSC clones showing vector insertions in the Usp10 or Tubb3 gene. Interestingly, neither Usp10, Tubb3, nor any of the genes located in common integration sites have been linked to clonal expansion in previous preclinical or clinical gene therapy trials. However, a considerable number of these genes are involved in DNA damage response and cell fate decision pathways following cytostatic drug application. Thus, in summary, our study advocates ligation-mediated PCR and next generation sequencing as an effective and reliable method to identify gene products associated with clonal survival in specific experimental settings such as chemoselection using alkylating agents.
Introduction
Over the last decade HSC gene therapy was shown to be a promising and successful therapeutic option for certain congenital diseases such as severe X-linked combined immunodeficiency (Hacein-Bey-Abina et al., 2002), adenosine deaminase deficiency (Aiuti et al., 2002, 2009), chronic granulomatous disease (Ott et al., 2006), or Wiskott-Aldrich syndrome (Boztug et al., 2010). Unfortunately, this progress has been accompanied by several reports on malignant transformation following retroviral gene transfer into HSCs in mice (Li et al., 2002), nonhuman primates (Seggewiss et al., 2006), and human patients. Insertional mutagenesis, induced by viral vector insertion into the host genome (Hacein-Bey-Abina et al., 2003, 2008; Howe et al., 2008) was at least partially responsible for these malignant effects. Since transduction with high multiplicity of infection resulting in multiple retroviral integrations per target cell has been identified as a risk factor for insertional mutagenesis (Baum, 2007), low efficacy transduction followed by in vivo selection of genetically repaired cells might provide an approach to reduce the number of insertion sites in cells that are to be transplanted, thus minimizing the risk for oncogenic deregulation.
So far, however, limited information is available on how retrovirally transduced repopulating cells respond to the high regenerative stress associated with selection strategies per se and in particular with approaches utilizing potentially genotoxic agents such as alkylating drugs. In this setting, it is important to notice that the in vivo fate of individual clones harboring potentially malignant integrations can vary quite considerably ranging from no side effects at all to frank leukemia via clonal dominance and myeloproliferation. It remained unclear by which factors this fate is determined (Baum et al., 2006; Baum, 2007).
We have studied the integration patterns and the corresponding clonal kinetics of HSCs retrovirally transduced to express MGMT P140K in a murine serial transplantation model. In contrast to recent studies that used low selection doses (Ball et al., 2007; Gerull et al., 2007; Beard et al., 2009), we were specifically interested in the effect of high-dose chemotherapy on the clonal inventory of the transplanted HSCs. A vector based on the murine stem cell virus (MSCV) bearing the MGMTP140K transgene was used and primary (1°), secondary (2°), and tertiary (3°) recipient mice were treated with combined BG/alkylator chemotherapy lethal to nonprotected animals. When BM cells were subjected to ligation-mediated (LM)-PCR analysis followed by next generation sequencing (454/Roche system; “pyrosequencing”; Margulies et al., 2005), we set out to assess and grossly quantitate clonal contributions of individual gene-modified HSCs in primary, secondary, and tertiary transplanted animals.
Materials and Methods
Retroviral vector, producer cell line, and virus production
We used the gammaretroviral MGMT P140K-IRES-EGFP vector (Xu-Welliver et al., 1998), which is based on an MSCV backbone and contains the MGMT P140K gene and the EGFP marker gene, linked by an internal ribosomal entry site (IRES2) of the encephalomyocarditis virus. Viral supernatant was harvested from a stable GP + E86-based producer cell line (Xu-Welliver et al., 1998), after overnight incubation at 37°C of confluent producer cells in Iscove's modified Dulbecco's medium (IMDM; Sigma-Aldrich) supplemented with 20% fetal calf serum (FCS; Sigma) and 100 U/ml penicillin plus 100 μg/ml streptomycin (both from Life Technologies), filtered through a 0.45-μm filter and stored at −80°C before use.
BM preparation, transduction, and primary transplantation
BM was harvested from femors, tibiae, and pelvises of 8- to 10-week-old female C57Bl/6 mice (Harlan-Winkelmann) 72 hr after application of 150 mg/kg 5-fluorouracil (Gry) intraperitoneally (i.p.) (Xu-Welliver et al., 1998; Jansen et al., 2002). After red blood cell depletion with PharMLyseTM (BD PharMingen), cells were prestimulated for 48 hr in IMDM containing 20% FCS, 1% P/S, 100 U/ml recombinant human (rh)IL-6 (Novartis), and 50 ng/ml recombinant murine (rm)SCF (PeproTech). Transduction of prestimulated BM was carried out in 10-cm non–tissue culture petri dishes (BD Falcon) coated with 4 μg/cm2 RetroNectin® (TaKaRa) over a total of 48 hr. Thereafter cells were harvested and 1.5 × 10⁶ to 2.0 × 10⁶ cells were transplanted by tail vein into lethally irradiated female C57Bl/6 primary recipients (11 Gy, split dose, minimum of 3 hr between doses; Stabiliplan X-ray machine, Siemens).
Drug treatment and sample collection
Hematologic reconstitution was confirmed in peripheral blood samples taken from the tail vein by flow cytometric analysis (Veterinary blood cell counter, ABX) 24–26 days post transplantation. Thereafter, weekly rounds of chemotherapy were initiated combining injection of 25 mg/kg i.p. BG (Sigma) followed 1 hr later by injection of either (i) BCNU, 10 mg/kg i.p. (Essex Pharma), (ii) ACNU, 6 mg/kg i.p. (ASTA Medica), or (iii) TMZ, 70 mg/kg i.p. (Temodal®, Schering-Plough). Primary recipients received a total of five weekly treatment doses. Two days before each chemotherapy application and 5 days after the last treatment, peripheral blood count analysis was performed on blood samples collected by tail vein bleeding. Experiments were terminated 3–5 weeks after the last chemotherapy treatment. At this time point peripheral blood analysis was repeated. Animals were then sacrificed, and BM and spleen cells were harvested for further analysis as described by Jansen et al. (2002).
Secondary and tertiary transplants
Secondary transplants were performed by tail vein injection of lethally irradiated secondary recipient female C57Bl/6 mice with 3 × 10⁶ BM cells collected from primary recipients at the end of the experiment. After hematologic reconstitution all animals received four weekly cycles of combined BG/ACNU treatment. As with primary transplants, 2 days before each chemotherapy treatment and 5 days after the last treatment, samples for peripheral blood count analysis were collected by tail vein bleeding. Secondary recipients were sacrificed and analyzed for transduced cells in spleen and BM 4 weeks after the last dose of chemotherapy. Tertiary recipients were transplanted with 2 × 10⁶ BM cells harvested from secondary recipients at the end of the experiment and were treated with 4 × BG/ACNU chemotherapy as described for secondary recipients.
Peripheral blood counts and EGFP expression analysis
Peripheral blood leukocyte, thrombocyte, granulocyte, and lymphocyte counts were determined on a veterinary blood cell counter (ABX). EGFP expression in peripheral blood, BM, and spleen cells was assessed by analysis on an Epics XL flow cytometer (Coulter) following filtration through a 70-μm cell strainer (Becton Dickinson) and red blood cell depletion using PharMLyseTM (BD PharMingen) as previously described (Bierhuizen et al., 1997; Flasshove et al., 2000).
Detection of retroviral integration sites and next-generation sequencing
For detection of retroviral integration sites, DNA was extracted from C57Bl/6 mouse BM preparations. As described before, genomic DNA was pre-amplified (Repli-g Kit, Qiagen) (Bleier et al., 2008) and LM-PCR (Laufs et al., 2003) was performed using three different restriction enzymes (Tsp509I, RsaI, PstI). Prior to next-generation sequencing (Genome Sequencer FLX, Roche) (Margulies et al., 2005), first-round PCR products were amplified using sample-specific (“bar coded”) primers to allow multiplexing (Binladen et al., 2007) followed by gel purification. Quality and quantity of purified amplicons were determined, and pyrosequencing was then performed in the German Cancer Research Center core facility according to the manufacturer's instructions. Primers used for next generation sequencing are summarized in Supplementary Table S1 (Supplementary Data are available online at
Sequence analysis
Following 454-sequencing, sequence reads were subjected to an algorithm of the IntegrationSeq tool (Giordano et al., 2007), which automatically filters unspecific sequences (no long terminal repeats [LTRs] present) or nonassignable sequences (those without sequence tag) and subsequently performs trimming (removal of LTRs and adapters). For mapping of the remaining sequences to the murine genome the QuickMap task (available at
Pathway analysis
For assignment of functions and diseases associated with vector-hit and adjacent genes, we used Ingenuity Pathways Analysis (IPA; Ingenuity® Systems,
Estimate of single clone contribution by next generation sequencing
For clonal inventory analyses we used an approach recently introduced by Wang and colleagues (Wang et al., 2008). Assuming that low transduction efficacy results in ≤1 integration per HSC, the genomic position of the vector in the genome of a progenitor cell will “mark” all of its progeny after transplantation. Individual colonies/clones of one progenitor will therefore deliver variable amounts of identical (redundant) insertion site sequences. We thus deduced an individual clone's proportion on all transplanted cells from dividing the numbers of redundant reads of its corresponding insertion site by the number of all detected reads in a mouse. To address variations in insertion site sequence lengths, introduced during multiple steps of amplification with PCR, and also next-generation sequencing, we determined insertion sequences that aligned to locations within a 10-bp window to be derived from the same clone.
Analysis of single clone copy numbers by quantitative real-time PCR
For plasmid preparations, four different plasmids were constructed: pGEM-Usp10, containing the LTR-genome junction found in the dominant clone; pGEM-Wasf2C1 and pGEM-Tubb3C7, containing two other LTR-genome junctions; and pBluescript-MGMT, containing the MGMT P140K cDNA. To generate pGEM-Usp10, a 112-bp fragment containing the vector–genome junction was PCR-amplified (AccuPrime Taq DNA polymerase, Invitrogen) using the LTR-specific forward primer MSCV-fw (5′-GCCTTGCAAAATGGCGTTAC) together with the site (clone)-specific primer Usp-rv (5′-TGGAACTCACTCTGTCGACC). Similarly, we used MSCV-fw together with Wasf2-rv (5′-TTCCATGCCTCCTGACACCC) and Tubb3-rv (5′-ATCGTGGTCTCGCTGAT CCT) to generate pGEM-Wasf2C1 and pGEM-Tubb3C7, respectively. Next, fragments were gel-purified and cloned into the pGEM®-T vector (Promega). To create pBluescript-MGMT, MGMT of the MGMTP140K-IRES-EGFP vector (Ragg et al., 2000) was PCR-amplified by specific primers containing EcoRI and BamHI restriction sites by which the MGMT sequence was cloned into the appropriately digested pBluescript SK-vector. Following bacterial plasmid amplification (DH5α, Invitrogen) and preparation (Plasmid Mini Kit, Peqlab), both plasmid sequences were confirmed by cycle sequencing (BigDye Terminator v3.1 Kit and ABI PRISM® 3100 Genetic Analyzer, Applied Biosystems).
Copy numbers of the clone with the vector integration in the Usp10 gene were assessed using a quantitative real-time PCR (qRT-PCR) assay as described before by our group (Nagy et al., 2004; Bozorgmehr et al., 2007). This method has been shown to also allow unbiased, reliable measurements of absolute clonal copy numbers in whole genome–amplified templates (Bleier et al., 2008). In brief, serial dilutions (108 to 1 copies/μl) of the plasmids pGEM-Usp10, pGEM-Wasf2C1, pGEM-Tubb3C7, and pBluescript-MGMT were prepared and real-time PCR was performed by using the specific reverse primers together with MSCV-fw (see above) or MGMT-FP (5′-TTCACCATCCCGTTTTCCA) and MGMT-RP (5′-TGGTAAGAAATCACTTC TCCGAATT) to generate standard curves. Quantification was then achieved using the absolute quantification tool (second derivative maximum method) of the LightCycler® 480 Real-Time PCR System (Roche Diagnostics). Proportions of the Usp10, Wasf2 (C1), and Tubb3 (C7) clones on total transgenic hematopoiesis were calculated by dividing the estimated absolute copy numbers of a specific clone by the estimated absolute numbers of MGMT-positive clones. All real-time PCR amplifications were performed using the following reaction mix: forward and reverse primers (300 nM each), mixed with 3 μl template and 5 μl QuantiTect SYBR Green PCR Master Mix (Qiagen) in a reaction volume of 10 μl. Specificity of the PCR amplification was confirmed by melting curve analysis. Further quality criteria preceding and accompanying each real-time PCR amplification and subsequent data analyses (testing of cross-reactivity of primers, evaluation of PCR efficiency, etc.) were described previously (Nagy et al., 2004; Bozorgmehr et al., 2007).
Statistical analysis
Ninety-five percent confidence intervals for insertion frequencies were determined by the Clopper-Pearson method (Clopper and Pearson, 1934) and were provided in the AnalyzerReport (Appelt et al., 2009). To compare insertion frequencies in particular genomic regions to randomly expected frequencies, we estimated the latter values on the basis of a set of 106 integrations that are randomly distributed throughout the genome (Appelt et al., 2009). Confidence intervals (CI) for these reference values of random integration are not specified as those were smaller than 1% due to the high number of integrations used for estimation. To statistically test differences between estimated insertion frequencies and the reference values for random insertion, we used the Binomial test within the statistical programming environment R (
Results
Hematoprotection and efficient enrichment of MGMTP140K-transduced HSCs in primary, secondary, and tertiary transplant recipients
The clonality of transgenic hematopoiesis following transduction of BM cells with the MSCV-MGMTP140K vector (Xu-Welliver et al., 1998) was investigated in a murine serial transplantation model. Because one original aim of this study was to compare the suitability of different chemotherapeutic agents for chemoselection of MGMT P140K-transduced hematopoiesis, three cohorts of primary animals were treated with BG combined with either ACNU, BCNU, or TMZ. For follow-up studies in secondary and tertiary recipients, only combined BG/ACNU chemotherapy was used. All chemotherapy was given at doses myeloablative to non–MGMT-protected hematopoiesis.
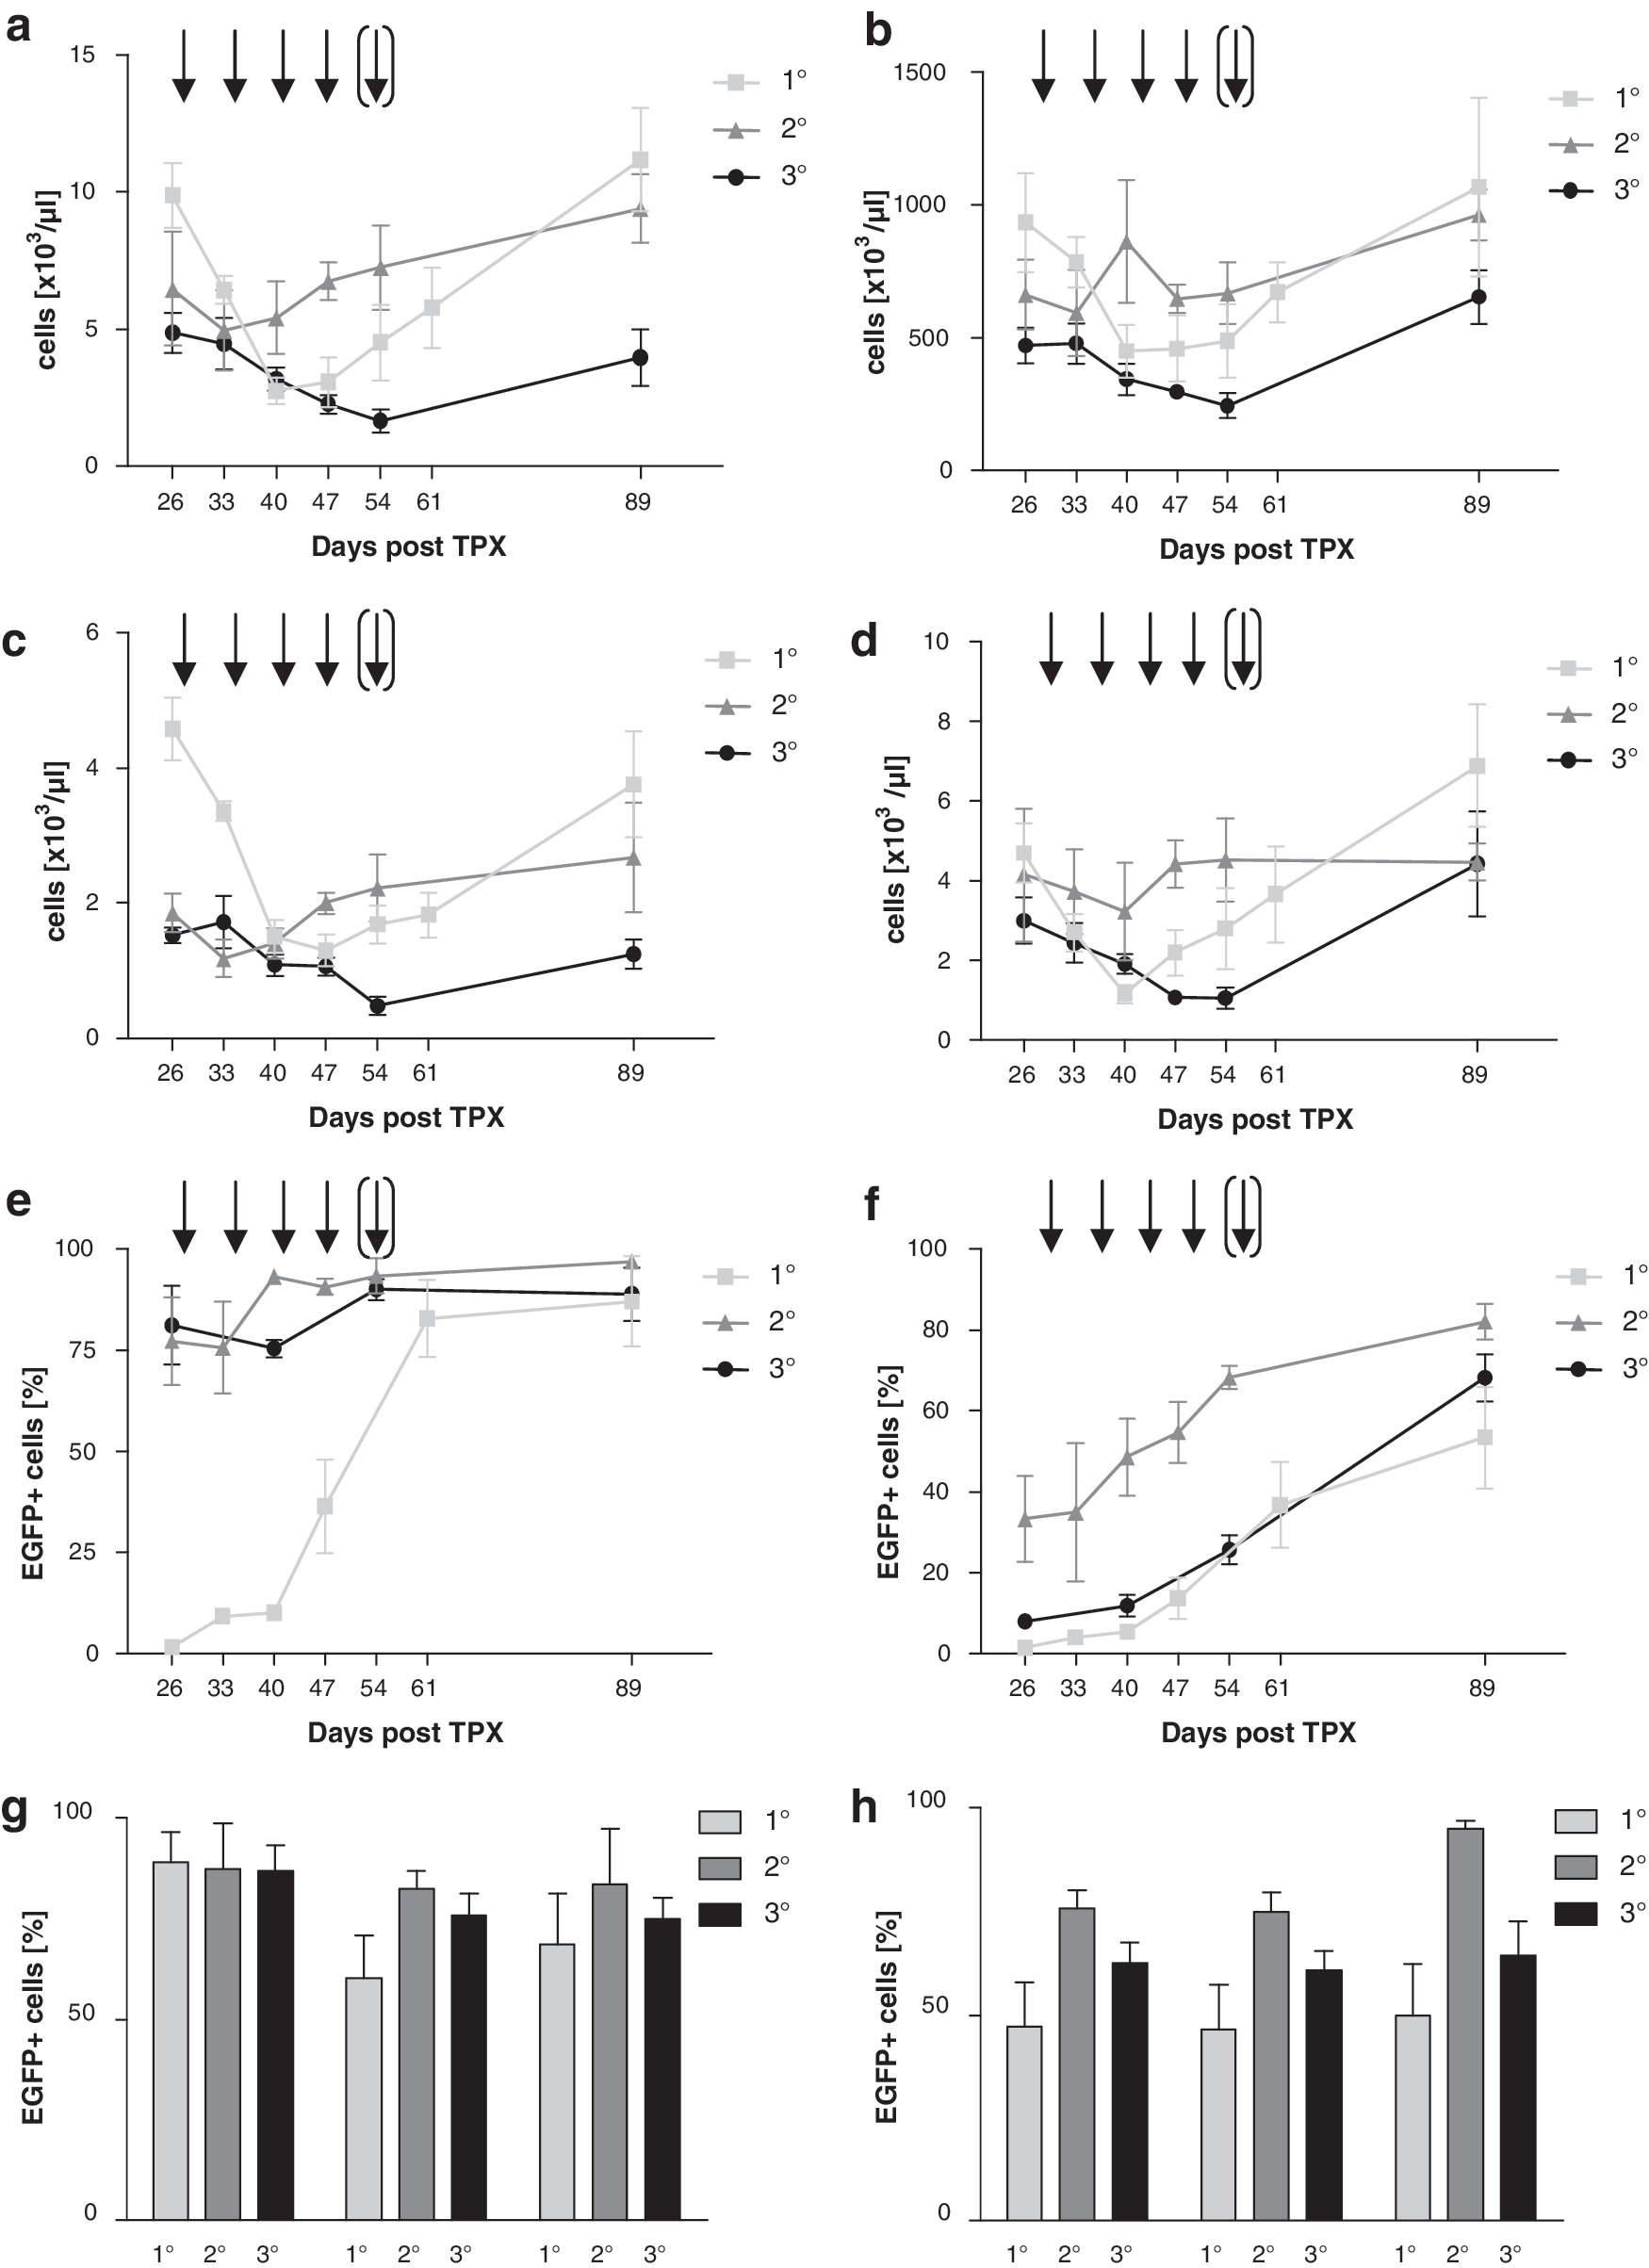
In a total of 14 (five primary, four secondary, and five tertiary) animals, DNA could be obtained from BM cells, which met the criteria required for clonal inventory analysis by LM-PCR and next generation sequencing (i.e., at least 250–500 ng of DNA). In accordance with data published previously, our murine BM transplantation/MGMTP140K gene therapy model allowed successful hematoprotection in the context of combined BG/alkylator chemotherapy in primary, secondary, and tertiary recipients. This protection was observed for leukocyte, thrombocyte, lymphocyte, and granulocyte counts (Fig. 1a–d). In addition, efficient and stable enrichment of transgenic MGMTP140K expression in the hematopoietic system including long-term repopulating cells was achieved. To stringently evaluate selection of transduced hematopoiesis, these experiments were performed with low efficiency of transduction for BM cells given to primary recipients (0.4–1.4%), which in turn resulted in a low percentage of gene-modified peripheral blood granulocytes (1.7%) and lymphocytes (1.5%) 4 weeks post transplantation and before chemotherapy. Following chemotherapy in the primary recipients, 87% ± 11% of granulocytes and 53% ± 12% of lymphocytes expressed EGFP upon peripheral blood analysis. For secondary animals, the percentage of transduced granulocytes and lymphocytes was 77% ± 10% and 33% ± 10% before, and 97% ± 1.7% and 82% ± 4.3% after chemotherapy. Tertiary animals showed 81% ± 10% and 8.0% ± 1.4% EGFP + granulocytes and lymphocytes before chemotherapy and 87% ± 5.1% and 68% ± 5.8%, respectively, at the end of the experiment in peripheral blood (Fig. 1e, f). Significant enrichment of EGFP + cells in primary, secondary, and tertiary recipients was also observed in BM derived granulocytes (87%–89%), T lymphocytes, (61%–83%) and B lymphocytes (69%–84%) as well as the corresponding spleen derived fractions (47%–76%, 47%–75%, and 50%–95%, respectively; Fig. 1g, h).
Hematoprotection by MGMT
P140K-transduced murine hematopoietic stem cells (HSCs) and efficient enrichment of MGMT
P140K transduced murine HSCs.
Detection of insertion sites
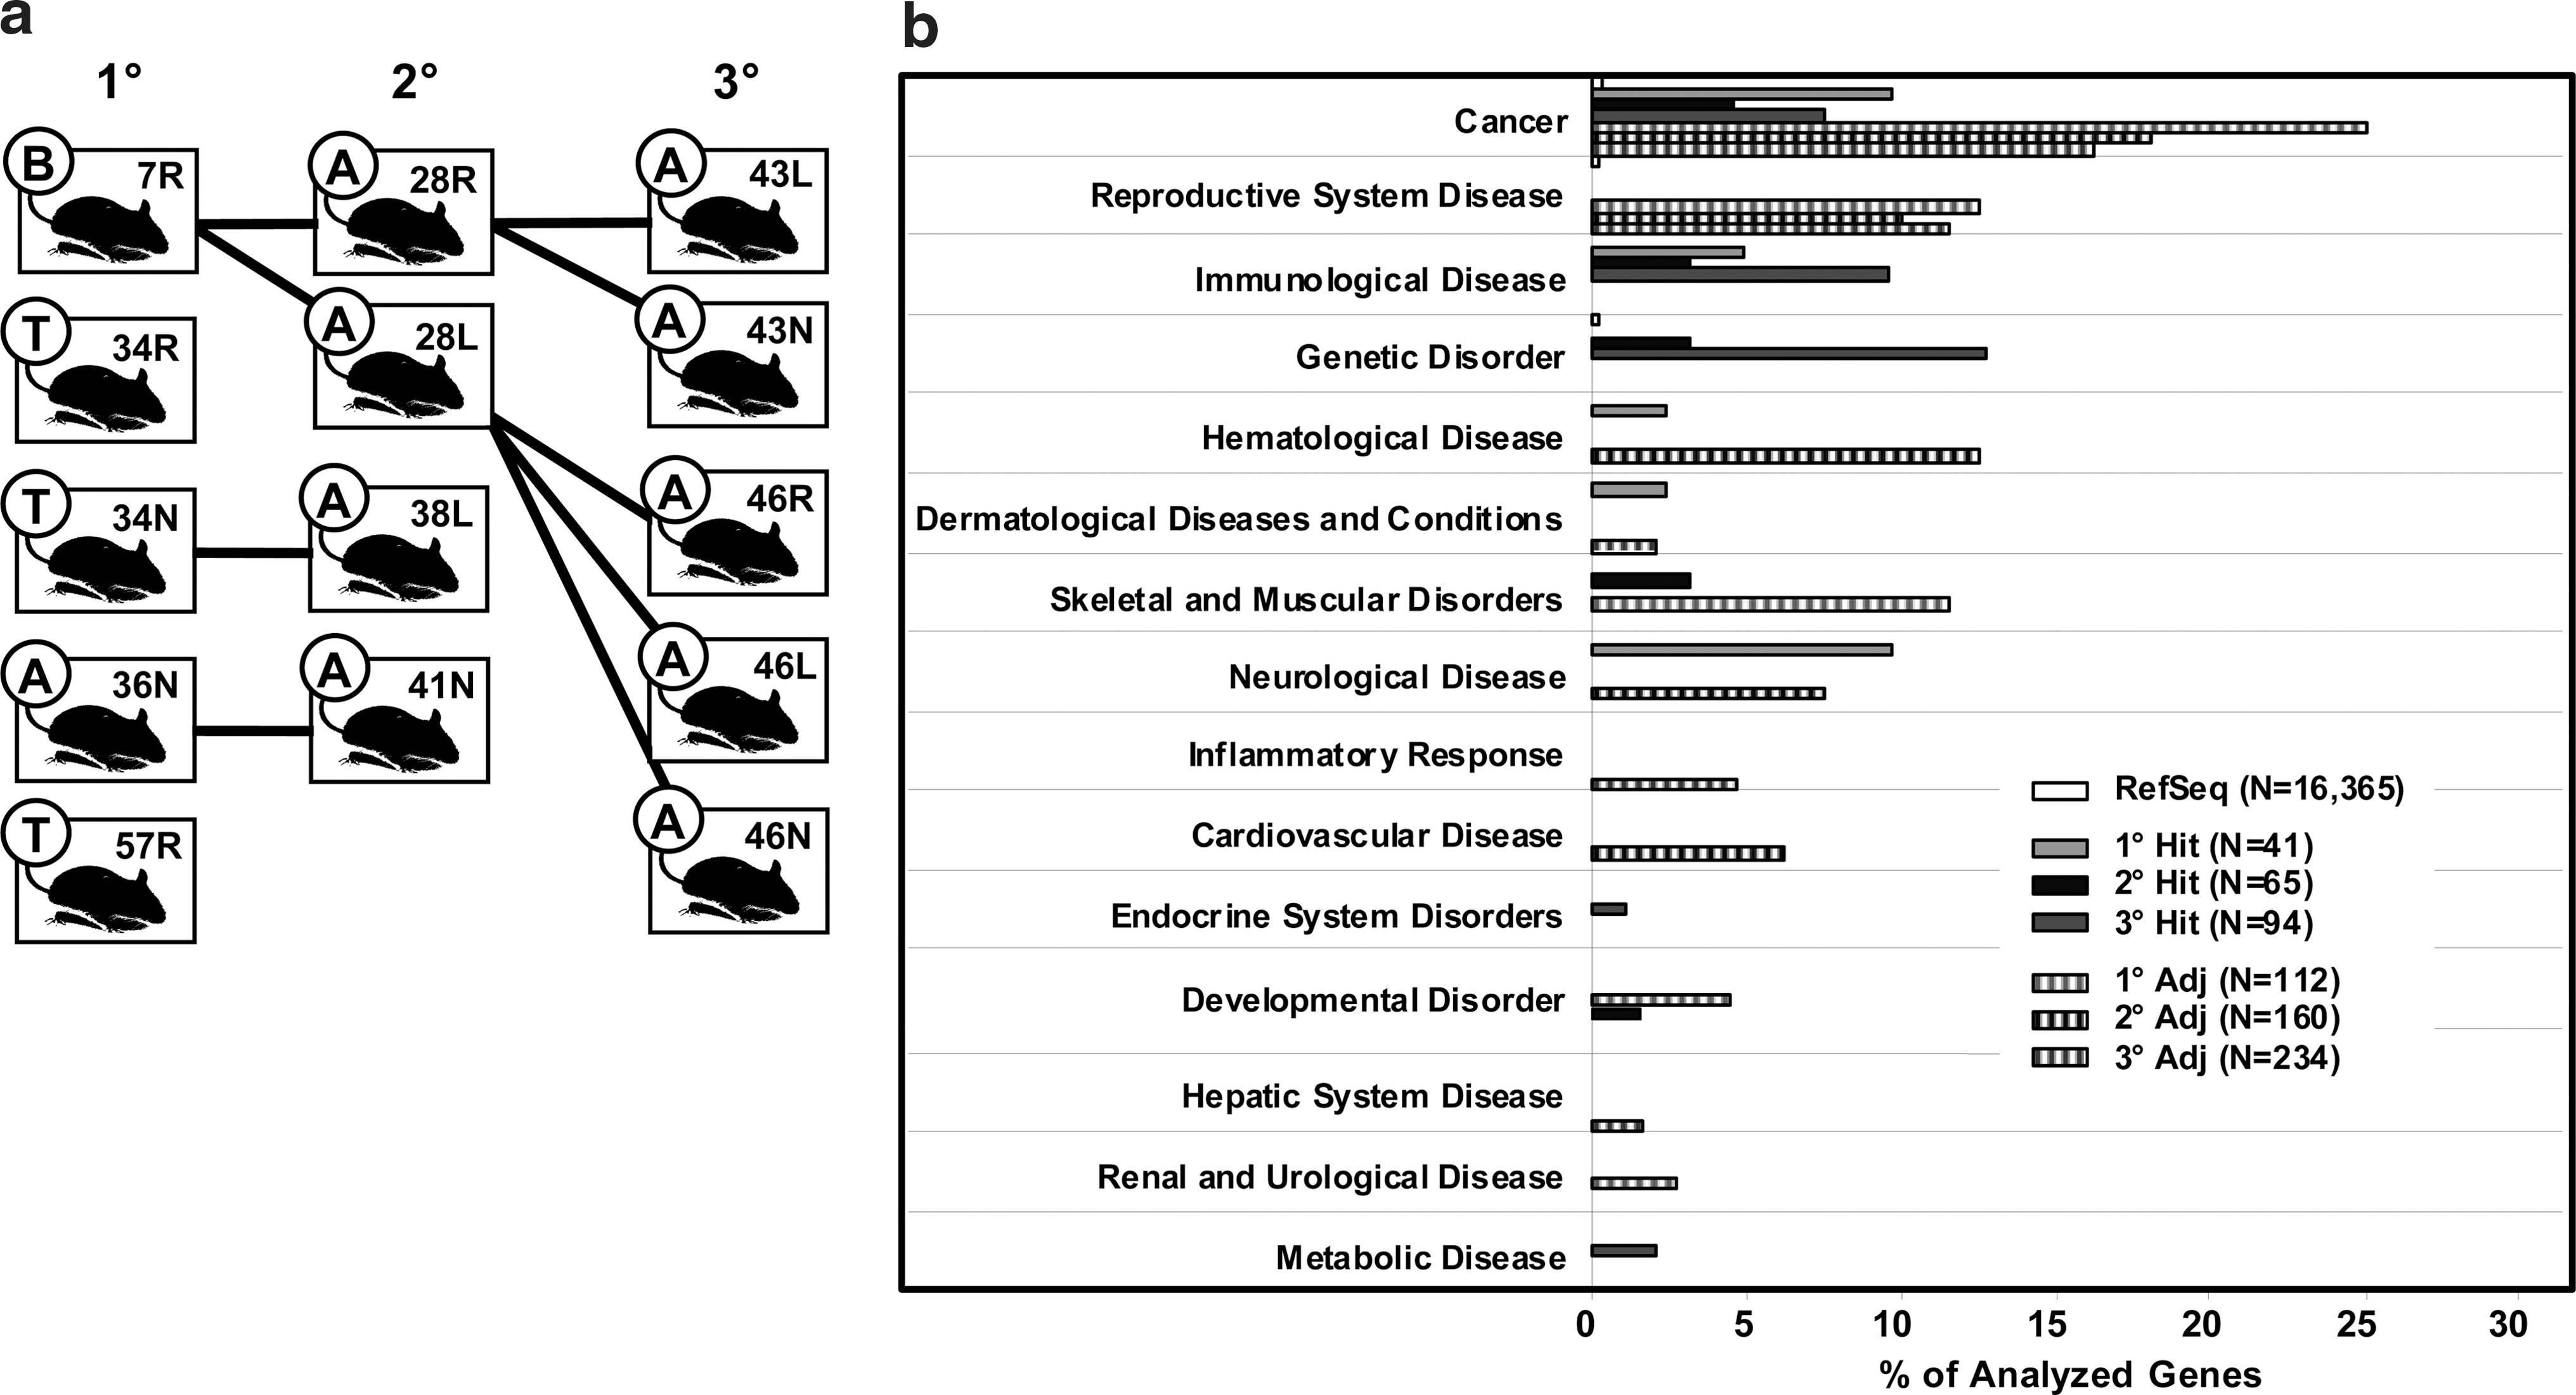
For analysis of MSCV vector insertion site patterns, BM of all 14 mice was subjected to LM-PCR and next-generation sequencing (Fig. 2a). To increase genomic accessibility and to account for possible restriction enzyme biases (Gabriel et al., 2009), we used three different enzymes, including two frequent cutters (Tsp509I and RsaI). A total of 76,110 sequence reads were obtained (1° recipients: 26,993; 2°: 26,892; 3°: 22,225) that contained a 4-bp barcode and thus could be specifically assigned to a mouse. Of those, 7,778 sequences contained 58 bp of the MSCV-LTR, followed by murine genomic sequences of different lengths. Following removal of LTR and adapter, all trimmed sequences were processed by QuickMap, which after filtering of redundant sequences revealed 110 (1° recipients), 156 (2° recipients), and 197 (3° recipients) sequences to be unique integration sites (data not shown). Fifty-three unique insertion sites were common to all three transplantation cohorts.
Insertion patterns of the retroviral vector in genes and gene groups.
Insertion patterns in and adjacent to genes
Throughout all three cohorts, insertion frequencies into genes were not seen to be statistically different from random insertions (data not shown). In contrast to this, 97.6% ± 3.5% of all insertions found in mice of the 1° cohort fell in the ± 50 kb adjacency to a transcription start site (TSS), which was significantly more than expected from the reference set of random insertions (57.8%; p < 10−15). Similar results were seen in secondary (78.7% ± 7.3%; p < 10−11) and tertiary (91.6% ± 1.8%; p < 10−15) recipients. IPA was used to functionally analyze the genes that were hit or in a ±250-kb adjacency of vector integrations. IPA uses particularly stringent criteria to assign functions to a total of 16,365 of 23,019 annotated murine RefSeq genes. This analysis revealed preferential insertion in and near specific and functionally characterized gene groups (Fig. 2b). Thus, 4.6%–9.8% of all hit genes and 16.2%–25% of all genes in a ±250-kb adjacency to vector insertions were categorized to be cancer associated, which is 23–125 times higher than the frequency obtained by analysis of a random insertion site set (0.2%; p < 10−15 for all).
Common integration sites in and around genes
Several clones were detected to carry vector insertions which occurred in closely adjacent genomic loci; of those, four regions of ∼8.5-kb width could be identified as targets of five or more insertions, resembling common integration sites (CISs; Table 1) as defined previously (Deichmann et al., 2007). Nine clones (Tubb3 C1–C9), each with a different insertion in an 8.8-kb spanning window located downstream of the Tubb3 gene (14.2–23 kb distance from the TSS to the insertion) and upstream of the Def8 gene (8.4–17.2 kb) could be identified. In this CIS, the vector was seen to be predominantly in reverse orientation with respect to Tubb3 (and also to Def8). Of note, the number of different clones detected within the Tubb3 CIS increased from 1° (three clones) to 2° (seven clones), but not from 2° to 3° (seven clones) transplanted cohorts (Fig. 3a). Eight clones showed insertions in an 8.5-kb spanning CIS (Grk5 C1–C9) located in intron 1 of the Grk5 gene (35.8–44.3 kb). As seen for clones of the Tubb3 CIS, the vector was found predominantly reversely orientated and clone numbers only increased from 1° (three clones) to 2° (seven clones) cohorts (Fig. 3b). In a further region of insertion site clustering, 8.2 kb in size, seven different clones (Pus7 C1–C7; Fig. 3c) were detected downstream of the Pus7 gene (74.4–82.6 kb) and upstream of the Srpk2 gene (Srpk2: 84.5–92.7 kb). Five clones (Fcrla C1-C5) carried insertions that occurred within a 8.7-kb region upstream of the Fcrla gene (13.9–22.6 kb) and downstream of the Fcgr2bgene (25.9–34.6 kb; Fig. 3d). For the latter two CISs, clone numbers remained stable in successive transplant cohorts.

Common integration sites (CIS). Each graph shows the plus and minus strands of the murine genome whereas genes are shown as thick arrows. Numbered circles indicate integrations (clones) found in the corresponding recipients (1°–3° transplantation cohorts).
Chr, chromosome; TSS, transcription start site; Vector ori, orientation of the MSCV vector with respect to the CIS gene; rev, reverse orientation; fwd, forward orientation.
Four CIS, each consisting of at least five different vector insertions within a window of 10 kb, were detected in (hit) or adjacent to genes (adj).
Clonality analyses using next-generation sequencing
To screen for clonal inventory during the three rounds of transplantations and in vivo selection, contribution of individual clones to (BM-derived) hematopoiesis were assessed for a total of nine mice (three 1° mice, two 2° mice, and four 3° mice) using pyrosequencing read counts (Fig. 4). Of note, we performed up to four LM-PCR reactions for each mouse followed by pyrosequencing to allow for a meaningful estimation of the level of whole animal clonality. Here, all 1° mice, one 2° mouse, and three 3° mice showed polyclonal reconstitution with sporadic dominance of a clone that carries an integration 5.5 kb upstream of the Dopey2 gene, contributing 18% (34N), 24.9% (57R), and 43.9% (mouse 28L) of reads.
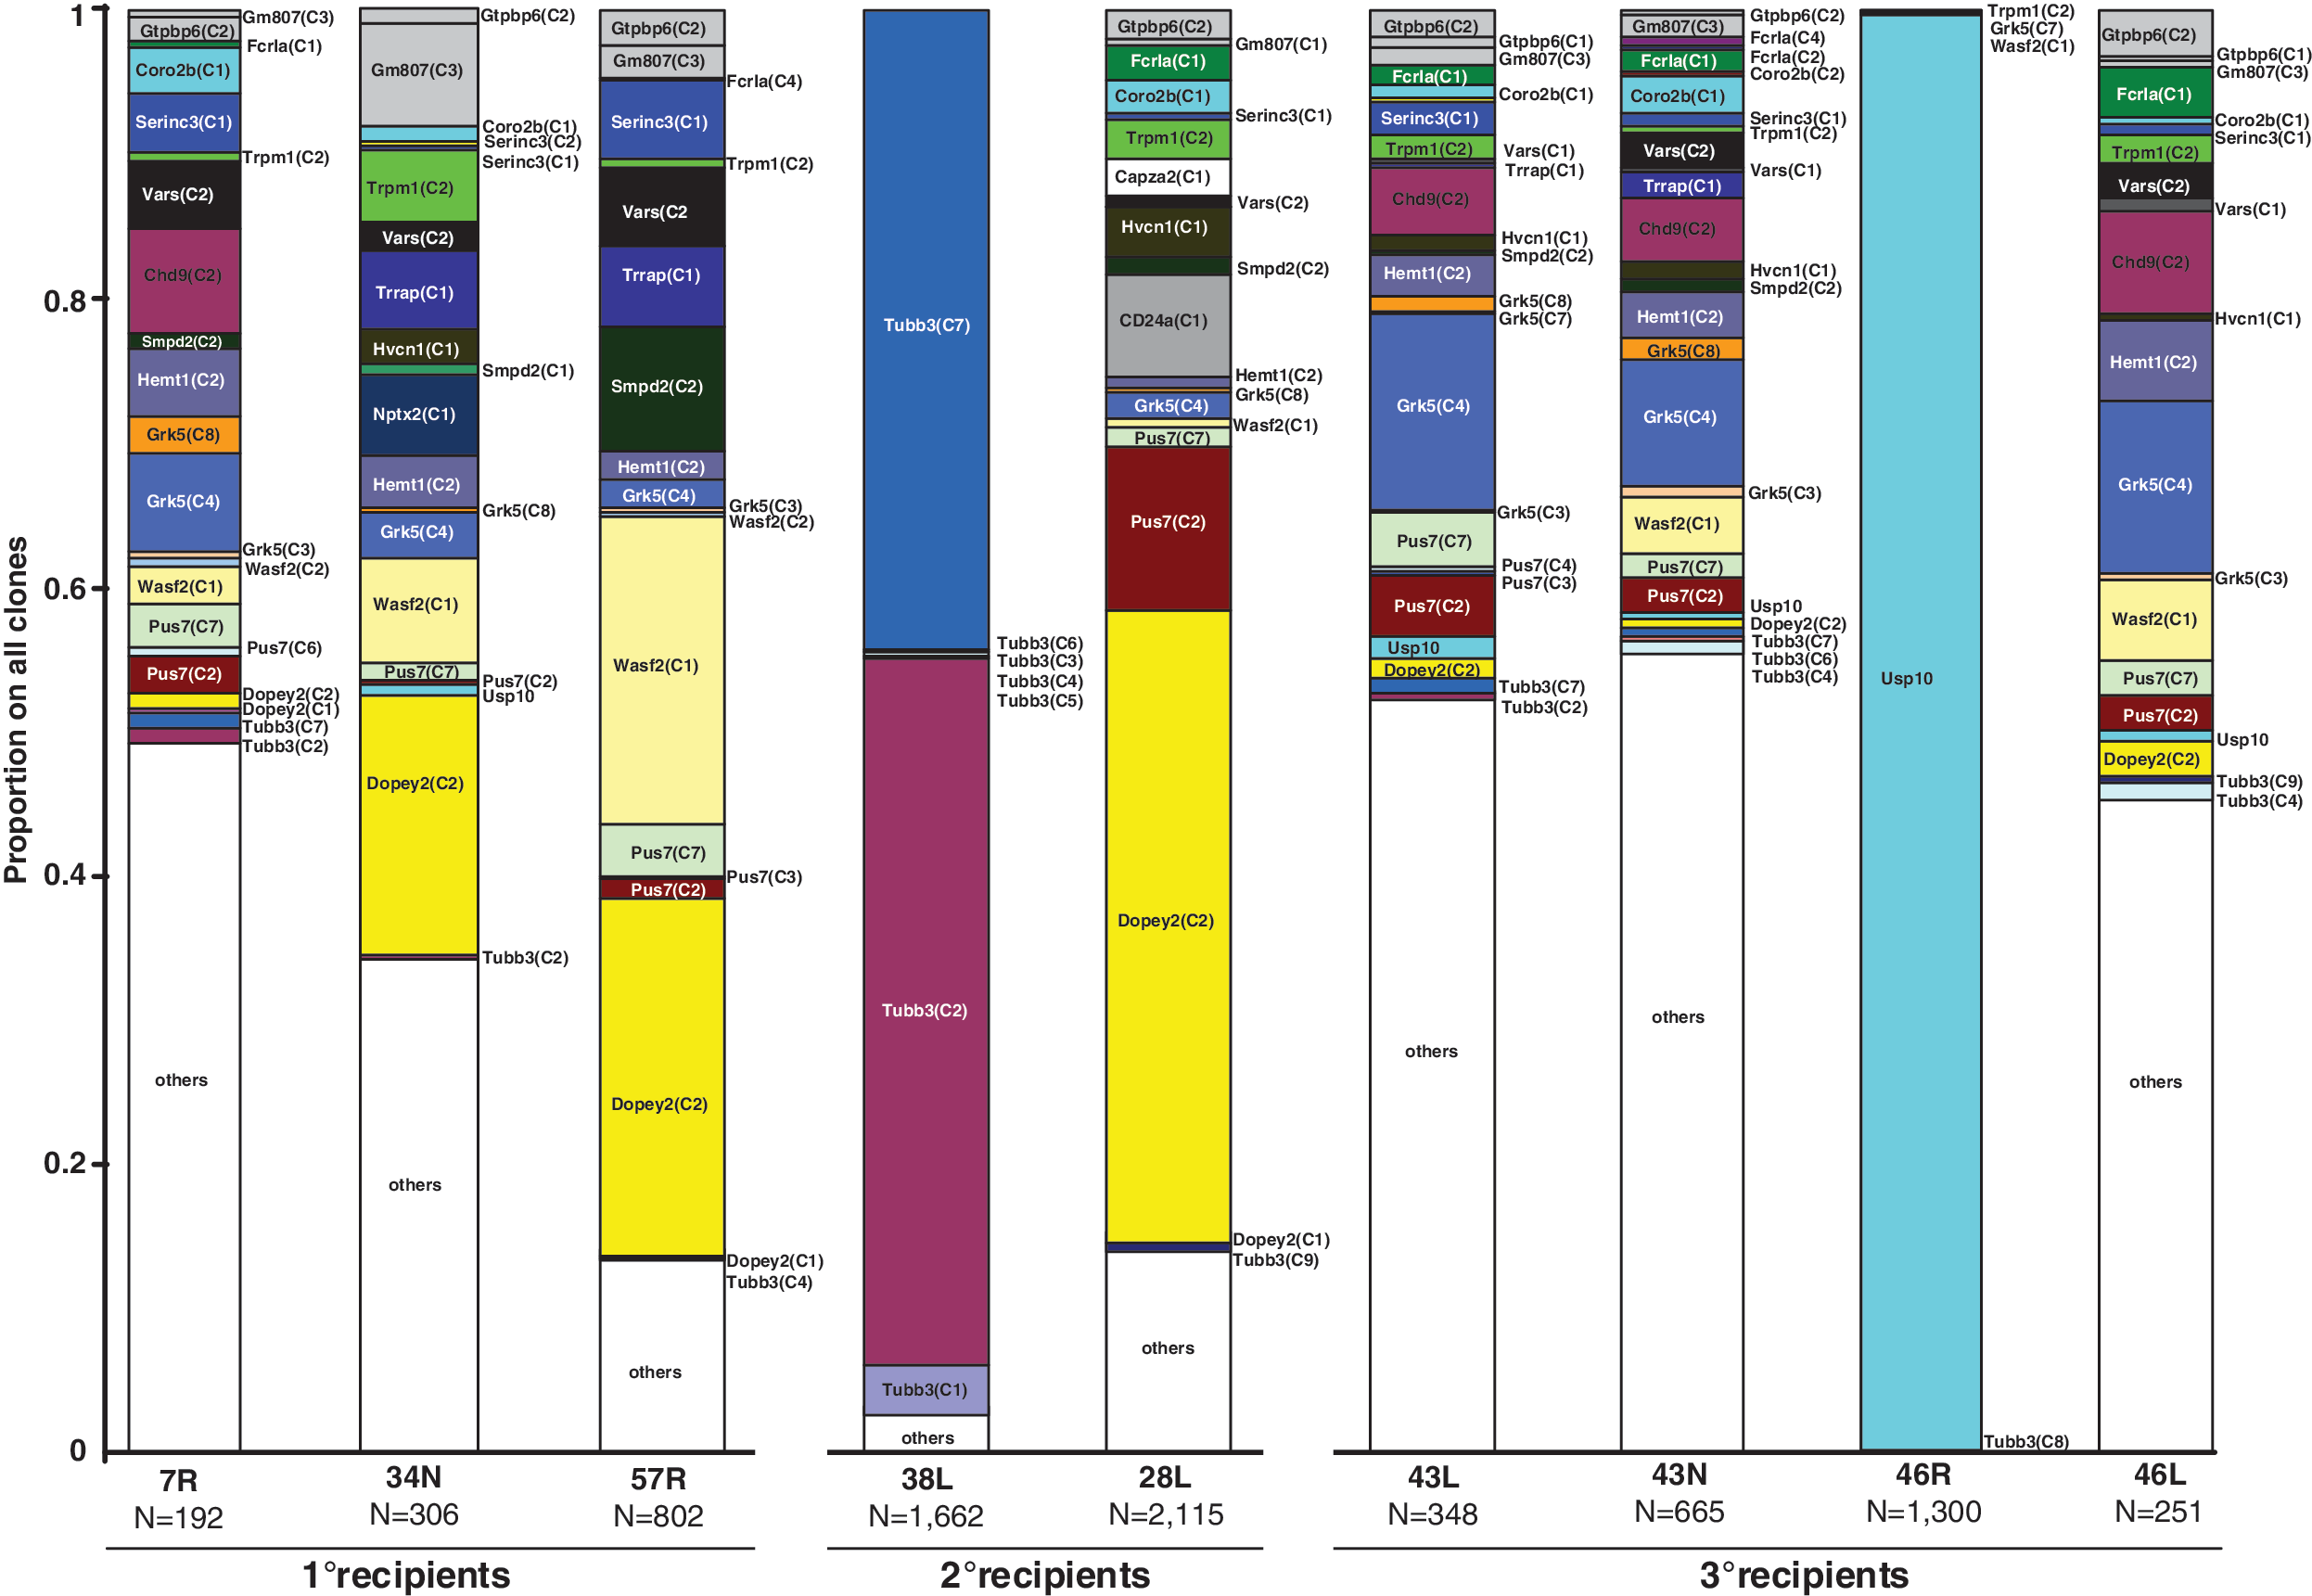
Results of the clonal analysis using next-generation sequencing. Supplementary Table S2). The names of the clones were derived from the gene that was found to be hit or adjacent to the insertion site present in the clone. Clones that contributed less than 0.5% were summarized under ‘others'. ‘N’ gives the number of all sequence reads obtained for a mouse.
In sharp contrast to these polyclonal patterns, oligo- and monoclonal reconstitution of hematopoiesis was observed in one 2° mouse and one 3° mouse. Oligoclonality was observed in mouse 38L. In this animal a total of 13 clones were detected and two clones that both carried integrations in adjacency to Tubb3 and Def8 contributed 49% (Tubb3 clone 2) and 44.3% (Tubb3 clone 7) of reads. In mouse 46R, 99.5% (CI: 98.9%–99.8%) of all insertion site reads recovered were derived from a clone that carried a single vector insertion in intron 1 of the Usp10 gene (+7 kb distance to TSS). Beside this dominant clone, only nine other clones were detected in 46R (each of them made up <0.1% of all reads), which, compared with 67–145 different clones found in the other three mice of the tertiary cohort, underlines the perturbed clonal diversity in this mouse. Further analysis showed that the vector was inserted in forward orientation with regard to Usp10 (data not shown).
Validation of monoclonality
We sought to validate the monoclonal situation and repeated LM-PCR on BM samples of the four tertiary transplanted mice to compare fragment recovery by gel electrophoresis. Except for mouse 46R, we saw multiple bands of different sizes in the BM of all mice, indicating multiple HSC clones (Fig. 5a). In contrast, LM-PCR analysis of mouse 46R resulted in one (RsaI and PstI) or two (Tsp509I) bands, whereas the fragment containing the flanking site within Usp10 only appeared when digesting template DNA with the 4-cutters Tsp509I or RsaI. We then determined copy numbers of the clone carrying the integration in the Usp10 gene applying a qRT-PCR method (Nagy et al., 2004; Bozorgmehr et al., 2007). Due to a limited amount of template DNA, we were only able to analyze three tertiary transplanted mice (Fig. 5b). Here, results of the read count analysis using next-generation sequencing were comparable to qRT-PCR–determined copy numbers (mouse 43L, qRT-PCR: 4.1% ± 5.8%, read counts: 1.4% CI: 0.5%–3.3%; mouse 43N, qRT-PCR: 2.5% ± 1%, read counts: 0.5% CI: 0.1%–1.3%; mouse 46R, qRT-PCR: 116.7% ± 20.3%, read counts: 99.5% CI: 98.9%–99.8%).

Confirmation of monoclonality and quantitative assessment of clonal contribution.
Quantification of nondominant clones by qRT-PCR
To further evaluate the robustness of the read-count–based estimation of clonal size also two nondominant clones bearing integration sites either 35 kb upstream of the Wasf2 (clone 1) gene or within the Tubb3 (clone 2) CIS were analyzed by qRT-PCR. For both clones qRT-PCR demonstrated substantial underestimation of clonal contribution by read-count analysis. Thus, for the Wasf2 (clone 1), contributions of 2.5% ± 5.8% (mouse 43N), 13.5% ± 3.3% (43L), and 10.4% ± 1.7% (7R) were measured, which compared with values of 3.9% (CI: 3.5%–4.7%; mouse 43N), 0% (43L), and 2.6% (CI: 2.1%–2.8%; 7R) assessed by read counts (Fig. 5c). Similar discrepancies were noted for the Tubb3 (clone 2): 14.6% ± 4.6% in mouse 7R and 11.4% ± 6.9% in mouse 43N by qRT-PCR versus 1% (CI: 0.5%–1.2%) for 7R and 0.6% (CI: 0.3%–0.7%) for 43N by read count analysis (Fig. 5d).
Discussion
Following retroviral gene marking, individual vector insertions have been shown to confer an abnormal proliferative advantage and in the long run to induce leukemia, and at least in the murine system, the regenerative stress associated with serial transplantation has been defined as one of the major risk factors in this context (Kustikova et al., 2005; Modlich et al., 2005). Clinically, the occurrence of leukemia has been observed in some but not all clinical gene transfer studies (Hacein-Bey-Abina et al., 2003, 2008; Howe et al., 2008; Stein et al., 2010). Thus, it is questionable whether just one adverse event in a cell causes a malignant transformation. It has been hypothesized that in addition to specific vector integration, further mutagenic events are needed for the malignant transformation of cells, which may include regenerative stress, chemotherapy, and other external factors (Seggewiss et al., 2006). Along this line, it was described in the murine system that malignant clones causing leukemia had at least three simultaneous insertions in proto-oncogenes (Modlich et al., 2005). In vivo selection strategies utilizing MGMTP140K expression and BG/alkylator chemotherapy thus exhibit at least three potentially genotoxic risk factors, as they combine retroviral insertions, high regenerative stress within the hematopoietic system, and exposure of target cells to DNA-damaging agents. Therefore, it appears extremely important to understand the fate of individual retrovirally MGMTP140K -transduced HSC clones in the setting of in vivo selection by combined BG/alkylator chemotherapy.
Here, we present data from up to tertiary transplantations of MSCV-MGMT P140K-transduced BM cells into mice subsequently undergoing BG/alkylator treatment. As expected from earlier studies (Ragg et al., 2000; Jansen et al., 2002; Beard et al., 2009), efficient in vivo selection was observed resulting in nearly completely transduced hematopoiesis in all cohorts. In three primary, one secondary, and three out of four tertiary transplant recipients analyzed for their clonal repertoire, we observed polyclonal reconstitution with remarkable similarity in the clonal repopulation pattern. As all these animals received BM from the same primary mouse, this observation strongly supports a conclusion derived from serial transplantation studies performed with clonally derived, nontransduced HSCs, namely that individual stem cell clones exhibit a fixed and serially “transplantable” repopulation potential (Muller-Sieburg et al., 2002; Dykstra et al., 2007; Roeder et al., 2008). This hypothesis is also consistent with substantial stochastic fluctuations in the contribution of individual clones over time as detected in our different cohorts (Roeder et al., 2008).
However, we also observed almost monoclonal or biclonal repopulation patterns in recipients of the 2° or 3° transplant cohort. Here, the respective clones carried vector insertion in intron 1 of the Usp10 gene or downstream of the Tubb3 gene, respectively. This clonal outgrowth may have been caused by insertional mutagenesis, a hypothesis that is further supported by the observation of common integration sites and the high number of vector insertions within or close to genes associated with cancer. Both, clustered insertions and insertion in possibly survival-promoting genes point to growth advantage–conferring insertions and thus a considerable contribution of the retroviral non-self-inactivating (SIN)- MSCV-vector to HSC survival and/or proliferation. Similar findings from a recent clinical gene therapy study also support this theory (Deichmann et al., 2007). It is important to point out here, that previous studies interrogating MGMT-mediated in vivo selection of HSC resulted in preserved polyclonal hematopoiesis although similar vector backbones were employed (Ball et al., 2007; Gerull et al., 2007; Beard et al., 2009). However, these studies primarily have explored low chemotherapy doses such as minimally required for in vivo selection in gene therapy strategies for genetic diseases. In contrast, high-dose alkylator chemotherapy, which is more suited to treat cancer patients, has been applied in our model.
Of note, the genes associated with CIS or dominant clones in our study are different from the “classical” retroviral CIS genes (such as EVI1-MDS1, LMO2, CCND2, etc.) described in transformed and expanded cell clones in the past (Li et al., 2002; Hacein-Bey-Abina et al., 2003; Calmels et al., 2005; Ott et al., 2006; Cattoglio et al., 2007; Deichmann et al., 2007; Howe et al., 2008; Cavazzana-Calvo et al., 2010; Stein et al., 2010). This finding suggests that the involvement of these genes may be specific for the in vivo selection strategy applied here. Indeed, many of the genes associated with CIS or dominant clones in our study have been described in the context of DNA damage response, cell fate decisions, and related pathways. Thus Usp10, which belongs to the family of de-ubiquitinating proteases (Ciechanover et al., 2000), is stabilized upon DNA damage, and a fraction of Usp10 is translocated to the nucleus to activate p53. Usp10 does not represent an oncogene, however, because it suppresses tumor growth in cells with wild-type p53 and is down-regulated in a high percentage of clear cell carcinoma cells (Yuan et al., 2010). Therefore, it appears highly unlikely that dysregulation of Usp10 expression on its own is responsible for the monoclonal proliferation observed in animal 46R and this assumption is supported by the fact that the same clone is detected in other tertiary transplanted mice showing polyclonal repopulation patterns. Rather, it appears likely, that due to the repetitive, dose-intensive chemotherapy, second-hit mutations have occurred, which potentially in combination with a particular Usp10 dysregulation concerted the monoclonal expansion of this clone. Similar observations have been made in a study on rhesus macaques transplanted with MSCV-transduced HSC and treated with chemotherapy (Seggewiss et al., 2006).
Roles in DNA damage response or cell death control also have been described for several genes associated with CIS in our studies such as G-protein–coupled receptor kinase 5 (Grk5), nuclear localized protein-1/transcription factor 25 (Nulp1/Tcf25; see Fig. 3), and β-tubulin class III (Tubb3). While Grk5 functions as a negative regulator of p53 and its knock-down increases apoptosis in osteosarcoma cells (Chen et al., 2010), Nulp1/Tcf25 has been shown to bind the X-linked inhibitor of apoptosis protein (Xiap) and sensitize tumor cells to cell death (Steen and Lindholm, 2008). Tubb3 mainly has been described in the context of spindle cell toxin-induced cell death and its overexpression is associated with taxoid-resistance in breast and ovarian cancer (Kavallaris et al., 1997; Mozzetti et al., 2008; Stengel et al., 2009). None of these integration sites, however, appears to cause mono- or oligoclonality on its own, because even in tertiary transplants the vast majority of clones detected with insertions into or near these genes were detected in the context of polyclonal repopulation. Therefore, a confounding role of the intensive chemotherapy applied has again to be considered.
Given the number of transplanted cells and the low initial transduction efficiency a remarkable high number of insertion clones contributing to long term hematopoiesis was observed in our study. Based on single cell transplant studies which estimate the frequency of HSCs in murine BM at approx. 2000 cells/animal (Ema et al., 2006; Yamazaki and Nakauchi, 2009) at most 20–40 transduced HSC clones could be expected in our primary recipients. This clearly is exceeded by the 197 unique integration sites detected in our tertiary recipients, which were all derived from the same primary mouse. While transgene silencing with lack of GFP expression in individual clones or multiple integrations occurring in individual HSCs may explain this discrepancy to some extent, the most intriguing explanation is provided by a recent study combining vector-barcoding and a sequencing-based detection system for clonal analysis of transduced murine hematopoiesis (Gerrits et al., 2010). In this study, the authors detected 19 to 30 individual vector-tagged clones in the peripheral blood of animals 17 to 33 weeks after transplantation of retrovirally transduced BM cells. However, only a minority of these clones represented “dominant clones” also detectable by conventional methods such as Southern blotting, inverse PCR, or LM-PCR. The majority of clones represented “minor clones” that contributed to hematopoiesis only marginally and at selected time points. Gerrits et al. (2010) even conceded that due to a lack of sequencing depth they probably underestimated these minor clones. When speculating on the biologic identity of these clones, they introduced the idea that these clones may represent functionally defined HSC subtypes with a clonal cellular output not sufficient to reach the commonly used threshold criteria for repopulation. In the light of these data, the number of 2000 HSCs per mouse BM may grossly underestimate the total number of clones that are capable of at least temporary contribution to long-term hematopoiesis and can therefore be detected by linker-mediated (PCRs) (LM/LAM-PCR) and highly sensitive deep sequencing approaches. This concept supports earlier data from Abkowitz et al. (2002), who combined 59Fe distribution studies and limiting-dilution competitive transplantation assays to calculate total HSC numbers per mouse at 11,000–22,000.
In our study monoclonality was discovered using LM-PCR in combination with next-generation sequencing (pyrosequencing) (Margulies et al., 2005). We show that this novel technique enables high-throughput sequencing of LM-PCR–recovered amplicons (Wang et al., 2007) and, based on counting individual insertion site sequence reads, has the potential to provide a semiquantitative image of individual clonal contributions. The approach has also been applied in recent clinical gene therapy studies (Cartier et al., 2009; Boztug et al., 2010). However, when measuring contributions of two nondominant clones, we saw that read count analysis considerably underestimated clonal contributions. Here, several so far not identified factors may influence the number of LM-PCR–recovered fragments and novel comprehensive mathematical models will have to be established for determining exact clone copy numbers. Nevertheless, our data clearly point out the enormous potential of this novel technology.
In this context it is important to point out that sequence-read recovery rates are, beside other factors, potentially massively influenced by post-restriction fragment sizes. Thus, en route to find the optimal constellations for thorough and reliable quantitative assessment of clonality using pyrosequencing read counts, the use of multiple restriction enzymes that deliver small fragments will be indispensable. In this regard, a recent study showed that only 10% of all integrations are accessible in the genome if an enzyme with CG motifs is used, whereas a combination of two or more enzymes with non-CG motifs can increase the portion of the accessible genome to more than 80% (Gabriel et al., 2009). To address this problem, we employed a mix of three different enzymes, including two 4-cutters with high genomic recognition site coverage (Tsp509I and RsaI). Of note, this approach enabled us to recover the Usp10 fragment, which would have not been detected with a rare-cutting enzyme such as PstI.
Footnotes
Acknowledgments
We thank Sigrid Heil, Hans-Jürgen Engel, Bernhard Berkus (former G402 lab), and Kristin Simon (G360 lab) of the German Cancer Research Center (DKFZ) for skillful technical assistance and Anne Arens and Stephan Wolf of the DKFZ Core Facility for assistance with 454 sequencing, and we are grateful to Ute Modlich (Department of Experimental Hematology, Medizinische Hochschule Hannover) for extremely helpful discussion and suggestions during manuscript revision. Blake Hale and Mohammed Abba are acknowledged for editorial advice. This work was supported by the SPP1230 of the Deutsche Forschungsgemeinschaft through grants FR1732/3-2 (S.F.), RO3500/1-1,2 (I.R.) MO 886/3-1 (T.M.), and Cluster of Excellence REBIRTH (Exc 62/1; T.M.); grant 0315-452-C of the Federal Ministry of Education and Research (F.G., S.F, H.A., S.L), grant 106434 of Deutsche Krebshilfe (T.M.), and grants of the Stiftung Krebs- und Scharlachforschung Mannheim (F.G., S.L.) and the Prof. Dr. Karl und Gerhard Schiller Foundation (F.G., S.L.). F.G. is sponsored by the Peter and Traudl Engelhorn Foundation.
Author Disclosure Statement
The authors declare that there are no conflicts of interest in this work.
References
Supplementary Material
Please find the following supplemental material available below.
For Open Access articles published under a Creative Commons License, all supplemental material carries the same license as the article it is associated with.
For non-Open Access articles published, all supplemental material carries a non-exclusive license, and permission requests for re-use of supplemental material or any part of supplemental material shall be sent directly to the copyright owner as specified in the copyright notice associated with the article.