
Abstract
RNA interference (RNAi) has become the cornerstone technology for studying gene function in mammalian cells. In addition, it is a promising therapeutic treatment for multiple human diseases. Virus-mediated constitutive expression of short hairpin RNA (shRNA) has the potential to provide a permanent source of silencing molecules to tissues, and it is being devised as a strategy for the treatment of liver conditions such as hepatitis B and hepatitis C virus infection. Unintended interaction between silencing molecules and cellular components, leading to toxic effects, has been described in vitro. Despite the enormous interest in using the RNAi technology for in vivo applications, little is known about the safety of constitutively expressing shRNA for multiple weeks. Here we report the effects of in vivo shRNA expression, using helper-dependent adenoviral vectors. We show that gene-specific knockdown is maintained for at least 6 weeks after injection of 1 × 10¹¹ viral particles. Nonetheless, accumulation of mature shRNA molecules was observed up to weeks 3 and 4, and then declined gradually, suggesting the buildup of mature shRNA molecules induced cell death with concomitant loss of viral DNA and shRNA expression. No evidence of well-characterized innate immunity activation (such as interferon production) or saturation of the exportin-5 pathway was observed. Overall, our data suggest constitutive expression of shRNA results in accumulation of mature shRNA molecules, inducing cellular toxicity at late time points, despite the presence of gene silencing.
Introduction
The liver is a crucial tissue implicated in the control of glucose and lipid homeostasis, and the target tissue for functional studies directed at studying the molecular mechanisms leading to prevalent conditions such as type 2 diabetes, metabolic syndrome, and cardiovascular disease. Adenoviruses are highly efficient vectors for delivery of genes into the liver. The feasibility of silencing gene expression in animal models, using this vector system, has been shown in multiple studies (Xia et al., 2002; Taniguchi et al., 2005; Narvaiza et al., 2006). Nevertheless, all these studies used first-generation (E1-deleted) adenoviral vectors, which are highly hepatotoxic at high doses and immunogenic, leading to clearance of transduced cells (Yang et al., 1994; Morral et al., 1997). In addition, these vectors express VA1 noncoding RNA, which inhibits microRNA processing by interfering with nuclear export and Dicer functionality (Lu and Cullen, 2004). The use of helper-dependent adenoviral vectors (also known as “gutless” or high-capacity vectors), devoid of viral genes, has been shown to overcome these problems (Schiedner et al., 1998; Morral et al., 1999; O'Neal et al., 2000). Helper-dependent adenoviruses conserve the advantages of early-generation adenovirus vectors, including high-efficiency in vivo transduction and high-level transgene expression, with the added features of long-term gene expression and negligible cytotoxicity at high doses. We have previously shown 75–90% gene silencing in short-term in vivo experiments (Witting et al., 2008; Ruiz et al., 2009).
Despite the enormous potential of RNAi as a therapeutic treatment and as a tool in functional studies, unintended interactions between the silencing molecule and cellular components occur (known as nonspecific effects). Administration of high doses of siRNA can result in nonspecific events due to activation of innate immune responses such as the interferon response, through poorly understood molecular mechanisms (Robbins et al., 2008). Induction of this response is siRNA concentration dependent (Persengiev et al., 2004) and cell type dependent (Reynolds et al., 2006), which indicates that data generated in one cell type may not apply to a different one, and that studies need to be conducted in the cell/tissue of interest. In addition, it has been shown that cells have a limited capacity to process shRNA, and that oversaturation of the exportin-5 pathway (necessary to transport shRNA to the cytoplasm) by high-level shRNA expression results in downregulation of endogenous microRNAs, inducing cell death (Grimm et al., 2006). Our studies have shown that constitutive expression of shRNA induces interferon responses in a sequence and adenovirus dose-dependent manner (Witting et al., 2008). Altogether these data clearly indicate that the successful establishment of RNA interference as a universal tool to study gene function and for clinical applications requires a better understanding of shRNA processing in vivo.
We have reported that it is possible to express shRNA from the U6 promoter and to induce gene silencing in liver for up to 3 weeks in the absence of interferon responses (Ruiz et al., 2009). To study the feasibility of constitutively expressing shRNA for multiple weeks, we analyzed the impact on target gene expression, endogenous microRNA levels, as well as expression of interferon-responsive genes. Our data suggest that constitutive shRNA expression results in effective processing of hairpin molecules. Nevertheless, mature hairpin molecules accumulate to an extent that eventually induces cellular toxicity.
Materials and Methods
Helper-dependent adenoviral vector production
Cloning and rescue of helper-dependent adenoviral vectors gAd.shSREBP1, gAd.shSCR, and gAd.NEC have been described previously (Witting et al., 2008; Ruiz et al., 2009). All these vectors are based on serotype 5 adenovirus, which transduces hepatocytes efficiently (Stratford-Perricaudet et al., 1990) and can infect hepatic stellate cells (Inagaki et al., 2005) and macrophages (Wheeler et al., 2001), but poorly transduces sinusoidal endothelial cells (Hegenbarth et al., 2000). Large-scale preparations of these three vectors were obtained in 293Cre4 cells (Microbix Biosystems, Toronto, ON, Canada) (Parks et al., 1996), following a previously described protocol (Ruiz et al., 2009). Briefly, 293Cre4 cells grown at 95% confluency in 15 triple flasks (500 cm2; 5–7 × 10⁷ cells per flask) were infected with helper-dependent vector at a multiplicity of infection (MOI) of 3 and with helper H14 at an MOI of 2. Cells were incubated at 37°C in a 5% CO2 atmosphere, and were harvested in the presence of >90% cytopathic effect (CPE). The virus was purified by one CsCl step gradient centrifugation followed by one CsCl isopycnic separation. The helper-dependent adenovirus band was collected and dialyzed in TMN buffer (10 mM Tris-HCl [pH 7.5], 1 mM MgCl2, 150 mM NaCl, 10% glycerol). Total viral particles were determined spectrophotometrically after particle disruption with 0.1% sodium dodecyl sulfate (SDS) (absorbance at 260 nm [A 260] = 1 corresponds to 1.1 × 10¹² viral particles/ml). Stocks were stored at −80°C and diluted in TMN buffer for in vivo administration.
Animals
Male 8-week-old C57BL/6J mice were obtained from Jackson Laboratory (Bar Harbor, ME). Animal care guidelines set forth by the Indiana University School of Medicine (Indianapolis, IN) were followed. Mice were kept in a BL2 facility and had access to standard chow and water ad libitum. Mice received 1 × 10¹¹ viral particles (VP) of gAd.shFABP5, gAd.shSREBP1, gAd.shSCR, gAd.NEC, or vehicle in a volume of 250 μl, by tail vein injection. Animals were killed at the times indicated in text. Livers were collected and snap-frozen in liquid nitrogen or fixed in 10% formalin buffer for histological analysis. Serum was obtained and frozen at −20°C.
Alanine aminotransferase test
Serum alanine aminotransferase was tested with a liquid ALT (SGPT) reagent set (Pointe Scientific, Canton, MI). Twenty microliters was used for the analysis, in accordance with the manufacturer's instructions.
Western blotting
Liver protein extracts were generated by tissue homogenization in radioimmunoprecipitation assay (RIPA) buffer containing protein inhibitors (50 mM Tris, 150 mM NaCl, 1 mM EDTA, 0.25% [w/v] deoxycholate, 1% Triton X-100, 1 mM phenylmethylsulfonyl fluoride [PMSF], aprotinin/leupeptin/pepstatin [1 μg/ml]; pH 7.5). Protein concentration was measured with a bicinchoninic acid (BCA) kit (Pierce, Rockford, IL). Forty micrograms of protein was loaded in 10 or 15% SDS–polyacrylamide Criterion gels (Bio-Rad, Hercules, CA) and transferred to 0.2-μm polyvinylidene difluoride (PVDF) membranes. Blocking was performed in TBS-T (20 mM Tris, 150 mM NaCl, 0.1% Tween 20; pH 7.5) with 5% blocking-grade milk (Bio-Rad). Primary antibodies against sterol regulatory element binding protein-1 (SREBP1) (Santa Cruz Biotechnology, Santa Cruz, CA), Eri-1 (Santa Cruz Biotechnology), fatty acid binding protein-5 (FABP5) (R&D Systems, Minneapolis, MN), α-tubulin (Millipore, Temecula, CA), and cyclophilin-40 (Abcam, Cambridge, MA) were diluted in blocking solution and incubated for 2 hr at room temperature (α-tubulin) or overnight at 4°C (SREBP-1, Eri-1, FABP5, and cyclophilin 40). Secondary antibody incubations were carried out for 1 hr at room temperature. Blots were developed with an enhanced chemiluminescence (ECL) kit (Thermo Fisher Scientific, Waltham, MA) and exposed to enhanced chemiluminescence film (GE Healthcare, Piscataway, NJ).
RNA isolation and Northern blot analysis
RNA was isolated from approximately 100 mg of frozen liver tissue, using a mirVana RNA isolation kit (Ambion, Austin, TX) according to the manufacturer's instructions. mRNA and microRNA (miRNA)-enriched RNA fractions were obtained. RNA concentration was determined by light absorption at 260 nm (A 260), using a NanoDrop 2000 spectrophotometer (Thermo Scientific, Waltham, MA). Six micrograms of miRNA-enriched RNA was heated for 5 min at 95°C. Samples were separated on 15% TBE–urea gels (Bio-Rad), transferred to Hybond N+ membranes (GE Healthcare) at 10 V for 1.5 hr, and UV-cross-linked with a Stratalinker 2400 (Stratagene/Fisher Scientific, La Jolla, CA). Sequences of the DNA oligonucleotide probes used are shown in Table 1. RNA oligonucleotides with the sequence of the precursor shRNA (50-nucleotide) sequence, or the mature SREBP (21-nucleotide) sequence, were used as controls to determine the size of the shRNA produced in vivo. For hybridization, DNA oligonucleotide probes (100 pmol) were labeled with digoxigenin-labeled deoxyuridine-triphosphate (DIG-dUTP), using a DIG oligonucleotide tailing kit, second generation (Roche Diagnostics, Mannheim, Germany). Membranes were prehybridized for 2 hr at 60°C. Probes were hybridized to membranes at 25°C overnight in a hybridization oven. After hybridization, membranes were briefly washed and incubated for 30 min in blocking solution. Blots were subjected to immunological detection, using anti-digoxigenin antibody conjugated to alkaline phosphatase (AP) (Roche Diagnostics). The signal was developed with a CSPD ready-to-use kit (Roche Diagnostics).
ISG56, interferon-stimulated gene 56; OAS1b, 2′,5′-oligoadenylate synthetase 1b; ISG20, interferon-stimulated gene 20; Aldo A, aldolase A; pSHL, shuttle plasmid for rescue of helper-dependent adenoviral vectors; GK, glucokinase; as, antisense; s, sense.
qRT-PCR
The mRNA-enriched fraction (described previously) was treated with RNase-free DNase (Qiagen, Germantown, CA) to remove contaminant DNA. The concentration of the RNA was determined in the NanoDrop 2000, and the A 260/A 280 ratio was between 1.9 and 2.1. mRNA quantification was performed by real-time RT-PCR, using a SYBR green Qiagen one-step RT-PCR kit (Qiagen, Valencia, CA) in accordance with the manufacturer's protocol. qRT-PCR was carried out with an ABI 7500 instrument (Applied Biosystems, Foster City, CA). Primer pairs were designed to bind different exons of the gene and amplify fragments of approximately 200 bp, and were first confirmed to yield a single band of the expected size by agarose gel electrophoresis, as well as a negative result in wells containing sample without reverse transcriptase (RT–). Primer pairs were synthesized by Invitrogen (Carlsbad, CA) and are described in Table 1. A standard curve was generated with serial dilutions of an RNA sample from a vehicle-treated mouse (200 ng down to 6.25 ng). Test samples were diluted to 25 ng/μl and quantification of mRNA levels was done by analyzing 50 ng of RNA, in duplicate, in a 50-μl reaction volume and using a 0.5 μM concentration of each primer. Threshold cycle (C t) values were compared with those of the standard curve. Aldolase A was used as loading control gene. This gene was selected on the basis of the absence of statistically significant differences between the groups. Fold changes are expressed relative to the gAd.NEC-treated group. This group was used as reference after confirming that levels of all genes analyzed were not significantly different from the vehicle-treated group (data not shown). All gAd.NEC, gAd.shSREBP1, and gAd.shSCR samples were analyzed in the same 96-well plate.
Microarray analysis
Samples (three per group) were labeled as per the standard Affymetrix protocol for the WT sense target labeling and control reagents kit according to the Affymetrix user manual GeneChip Whole Transcript (WT) Sense Target Labeling Assay. Individual labeled samples were hybridized to the GeneChip Mouse Gene 1.0 ST array for 17 hr and then washed, stained, and scanned according to the standard protocol, using the Affymetrix GeneChip operating system (GCOS). GCOS was used to generate data (CEL files). Arrays were visually scanned for abnormalities or defects. CEL files were imported into the Partek genomics suite (Partek, St. Louis, MO). RMA (robust multichip average) signals were generated for the core probe sets, using the RMA background correction, quantile normalization, and summarization by median polish. Summarized signals for each probe set were log2 transformed. These log-transformed signals were used for principal components analysis, hierarchical clustering, and signal histograms to determine whether there were any outlier arrays. Untransformed RMA signals were used for fold change calculations. Data were analyzed by one-way analysis of variance (ANOVA), using log2-transformed signals with treatment as factor and all possible contrasts made. Fold changes were calculated using the untransformed RMA signals. Gene expression comparisons were made between shSCR (scrambled shRNA sequence) versus NEC control and shSREBP1 (shRNA knocking down SREBP1 expression) versus NEC control, and only genes changing in the same direction in both comparisons with p < 0.01 and false discovery rate < 0.05 were considered. A total of 2016 genes were upregulated and 577 were downregulated. To identify pathways/processes in which these genes are implicated, 1.5-fold upregulated genes (868) and 1.5-fold downregulated genes (216) were classified by functional annotation clustering (NIH DAVID [Database for Annotation, Visualization, and Integrated Discovery] database; Huang et al., 2009) and a medium- or high-stringency level. Only clusters with an enrichment score ≥1.3 were considered.
Vector genome copy number
Genomic DNA was extracted from approximately 100 mg of frozen tissue, using a Qiagen genomic kit. Helper-dependent adenoviral vector genome copy number was quantified by real-time PCR, using an ABI 7500 instrument (Applied Biosystems) and a power SYBR green kit (Applied Biosystems) in accordance with the manufacturer's protocol. Vector DNA quantification was done as previously described (Ruiz et al., 2009), using a 0.5 μM concentration of a primer pair specific to the backbone sequence in the helper-dependent vector genome, and primers specific to the glucokinase gene, used as loading control (Table 1). A standard curve was generated by spiking DNA, isolated from a mouse treated with vehicle, with known amounts of pSHL-GFP plasmid to generate a standard curve with 0.01, 0.1, 1, 10, and 100 copies per cell. DNA levels in standards and test samples were measured by analyzing 30 ng of DNA, in duplicate. After adjusting for glucokinase levels, the genome copy number of each sample was determined by regression analysis.
Histology
Four-micron-thick sections were cut from paraffin-embedded tissue and stained with hematoxylin and eosin for histological analysis. Processing and staining were performed at the Immunohistochemistry Core (IHC) at Indiana University Medical Center (Indianapolis, IN). Liver sections were analyzed by an experienced liver pathologist (R.S.) in a blinded fashion.
Statistical analysis
Numerical data represent means ± SD. Significant differences are defined as p < 0.05 by two-tailed, unpaired t test.
Results
Gene silencing is maintained over time
We have previously reported that administration of 1 × 10¹¹ VP of gAd.shFABP5 (expressing an shRNA to knock down fatty acid binding protein-5 [FABP5]) resulted in 75% gene silencing 1 week after vector administration (Witting et al., 2008). To study the feasibility of expressing shRNA for multiple weeks in liver, C57BL/6 mice were given 1 × 10¹¹ VP of gAd.shFABP5 or gAd.shSCR (expressing a scrambled sequence), and were killed after 1 or 8 weeks. A significant level of silencing was maintained at week 8 compared with week 1 (Fig. 1), suggesting it is possible to obtain stable knockdown with helper-dependent adenoviral vectors.
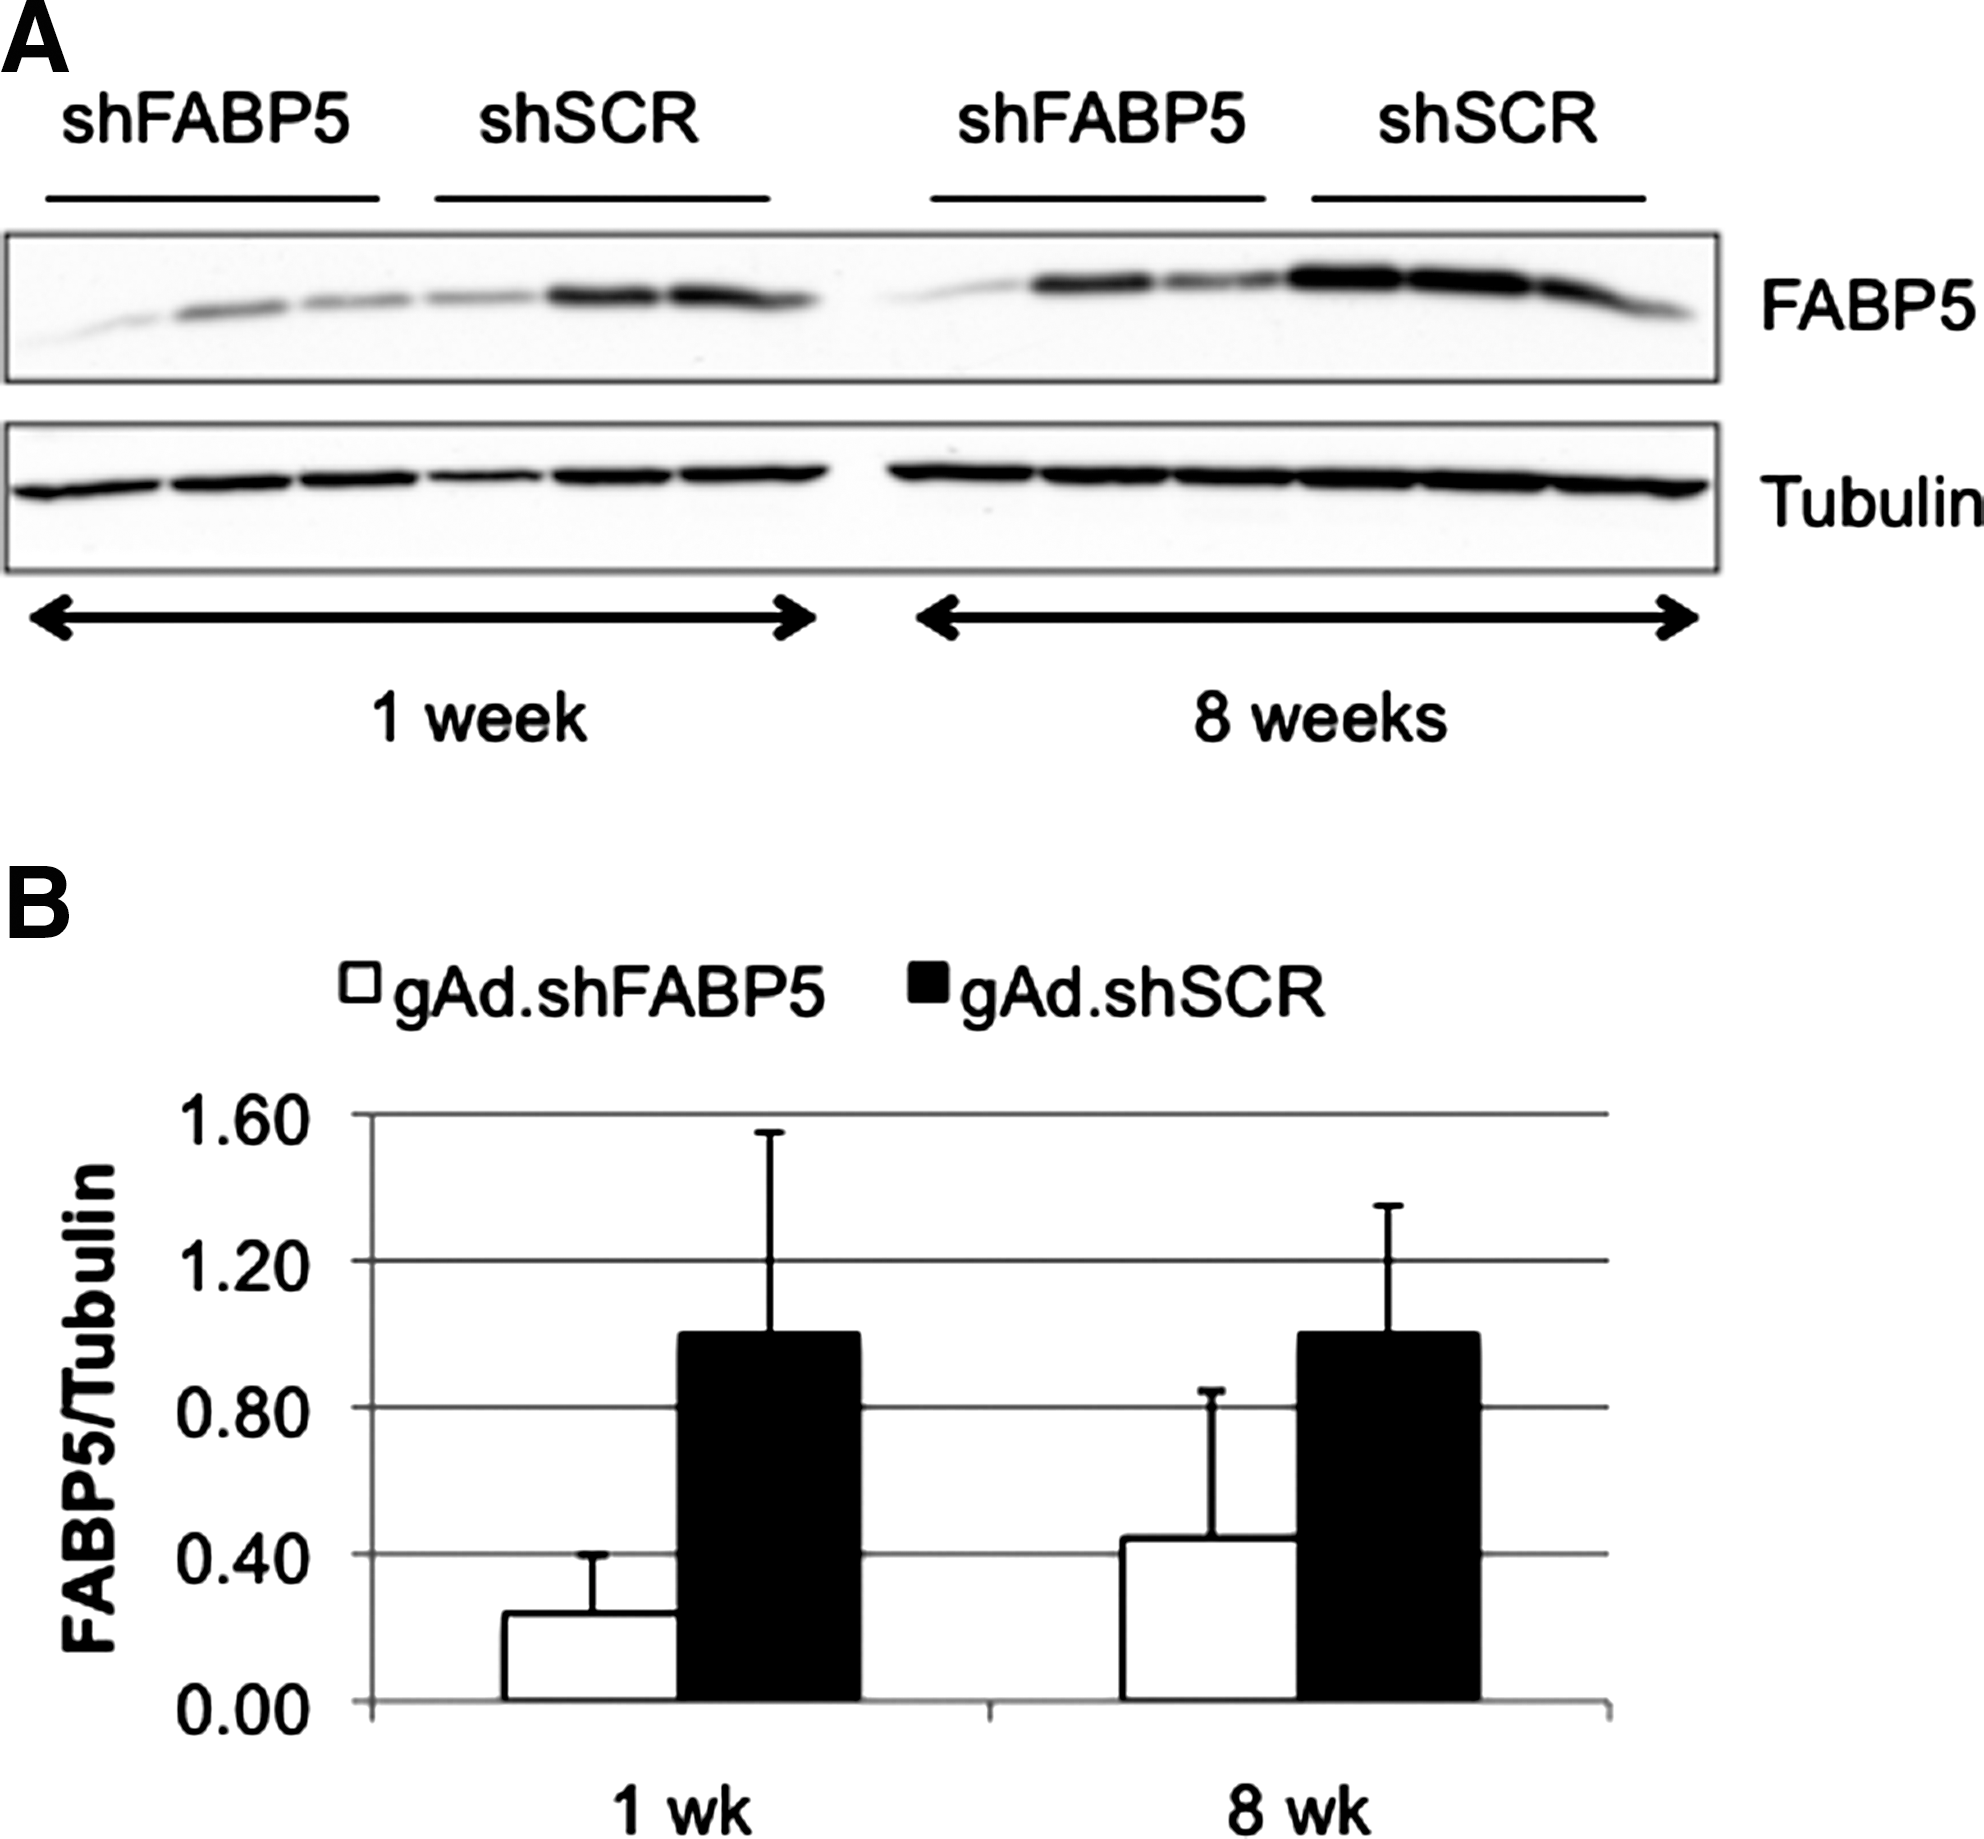
Gene silencing is maintained over time. Mice were given 1 × 10¹¹ VP of gAd.shFABP5 or gAd.shSCR intravenously (n = 3). Animals were killed 1 or 8 weeks later.
Constitutive shRNA expression leads to liver cell damage
To determine whether these observations were reproduced with a vector targeting a different gene and to study in more detail the effects of expressing shRNA for multiple weeks, C57BL/6 mice were injected 1 × 10¹¹ VP of gAd.shSREBP1 (expressing an shRNA to knock down the transcription factor sterol regulatory element binding protein-1 [SREBP1]) or gAd.shSCR. As controls for shRNA expression, groups of mice received gAd.NEC (no expression cassette) or vehicle. Mice were killed 1, 3, and 6 weeks postinjection. SREBP-1 knockdown was observed at weeks 1 and 3 and was maintained at week 6 (Fig. 2A). Surprisingly, quantification of adenoviral vector genome copy number revealed a significant decrease between weeks 3 and 6 with both shRNA-expressing vectors (gAd.shSCR and gAd.shSREBP1) (Fig. 2B). This correlated with an increase in ALT levels, a marker of liver damage (Fig. 2C). No difference in vector genome copy number was observed in animals treated with gAd.NEC, indicating the loss of vector DNA was not due to toxicity from the helper-dependent adenoviral vector itself, but was associated with shRNA expression.
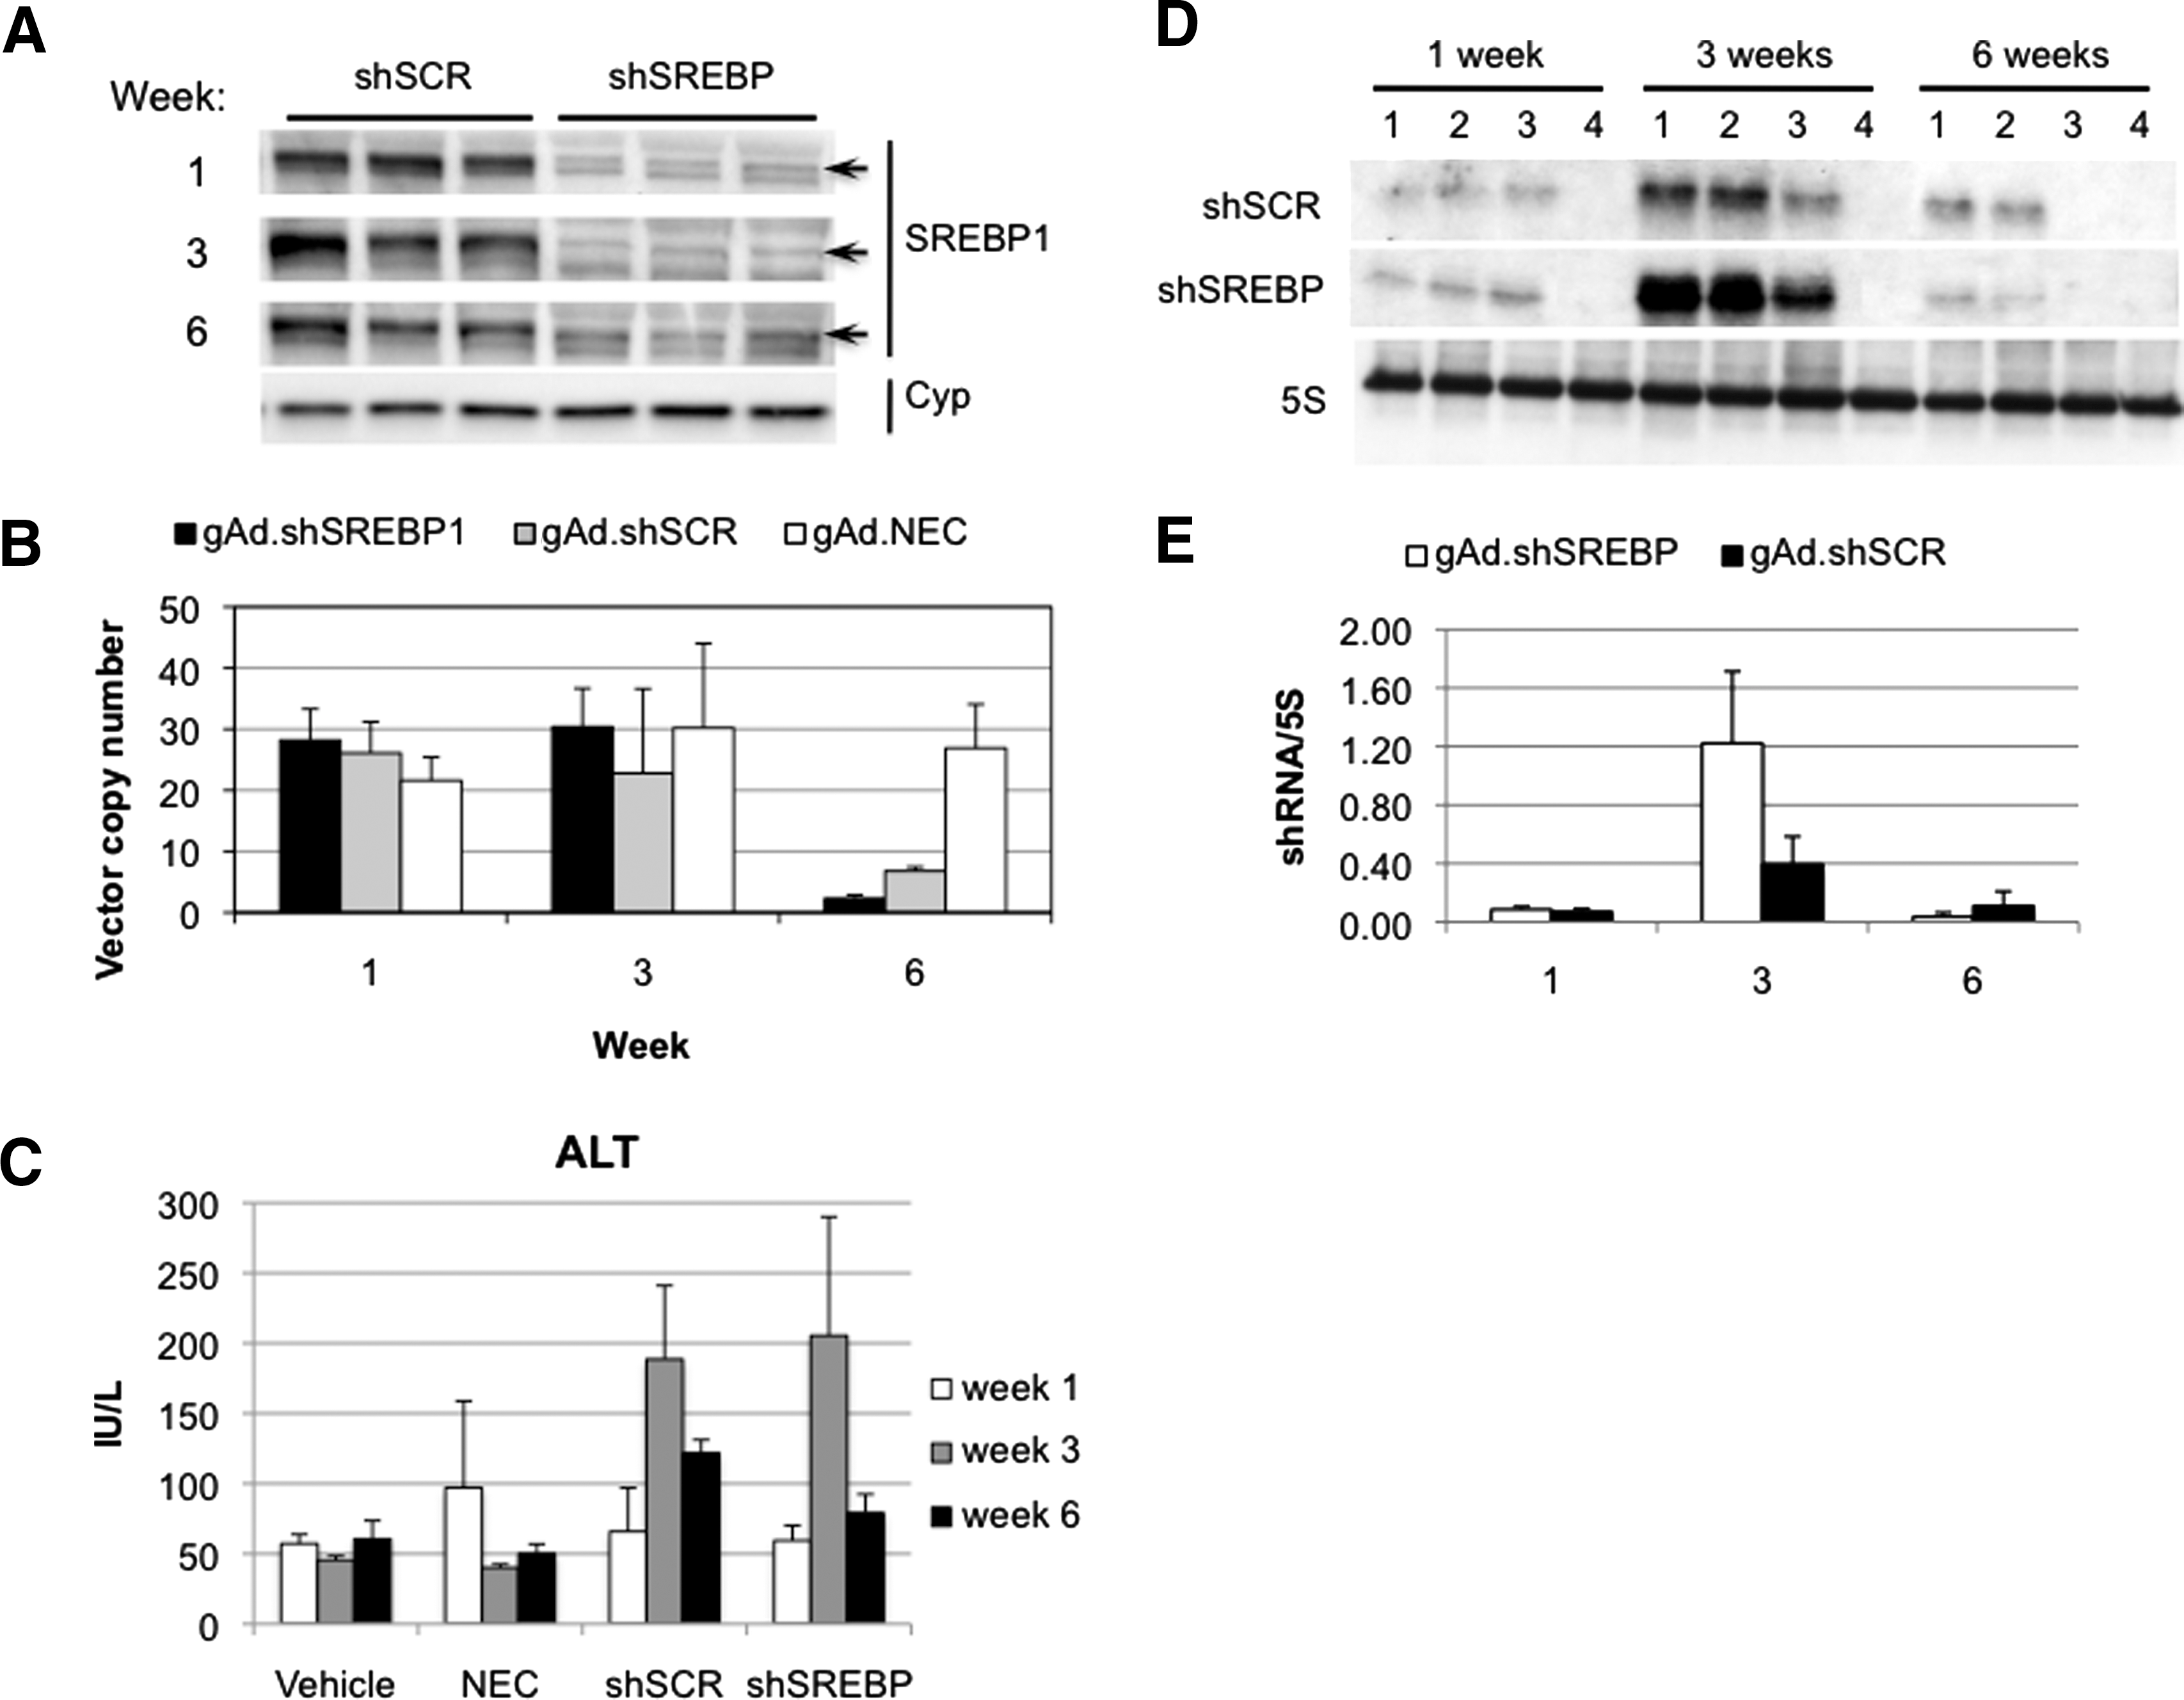
Long-term shRNA expression results in loss of vector genomes. Mice were given 1 × 10¹¹ VP of gAd.shSREBP1, gAd.shSCR, or gAd.NEC, or vehicle, intravenously and were killed 1, 3, and 6 weeks postinjection (n = 3).
Loss of vector DNA correlates with shRNA accumulation in the liver
To determine whether vector DNA correlated with level of shRNA, the microRNA-enriched RNA fraction was isolated and levels of shRNA present in the liver were quantified by Northern blot. Interestingly, shRNA levels increased between weeks 1 and 3 and decreased between weeks 3 and 6, correlating with the DNA levels (Fig. 2D and E). Similar results were seen for both shRNA-expressing vectors, regardless of whether the shRNA silenced a gene or not. The accumulation of shRNA between weeks 1 and 3 was surprising, as steady state expression is achieved within a few days after administration of a helper-dependent adenoviral vector expressing a transgene (Morral et al., 1998).
Loss of transduced hepatocytes is unrelated to saturation of the RNAi machinery
To study in more detail how this process occurs, mice were given 1 × 10¹¹ VP of gAd.shSREBP1, gAd.shSCR, or gAd.NEC, or vehicle, and killed weekly for 5 consecutive weeks. Mouse body weight did not change in any vector group compared with mice receiving vehicle (Fig. 3A), and none of the animals displayed any signs of sickness or discomfort, indicating that the presence of shRNA-related toxicity in liver did not result in fulminant hepatitis, as had previously been described for adeno-associated virus (AAV)-mediated shRNA expression (Grimm et al., 2006). As previously observed, shRNA accumulation was observed over weeks 1 to 4, and then levels declined gradually (Fig. 3B). This correlated with ALT levels, suggesting liver cell death (Fig. 3C). McBride and colleagues (2008) have shown that expression of shRNA in the brain, using the U6 promoter, leads to toxicity as the result of accumulation of unprocessed hairpin molecules. Contrary to what has been observed in the brain, unprocessed molecules were not detectable in the liver (Fig. 3D). Only mature molecules of the expected 21-nucleotide molecular mass were detected (Fig. 3D), indicating that a mechanism of unprocessed shRNA was unlikely in our study. A second possible cause of toxicity was saturation of the exportin-5 pathway, inducing endogenous microRNA dysregulation and eventually cell death, as previously reported by Grimm and colleagues (2006). Levels of miR-122, a liver-expressed miRNA, were not different in expression among treatments and time points (Fig. 3E), suggesting that processing of constitutively expressed shRNA did not saturate exportin-5.

shRNA expression elicits buildup of molecules over time. Mice were administered 1 × 10¹¹ VP of gAd.shSREBP1, gAd.shSCR, or gAd.NEC, or vehicle, and were killed weekly for 5 weeks (n = 3).
Constitutive expression of shRNA induces cell death without interferon response activation
To test whether the accumulation of shRNA on week 3 stimulated the cellular antiviral defense pathway, interferon-stimulated genes (ISGs) Oas1b and Isg56, were analyzed by real-time RT-PCR. OAS1 (oligoadenylate synthetase-1) induces degradation of RNA through activation of RNase L and subsequent inhibition of protein synthesis (Sledz and Williams, 2004), and ISG56 functions as a suppressor of viral replication and protein translation (Terenzi et al., 2006). Oas1b and Isg56 levels were not different between the gAd.NEC and vehicle groups (data not shown). No increase was observed between the gAd.shSREBP1 or gAd.shSCR group and the gAd.NEC-treated mice, at any of the time points (Fig. 4). This suggested that the interferon response was not activated in shRNA-expressing mice.

Interferon-stimulated gene (ISG) expression. Mice were treated as described in Fig. 3. Expression levels of two ISG genes, ISG56 and Oas1b, were quantified by real-time RT-PCR. No increase was observed in the gAd.shSREBP and gAd.shSCR groups compared with the gAd.NEC group.
Exonuclease Eri-1 (enhanced RNAi) has been reported to have negative regulatory effects on RNAi (Gabel and Ruvkun, 2008). Eri-1 can degrade the 3′ end of siRNA and histone mRNA in Caenorhabditis elegans, humans, and fission yeast (Hong et al., 2005; Gabel and Ruvkun, 2008). Administration of high doses of siRNA induces Eri-1 expression in mice (Hong et al., 2005). Thus, we tested whether Eri-1 expression was upregulated in mice expressing shRNA. No increase in Eri-1 mRNA or protein was observed in the gAd.shSREBP or gAd.shSCR group at any time point (Fig. 5).
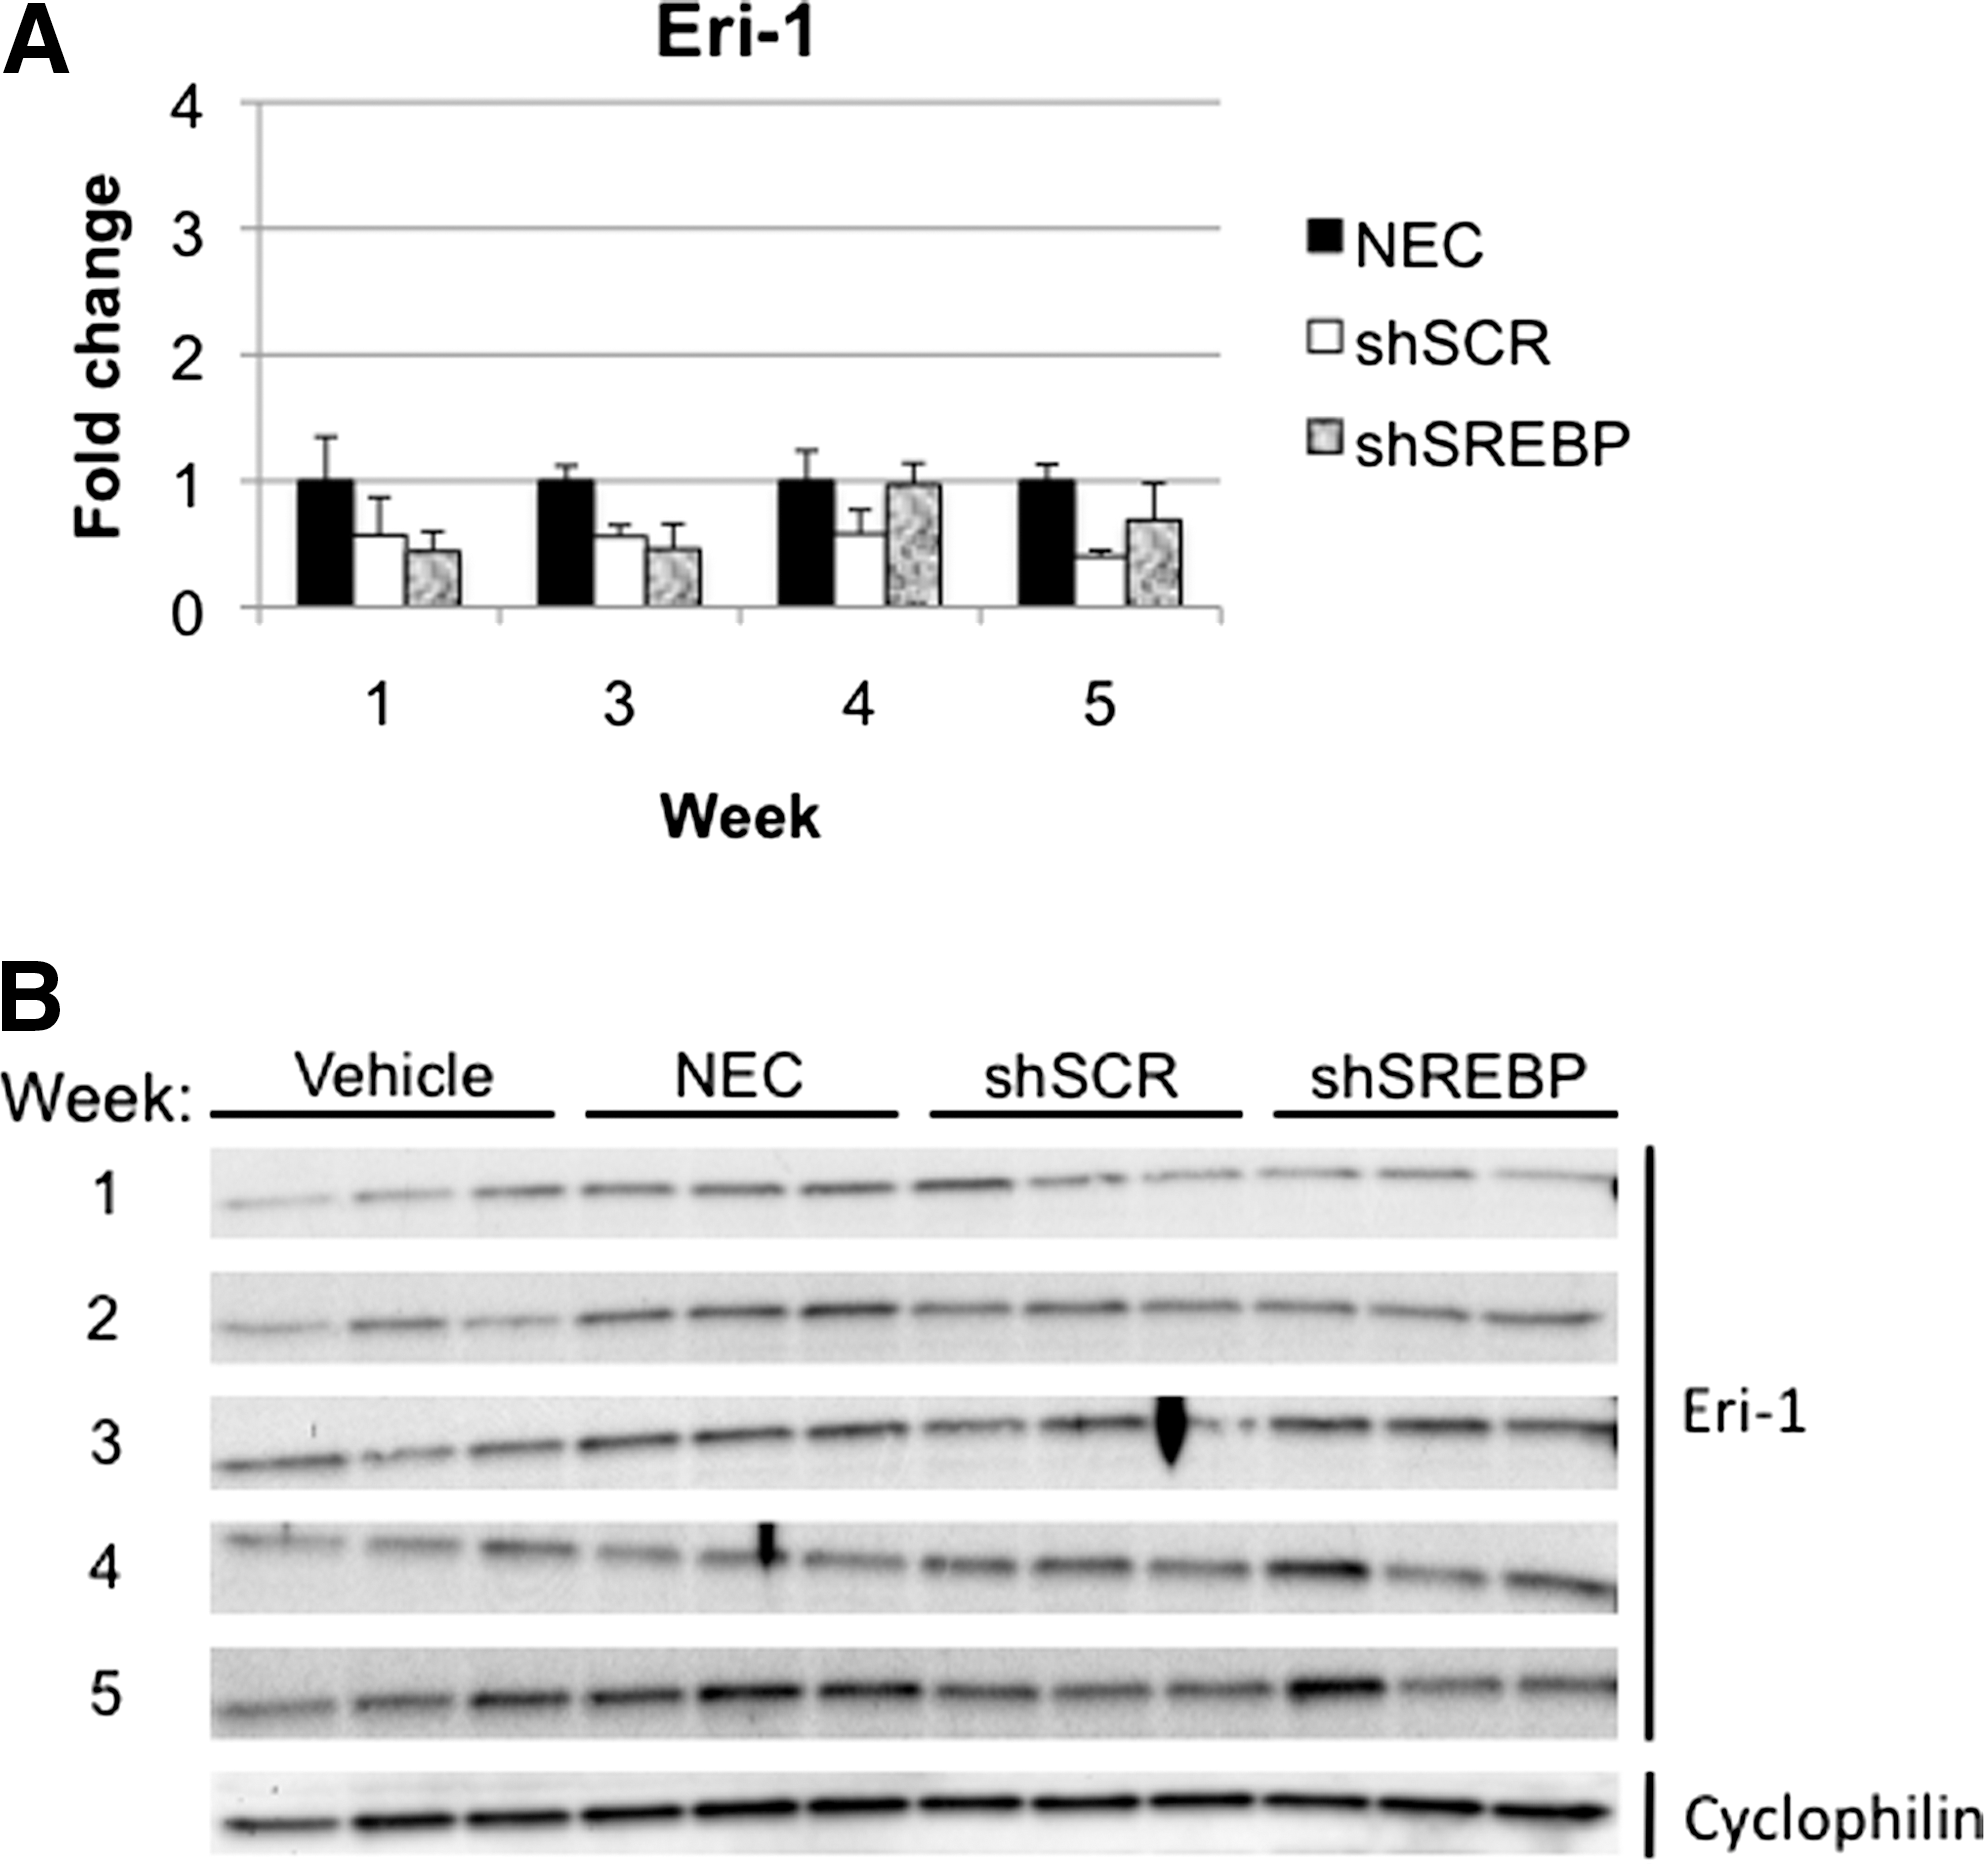
Eri-1 gene and protein analysis. Mice were treated as described in Fig. 3.
To determine whether the toxicity correlated with the presence of inflammation, liver sections were stained with hematoxylin–eosin and analyzed by a liver pathologist in a blinded fashion. In agreement with the absence of positive data on the interferon response, no significant inflammation was observed in any of the groups at any time point (Fig. 6). Instead, there was evidence of cellular toxicity, manifested as enlarged hepatocytes that contained pale, ground glass cytoplasmic inclusions. This cellular change was accompanied by numerous apoptotic bodies without accompanying inflammation. Although mitotic figures were present, apoptotic activity outstripped mitotic activity. These histological changes were first observed at a low level at week 3 and involved hepatocytes around the central veins. At weeks 4 and 5, the changes involved increasing numbers of hepatocytes, extending outward toward the portal tracts. The change was both more prominent and more extensive in the gAd.shSREBP1 mice than in the gAd.shSCR animals, extending further out toward the portal tracts in the former group. At week 5, the gAd.shSREBP1 mice showed prominent oval cell proliferation around the portal tracts (Fig. 6). Oval cells are stem cells of the liver that proliferate when the capacity of hepatocytes to divide has been exhausted (Oh et al., 2002). Overall, these observations suggest a process of cellular damage triggered by accumulation of mature shRNA molecules. The more extensive damage in mice that received gAd.shSREBP compared with mice that received gAd.shSCR most probably resulted from the higher accumulation of shRNA in the former animals between weeks 1 and 3 (Fig. 3B). This in turn led to oval cell proliferation as the proliferative capacity of damaged hepatocytes was depleted.
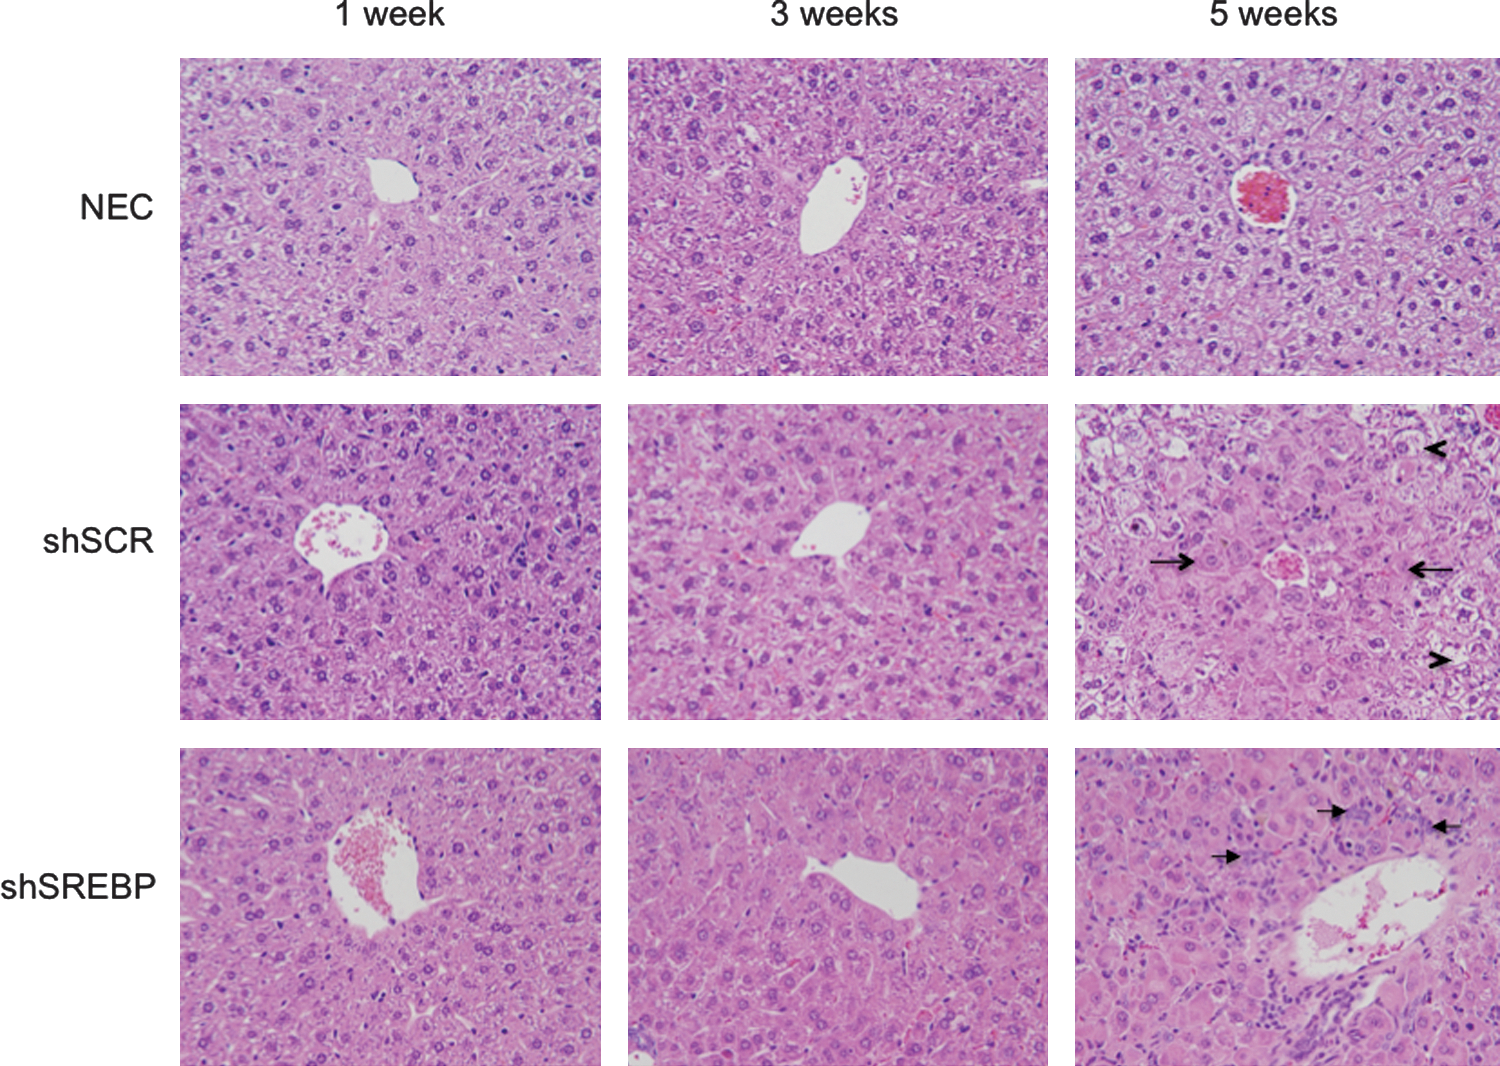
Histology of mouse liver sections. Mice were treated as described in Fig. 3. Liver sections were stained with hematoxylin–eosin and analyzed by a liver pathologist. Panels display the central vein area. In gAd.shSCR-treated liver, dense cells suggestive of having cellular toxicity are denoted by arrows, and normal cells are identified by arrowheads. In animals that received the gAd.shSREBP vector, dense cells were observed almost everywhere in the liver. Arrows indicate the presence of oval cells.
Microarray analysis suggests role of RNAi components in the pathology
To identify pathways that were altered from overexpressing shRNA, RNA was isolated from livers of mice that received the gAd.NEC, gAd.shSCR, or gAd.shSREBP1 vector and were killed at week 4. This time point was chosen because both groups were expected to have alterations in gene expression induced by shRNA toxicity. We did not observed upregulation of interferon-induced genes (including ISG20, OAS1, and ISG56, which we had previously found highly upregulated when sequences that induce an interferon response are expressed in liver; Witting et al., 2008), confirming that the response is distinct from well-characterized mechanisms of toxicity (Witting et al., 2008). In accordance with the protocol established by Huang and colleagues (2009), functional annotation clustering was performed. This type of analysis organizes redundant/similar/hierarchical terms within a group and allows the investigator to focus on multiple redundant clusters at a glance (Huang et al., 2009). The downregulated genes gave clusters that contained two classes of genes: ribosomal and mitochondrial (Table 2; the full gene list is available on request). Functional annotation clustering for upregulated genes gave clusters in the following categories: cell division (mitogen-activated protein kinase [MAPK] pathway, cytoskeleton organization, cell cycle/growth arrest); endosomal vesicle formation; intracellular protein transport; chromatin-remodeling genes (such as Baz2a, a gene shown to inhibit ribosomal RNA [rRNA] synthesis; Zhou et al., 2002); ubiquitination; gene silencing; helicase activity (Table 3; the full gene list is available on request). Genes in more than one of these categories were expected to be dysregulated in the livers of gAd.shSCR- and gAd.shSREBP1-treated mice, given the presence of cell death/division in liver sections (Fig. 6). Interestingly, we observed that several genes in the RNAi pathway were upregulated. Previous studies have shown that siRNA transfection leads to increased expression of TNRC6 (trinucleotide repeat-containing-6), a component of the miRNA pathway (Khan et al., 2009). Our microarray data suggest a possible model in which constitutive expression of shRNA induced expression of molecules of the RNAi pathway such as Dicer1, Mov10, Tnrc6b, and Cnot1. Upregulation of these molecules may have initiated a cascade of events through increased recruitment of cellular mRNA–RISC complexes for mRNA degradation, inducing alterations in cellular mRNA levels incompatible with normal function, and causing cell death.
Discussion
The speed and cost-effectiveness of in vivo gene silencing using viral vectors compared with generating knockout mice has made this system an essential tool to study gene function and in target validation. Several studies have shown the feasibility of this approach to silence liver genes, using AAV and adenoviral vectors (Giering et al., 2008; Hu et al., 2009; Ruiz et al., 2009). We have previously shown that hepatic shRNA expression, using helper-dependent adenoviral vectors, is a feasible approach, and approximately 75–90% gene specific knockdown can be obtained in short-term experiments (1 to 3 weeks) (Witting et al., 2008; Ruiz et al., 2009). In addition, hepatic shRNA expression has the potential to become a treatment for human diseases such as hepatitis B and C virus infection (McCaffrey et al., 2002; Chen et al., 2007). However, the safe application of RNAi as a therapeutic intervention and in functional studies remains an issue, as little is known about the side effects induced by constitutive expression of shRNA in vivo.
A previous study investigated the feasibility to use first-generation adenoviral vector-mediated shRNA expression in gene-silencing studies (Narvaiza et al., 2006). This type of vector results in activation of cytotoxic T lymphocyte responses, and clearance of transduced cells occurs soon after vector administration (Yang et al., 1994). Thus, expression of shRNA is expected to be transient and gradually decline as cells are cleared. Expression of shRNA peaked on day 7 and declined afterward, with small amounts of shRNA still being detectable after 150 days (Narvaiza et al., 2006). Target gene silencing was observed for only 12 days (Narvaiza et al., 2006). In contrast, transduction of liver cells by helper-dependent adenoviral vectors results in long-term gene expression (Morral et al., 1999). Thus, shRNA expression with this type of vector is expected to be maintained over time. In the present study we have shown that shRNA expression levels accumulate over a period of 3–4 weeks. Although transient toxicity was induced after this time point, resulting in loss of vector genomes and a subsequent reduction in shRNA levels, gene silencing was maintained for at least 6 weeks. This observation suggests that low amounts of processed shRNA are needed to obtain silencing. It is interesting that in the study by Narvaiza and colleagues, despite the low level of shRNA detection, no gene silencing was observed beyond 12 days. Given that each shRNA sequence has a different efficacy at silencing the target gene, it is possible that our construct was more efficacious than the one used by Narvaiza and colleagues (2006).
It is remarkable that shRNAs did not reach a steady state level by 7 days after vector administration, as occurs with transgene expression from constitutive promoters, but instead accumulated up to weeks 3 and 4. Three possible scenarios could be devised to explain the increase in shRNA levels after week 1. The first involves downregulation of the U6 promoter (used to express shRNA) on adenovirus entry in liver cells, and subsequent recovery to normal promoter activity after 2–3 weeks. If this scenario were true, the cellular U6 small nuclear RNA (snRNA) gene would also be dysregulated, and levels of this snRNA would gradually increase during weeks 2 and 3 compared with week 1, similar to what was observed with shSREBP1 and shSCR shRNAs. However, we did not observe differences in U6 snRNA levels between time points for any of the groups (data not shown). Thus, accumulation is unlikely to be related to U6 promoter activity. A second possibility is that shRNAs are amplified once the double-stranded RNA is formed in the cell, a mechanism that has been described in C. elegans and plants, and more recently in Drosophila (Aliyari and Ding, 2009; Lipardi and Paterson, 2009). siRNA amplification occurs as part of the antiviral response and is needed for RNAi in lower eukaryotes. However, dsRNA amplification has never been described in mammals, and the homologous RNA-dependent RNA polymerase (RdRP) required for amplification has not been identified. The third scenario involves multiple rounds of mRNA degradation by the same RISC–shRNA complex. In RNA reactions using HeLa S100 extracts, RISC–let-7 complexes are known to participate in at least 10 rounds of mRNA cleavage (Hutvagner and Zamore, 2002; Gregory et al., 2005). A single administration of siRNA in vivo maintains silencing in tissues for approximately 5–7 days. Thus, it would be expected that constitutive expression of shRNA combined with a multiple-turnover RISC–shRNA complex would lead to increasing levels of shRNA over the course of a few weeks. We believe this is the most plausible explanation to our observations. Future studies will include looking at effects of constitutive expression for multiple months to determine whether silencing can be maintained.
To look into the mechanism causing cellular toxicity, we observed that buildup of mature shRNA molecules occurred between weeks 1 and 4, regardless of whether the shRNA had a target (shSREBP) or not (shSCR) (Fig. 3B). Vector genome copy number was maintained during this time period, and declined afterward. This suggests excess mature hairpin molecules may have elicited a response that resulted in cell death. It is interesting that shRNA sequences without a target are also loaded into RISC and eventually can induce toxic effects similar to those elicited by shRNA molecules with a target mRNA. Higher loss of vector genomes (Fig. 2B) and more severe pathology profiles (including abundant numbers of oval cells around the portal tracts) were observed in the gAd.shSREBP1-treated animals compared with the gAd.shSCR group (Fig. 6). Whether this is related to the fact that the former has a gene target, and the latter does not, is unknown. A second possibility is that higher levels of shSREBP1 accumulated between weeks 1 and 3 (Figs. 2D and 3B), leading to more cellular damage.
We did not observe accumulation of precursor shRNA molecules or alterations in miR-122 levels (Fig. 3D and E), suggesting that exportin-5 and processing of the precursor shRNA to the cytoplasm were not limiting factors. Interferon-responsive genes were not upregulated (Fig. 4), and inflammatory cells were not present in the liver (Fig. 6), all of which suggest that activation of innate immunity was not the cause of cell death. We have previously observed a strong correlation between induction of an interferon response by shRNA and the presence of inflammation in liver (Witting et al., 2008). Lack of interferon-responsive gene expression was confirmed by microarray analysis of livers of mice killed at week 4. Data generated from this analysis suggest that shRNA expression upregulates genes involved in the RNAi pathway (Table 3). Three of these genes, Mov10, Tnrc6b, and Ccr4-Not1, are located in P-bodies (Table 3). The first two are associated with Argonaute (Ago) in mammalian cells and are required to mediate miRNA-guided mRNA cleavage (Meister et al., 2005). Mov10 is the human ortholog of Drosophila translational repressor Armitage, and has been shown to form a complex with RISC, eukaryotic translation initiation factor-6 (eIF6), and ribosomal proteins of the 60S subunit. eIF6 binds to 60S and inhibits assembly of the 60S and 40S ribosome for protein translation (Chendrimada et al., 2007). In neurons, Mov10 degradation has been shown to regulate synaptic plasticity through release of miRNA-mediated translationally repressed mRNA (Banerjee et al., 2009). Tnrc6b is one of three paralogs of GW182 in vertebrates (Ding and Han, 2007) and has been implicated in translational repression (Baillat and Shiekhattar, 2009). Last, Ccr4-Not is a protein present in P-bodies and is involved in mRNA decay through deadenylation (Behm-Ansmant et al., 2006). A model could be envisioned in which upregulation of several genes present in P-bodies may have triggered a cascade of events, starting with inappropriate levels of degradation of miRNA-regulated mRNAs, to a point incompatible with normal hepatocyte function, leading to cell death. Other studies have shown that shRNAs compete with endogenous miRNA for RNAi activity (Castanotto et al., 2007). In addition, saturation of molecules in the RNAi pathway has previously been shown to lead to toxicity (Grimm et al., 2006, 2010). Saturation of exportin-5 results in fulminant hepatitis (Grimm et al., 2006), and saturation of Ago proteins, in particular Ago-2, induces toxicity and cell death (Grimm et al., 2010). Increasing Ago-2 activity alleviates the toxicity and extends RNAi (Diederichs et al., 2008; Grimm et al., 2010). Nevertheless, Grimm and colleagues showed that the most efficient way to reduce cytotoxicity and prolong gene silencing was to use weaker promoters that resulted in lower levels of shRNA (Grimm et al., 2010). Kahn and colleagues have reported that transfection of small RNAs into cells results in increased expression of miRNA-regulated genes, likely through saturation of RNAi components downstream from exportin-5, such as Argonaute proteins and TRBP (HIV-1 trans-activating response [TAR] RNA
In conclusion, expression of shRNA from helper-dependent adenoviral vectors leads to a high level of silencing for multiple weeks in vivo. Despite silencing, expression of shRNA results in cellular apoptosis and loss of vector genomes, likely because of excess accumulation of mature shRNA molecules. Our data have implications for the safe design of shRNA expression cassettes, and argue for close monitoring for signs of toxicity at multiple time points. This is particularly important for studies in which cell death/survival is an outcome of the gene-silencing treatment. As also observed by other groups (Grimm et al., 2010), our data suggest that the development of future vectors should include expression cassettes with lower promoter strength or inducible systems, to provide safer tools for gene function studies, gene target validation, and for clinical applications.
Footnotes
Acknowledgments
This research was supported by grants from the National Institutes of Health (DK069432-01, DK078595); American Diabetes Association (1-08-RA-135); and INGEN (Indiana Genomics Initiative of Indiana University supported in part by Lilly Endowment Inc.). The authors thank Dr. Jeanette McClintick for assistance on microarray analysis, which was carried out using the facilities of the Center for Medical Genomics at Indiana University School of Medicine, supported in part by a grant from the Indiana 21st Century Research and Technology Fund, and by INGEN. Miwon Ahn was supported by the T32-Indiana University Diabetes and Obesity Research Training Program (DK064466), and Scott R. Witting by a postdoctoral fellowship from the American Heart Association.
Author Disclosure Statement
No competing financial interests exist.