
Abstract
Introducing therapeutic genes into hematopoietic stem cells using retroviral vector-mediated gene transfer is an effective treatment for monogenic diseases. The risks of therapeutic gene integration include aberrant expression of a neighboring gene, resulting in oncogenesis at low frequencies (10–7–10–6/transduced cell). Mechanisms governing insertional mutagenesis are the subject of intensive ongoing studies that produce large amounts of sequencing data representing genomic regions flanking viral integration sites (IS). Validating and analyzing these data require automated bioinformatics applications. The exact methods used vary between applications, based on the requirements and preferences of the designer. The parameters used to analyze sequence data are capable of shaping the resulting integration site annotations, but a comprehensive examination of these effects is lacking. Here we present a web-based tool for integration site analysis, called Methods for Analyzing ViRal Integration Collections (MAVRIC), and use its highly customizable interface to look at how IS annotations can vary based on the analysis parameters. We used the integration data of the previously published adenosine deaminase severe combined immunodeficiency (ADA-SCID) gene therapy trials for evaluation of MAVRIC. The output illustrates how MAVRIC allows for direct multiparameter comparison of integration patterns. Careful analysis of the SCID data and reanalyses using different parameters for trimming, alignment, and repeat masking revealed the degree of variation that can be expected to arise due to changes in these parameters. We observed mainly small differences in annotation, with the largest effects caused by masking repeat sequences and by changing the size of the window around the IS.
Introduction
MAVRIC (Methods for Analyzing ViRal Integration Collections; Horsman et al., 2011) automatically BLASTs (Basic Local Alignment Search Tool) input sequences according to user-specified parameters and returns information on the genes surrounding the viral integration site (IS). The analysis parameters used by MAVRIC can be set by the user, including repeat masking, minimum accepted sequence length, maximum Expect-value (E-value) threshold, the maximum distance from the IS to search for genes, and the ability to use previous versions of BLAST and older genome builds in Ensembl. Analysis of nearby gene expression levels using user-generated expression data is an additional option, with MAVRIC automatically generating binning charts. Users can upload viral or adapter sequence information such as long terminal repeats (LTRs) to be screened prior to analysis. This article outlines the design choices made in the process of developing tools for virus integration analysis and examines the differences obtained when analyzing the same dataset with different database builds and analysis methods.
Materials and Methods
Integration analysis
The annotation workflow can be summarized as a series of steps that consist of data clean-up, integration site detection, and identification of the nearest gene(s) to that site (Fig. 1). First, the virus–genome boundary sequences are uploaded to the MAVRIC server. Sequence requirements are as follows: fasta format, 5’-3’ orientation, and at least 11 bp in length. MAVRIC currently supports human, murine, and macaque sequence data. The user may choose to include RepeatMasker criteria, upload vector sequence data to be trimmed, or change the minimum acceptable sequence length. Sequences that do not meet the minimum length requirement after any trimming or repeat masking step are excluded from further analysis. If the user is loading pre-trimmed sequences that contain no vector DNA, the genomic sequence fragments should be loaded such that the viral LTR would be adjacent to the 5’ end of the sequence.

MAVRIC workflow; a summary of each step in the workflow follows.
If the sequences contain fragments of vectors, adapters, or linkers that must be removed prior to annotation, the user should upload them as separate files. Up to three such trimming files can be included. The upload windows are helpfully named for vector sequence, LTR, and polylinker, but any external residues that may contaminate the genomic sequence can be uploaded and screened. MAVRIC detects and removes designated sequences via cross-match, an implementation of the Smith-Waterman-Gotoh algorithm developed by Phil Green (University of Washington). Vector and linker/adapter sequences will be trimmed regardless of orientation. The user can also choose to exclude data that do not contain certain external sequences, such as viral LTRs, that are used to validate bona fide integration sites.
After trimming, MAVRIC clusters the approved sequences by an implementation of cd-hit-est (Li and Godzik, 2006). Sequences that are found to be more than 95% identical to another sequence in the dataset are considered redundant integrations and excluded from further analysis. The number of redundant sequences in each cluster is tracked and this information is presented in the “skipped sequences” summary table.
Submitted sequences can also be prescreened using the online tool RepeatMasker (Smit, A.F.A., Hubley, R., and Green, P., RepeatMasker Open-3.0, 1996–2004). RepeatMasker screens sequences for regions of known genomic repetitive sequence using an implementation of the cross-match algorithm. Simple repeats, tandem repeats, segmental duplications, and interspersed repeats such as pseudogenes, retrotranscripts, SINEs, DNA transposons, retrovirus retrotransposons, and non-retroviral transposons (LINEs) are masked by this algorithm. RepeatMasker can be adjusted to known repetitive sequences for several species (currently human, mouse, macaque, and mammalian are available on MAVRIC).
MAVRIC aligns the screened sequences in the genome via BLAST (Altschul et al., 1990), a fast algorithm that allows alignment of query sequences (DNA or protein) to a predefined database. It finds the largest subsection of the query and tries to expand it in both directions, assigning penalties for the creation of gaps or mismatches. Given a query sequence, BLAST identifies the best fitting alignment in addition to similar alignments with higher penalty scores. In MAVRIC, the user can select the maximum E-value to be returned, with the default maximum E-value set to 0.01. The E-value is a statistical measure that shows how likely it is that the given alignment occurred by chance. Lowering the maximum E-value will result in fewer BLAST hits accepted but increases the confidence that those alignments are accurate. The alignments of integration sites identified by BLAST and accepted by MAVRIC are subsequently annotated using data available from Ensembl. Integration sites with multiple alignments possessing the same lowest E-value are considered non-informative since the alignment is ambiguous and these sites are excluded from further analysis.
Versions of BLAST linked to older National Center for Biotechnology Information (NCBI) builds are available for each species in order to precisely compare new data to previously analyzed sets. NCBI v34-v37, v36-v37, and v1.41 are available for human, mouse, and macaque, respectively. The user chooses the maximum acceptable E-value for the BLAST results. BLAST hits that exceed this maximum E-value are excluded from further analysis. The Ensembl database used is based on the BLAST version and species selected. Note that some BLAST versions are linked to more than one Ensembl database (for example, mouse v37 is linked to Ensembl mouse 49 and 56), in which case the user may select the Ensembl database they wish to use. Finally, the user sets the size of the window flanking the integration site to search for genes, and chooses whether to return only Refseq genes (Pruitt et al., 2007) or all genes and genomic features (miRNAs, pseudogenes, snRNAs, etc.) found by Ensembl.
Annotation of retrieved integration locations
Genes adjacent to the integration site are annotated as follows: gene symbol, Ensembl ID, Entrez ID, Unigene ID, Refseq ID, biotype, chromosome, strand, location of the hit start and hit end, and both the raw distance (defined as the minimum distance from the IS to the 5’ or 3’ end of the gene) and 5’ distance (defined as the distance from the gene transcription start site to the IS). Two outputs are generated for Ensembl hits: one file that contains every gene with at least 1 bp within the user-defined maximum distance from the integration site (default set to 100 kb), and another file that only contains the gene whose 5’ end (adjacent to the transcription start site) is closest to the integration site and is within the specified maximum distance. The “all genes” file, assuming the user-defined distance is sufficiently large, gives an overview of every gene that could potentially be affected by the integrated vector. The “nearest gene” file contains less information about the genomic loci surrounding the integrations but allows each integration site to have an equal “weight” for certain downstream analyses. MAVRIC uses the nearest gene file to generate a histogram showing the distribution of distances from the integration site to the nearest gene transcription start site. It also lists common integration sites (defined here as three or more hits for a given gene in the nearest gene dataset) and a summary of the analysis parameters and excluded sequences. Graphical output and a summary of the IS annotations is presented in the Results section, with the full output available for download in a zip file (Supplementary Fig. 1; Supplementary Material available online at
Nearest gene expression level binning
MAVRIC includes an optional feature that associates genes annotated by MAVRIC as nearest to an integration site with user-generated expression level data, sorted in equally sized bins (Schröder et al., 2002). The user submits a table of gene expression values generated from Affymetix arrays or similar analyses. MAVRIC sorts the genes in this table into 10 equally sized bins, as published previously (Deichmann et al., 2007; Schwarzwaelder et al., 2007), based on the relative expression levels, and then checks each gene in the nearest gene file against this binning profile. MAVRIC creates a histogram displaying the number of IS genes allotted to each bin, giving an overview of the relation between gene expression level and integration frequency (Supplementary Fig. 1D). Common integration site genes are also plotted separately on the same graph. Users can upload their own expression data based on other experimental parameters along with the sequences. Note that MAVRIC cannot process raw array data; expression values must be determined by the user prior to upload. MAVRIC is able to process expression values from any source, provided that the user uploads the data in the proper format (tab-delimited text). Users can upload up to two expression values per gene, which will result in two separate binning graphs. This allows easy comparison of two gene expression datasets, for example before and after cell stimulation.
Test set for comparison of parameters: a published sequence set for ADA-SCID gene therapy
We compared the MAVRIC annotation process with the published annotation of a dataset retrieved from a clinical gene therapy trial for adenosine deaminase severe combined immunodeficiency (ADA-SCID) (Aiuti et al., 2007). The published data contained 706 sequences along with the gene found nearest to each integration site. These sequences were analyzed via MAVRIC, using the NCBI 37 assembly and Ensembl version 56. A total of six variations of RepeatMasker settings and E-value conditions were performed (Table 1 ). The nearest gene and all genes annotations for each MAVRIC variant, as well as the originally published analysis, were used as input for Ingenuity functional analysis (Ingenuity Systems). Ingenuity identifies biological functions and/or diseases that are most significant to the set of genes provided by analyzing RNA expression data in the context of known biological responses and regulatory networks as well as other, higher order response pathways. The following Ingenuity settings were used for pathways analysis: Direct and Indirect Relationships; Data Sources=all; Confidence=experimentally observed; Species=all; Tissues and Cell Lines=all. This analysis was repeated using KEGG (Kyoto Encyclopedia of Genes and Genomes) pathway analysis, a manually curated list of genes and their interactions.
Table 1A outlines analysis parameters and the number of annotations returned for each of eight MAVRIC settings. The number of sequences annotated can be greatly increased by skipping RepeatMasker and extending the size of the window around the integration site (IS) to 500 kb; however, this may result in lower quality annotations.
Table 1B shows the results of loading MAVRIC nearest-gene annotations into Ingenuity functional analysis. The analysis parameters have little effect on the percent of genes mapped by Ingenuity, but they do have an effect on the top pathways returned (Supplementary Table 2).
For direct comparison to the published analysis, we used the MAVRIC output with the following settings, hereby referred to as the “conservative criteria”: human RepeatMasker, minimum sequence length=16 bp, maximum E-value=0.01, maximum distance from gene to IS=100 kb. These criteria returned 542 annotated sequences, or 77% of the dataset. We then reanalyzed the dataset in MAVRIC with no RepeatMasker step, reducing the minimum sequence length to 11 bp and increasing the maximum E-value to 10. These parameters, dubbed the “permissive criteria,” annotated a total of 636 sequences for a 90% return rate. The dataset was reanalyzed several more times with various parameters, described in detail in the next section.
To determine the relationship between retroviral integration and the expression of nearby genes in hematopoietic stem cells, the target cells for gene therapy trials in inherited disorders of the blood cell / immune systems (Aiuti et al., 2002; Hacein-Bey-Abina et al., 2002; Gaspar et al., 2004), we referenced the nearest gene list generated using the permissive criteria to gene expression level data in hematopoietic stem cells. Gene expression values obtained from CD34+ human cord blood cells as measured on a U133 plus 2.0 gene array were sorted into 10 bins based on relative expression, as detailed before. Genes identified by MAVRIC as the unique nearest gene to each IS were labelled according to bin expression level, and the resulting total for each bin was placed into a histogram.
ADA-SCID integrations compared to X-SCID integration data
To assess to what extent the ADA-SCID data analyzed in this study overlap with data from the X-linked severe combined immunodeficiency (X-SCID) clinical trial, previously published data from the London and Paris X-SCID trials (Deichmann et al., 2007; Schwarzwaelder et al., 2007) were compared using MAVRIC analysis with the permissive criteria.
Results
MAVRIC performance testing
The current application annotates over 2500 unique integrations per hour, the rate limiting step being the BLAST alignment (60% of the total processing time). MAVRIC was not designed to process the extremely high number of sequencing reads generated by high throughput sequencing applications, but it does contain several features that make annotation of medium-sized datasets possible. High-throughput sequencing methods produce a high volume of redundant sequence reads. The use of cross-match to recognize and remove redundant sequences (classified here as >95% identical to another sequence in the dataset) allows MAVRIC to process large high-throughput sequencing datasets in a relatively short amount of time. In our testing environment, MAVRIC was able to trim, cluster, and annotate up to 30,000 high throughput LAM-PCR sequences per hour.
The user can choose to exclude sequences that do not contain certain external fragments, such as viral LTRs. High throughput sequencing methods produce a number of aspecific genomic fragments, meaning that the presence of a viral LTR flanking genomic sequence is necessary to confirm a bona fide insertion site.
Using repeat masking to improve annotation throughput
Genomes contain sequences of interspersed repeats and regions of low complexity: repetitive sequences make up almost 50% of the human genome (Levy et al., 2007). These repeat regions cause difficulties when intersecting with a virus genome boundary sequence. When multiple alignments retrieved by BLAST share the lowest E-value score, the sequence will not point to a unique place in the genome. Repeat sequences also cause the throughput of the BLAST alignment to decrease. We approached this problem by prescreening the virus genome boundary sequences using the online tool RepeatMasker. RepeatMasker allows batch uploads of sequences and returns sequences with the desired repeats masked. The resulting trimmed sequences can then be aligned using BLAST without the throughput penalties or alignment ambiguities that repeat sequences introduce. The number of different repeat consensus sequences varies between genomes, and the user should indicate from which species the sequences are derived when selecting RepeatMasker. Figure 2A and B shows an example of the impact of repeat masking on sequence lengths. Repeat masking clearly shortens the sequences by removal of the repeated regions and reduces ambiguous alignments. Repeat masking also reduces the time required to BLAST alignments, leading to a net decrease in annotation time. RepeatMasker does cause some sequences to lose the majority of the data, and in a few cases the entirety of the sequence is deleted (Fig. 2B). Users choosing to implement RepeatMasker should expect to have 2 to 12% of the sequence data excluded prior to the BLAST step due to being trimmed below the acceptable length threshold, depending on the initial length and quality of the sequences.

Changes in sequence length distribution caused by RepeatMasker.
Differences in annotation between genome databases
The annotation of virus integration sites is dependent on the analysis parameters provided. While the different databases (University of California, Santa Cruz [UCSC]; Ensembl; NCBI) use the same underlying genomic information, although UCSC mouse genome assembly contains only the C57Bl/6J reference strain data, the annotations are slightly different. For instance, Ensembl utilizes an automated annotation pipeline, using mRNA and protein data, combined with manually reviewed curated data from the Vega project and reviewed protein coding transcripts from consensus coding sequence (CCDS) (Flicek et al., 2011). Any integration dataset therefore depends on the annotation database (NCBI, Ensembl, UCSC) used. Although the majority of the genes identified will be identical regardless of the database, there might be some differences between the annotations, possibly leading to different genes being assigned as the nearest gene to an integration. For example, the murine Mecom locus, in which several splice variants for Evi1 and Mds1 are situated, shows differences in annotation between NCBI, the UCSC genome browser and Ensembl (Supplementary Fig. 2 and Supplementary Table 1).
The use of NCBI reference sequences or broader annotation
The option to annotate only Refseq genes has the advantage of returning only well described genes, but has the disadvantage of filtering out potentially interesting genomic features such as miRNAs, snRNAs, and pseudogenes. In an analysis of a sample dataset (the published ADA-SCID data described below), filtering for Refseq genes resulted in only 3.5% reduction in the number of sequences annotated but a 19.5% mismatch in the genomic features identified via Ensembl as nearest to the IS (data not shown).
Annotation of retrieved integration locations
For each integration site, there are surrounding genes upstream and downstream on both strands. In addition to the closest gene, an integration may have several more neighboring genes that could be influenced by elements of the inserted provirus. Additionally, integrated promoter/enhancer regions can influence an area surrounding the integration of at least 92 kb (Bartholomew and Ihle, 1991) and possibly as large as 500 kb (Kustikova et al., 2005). Studies of deregulation of the virus integration locus should therefore be focused on such large areas and might include up to 1 Mb regions. With this in mind, our tool generates two outputs for Ensembl hits: one file that contains every gene located within a user-defined window around the integration site (default is 100 kb), and another file which only contains the gene whose 5’ end is nearest to each site. Assigning one unique gene that maps nearest to each integration site allows for easier automated downstream analysis and allows every integration site to have equal impact, but user investigation of all the genes near each IS is highly recommended.
Impact of genome builds on annotation output
In addition to RefSeq filtering and the size of the window around the IS, changes between versions of genome builds can have an effect on the annotations returned. Table 2A shows how the number of sequences hit and the number of genes identified increase with successive builds of the human genome. Table 2B illustrates how an identical dataset can produce different outputs depending on which version of the NCBI human genome build was used by the BLAST algorithm. In particular, the gene symbols are updated frequently. For instance, comparing the outputs for the published ADA-SCID sequences using v35 and v37, we find a 99% match in sequences with alignments, but only 91% of the Ensembl IDs and 89% of the EntrezIDs for those sequences match, and only 72% of the common gene names. We therefore highly recommend including the Ensembl ID, which exhibited the most stability between genome builds, for any large-scale analysis and in published data.
The number of integrations mapped and genes identified by NCBI build, using published ADA-SCID data as input. The consensus sequence is updated often, which can cause integration sites to be mapped to different places or to change the nearest gene. Sequences were annotated via MAVRIC, using the following parameters: no repeatmasking, maximum e-value=10, minimum sequence length=11 bp.
The number of integration sites linked to genes is nearly identical, but there are some discrepancies in the gene Ensembl IDs and Entrez IDs. This means that the IS occupies a slightly different place in the genome between the various builds. There are even greater discrepancies between gene names, indicating that the commonly used names for genes are subject to a great deal of turnover. Genome information and build dates were retrieved from
Entrez ID information was not available (n/a) for v.34.
Comparison of MAVRIC analysis settings via gene ontology
A total of six MAVRIC analysis parameters (MAV1-MAV6, Table 1A) were used to generate nearest gene and all genes data as the input for Ingenuity functional analysis and KEGG pathway analysis. In general, the same pathways were found regardless of the analysis settings, but the ranking of the top five pathways had some minor adjustments (Supplementary Table 2). There was slightly more variation seen in the top pathways for the nearest gene datasets compared to the all genes datasets. On average, Ingenuity was able to annotate approximately 95% of the genes in the nearest gene datasets and 92% of the all genes datasets (Table 1B).
Comparison of MAVRIC and a published analysis for ADA-SCID gene therapy
We compared MAVRIC's performance with the manual annotation of a dataset retrieved from a clinical gene therapy trial for ADA-SCID, in which patients were transplanted with CD34+ cells transduced with the adenosine deaminase (ADA) gene using a retroviral vector (Aiuti et al., 2007). We analyzed 706 sequences using MAVRIC, which returned a varying number of annotated results depending on the RepeatMasker and E-value conditions (Table 1A). Increasing the E-value cut-off allows lower quality alignments to be annotated; however, it also increases the processing time as more BLAST hits are generated. Sequences that have two or more alignments with equal minimum E-values cannot be confidently assigned to a specific place in the genome and so are excluded by MAVRIC from further analysis. This often occurs when the IS is located in repeat-dense regions of the genome. Repeat masking shortens the input sequences by removing highly repeated regions from the input sequences and occasionally will shorten an input sequence below the minimum length threshold for BLAST. RepeatMasker can also sometimes have an unintended effect on the BLAST alignments. For instance, the ADA-SCID sequences S3_022 and S3_110 exceed the length threshold but no longer align to a unique location in the human genome after human repeat masking.
For comparison to the published ADA-SCID data, we used the MAVRIC output using the following settings, referred to as the conservative criteria: human RepeatMasker, minimum sequence length=16 bp, maximum E-value=0.01, maximum distance from gene to IS=100 kb. These criteria were selected in order to return the highest confidence alignments. Using these settings, MAVRIC returned 542 annotated IS, or 77% of the previously published sequences. Five sequences were removed during the clustering stage due to a more than 95% homology with another sequence in the dataset. An additional 71 sequences were excluded due to being under the minimum length requirement after repeat masking. Of the remaining excluded sequences, 38 did not have an unambiguous lowest E-value <0.01 and 50 had no Refseq gene within 100 kb of the IS.
In order to annotate more of the ADA-SCID dataset, we adjusted some of MAVRIC's parameters. The following changes were made: no repeat masking step, reduce the minimum sequence length to 11 bp, and increase the maximum acceptable E-value from 0.01 to 10. These settings, dubbed the permissive criteria, resulted in 697 seqs returning unique lowest BLAST hits, and 636 IS were within 100 kb of a Refseq gene, for a 90% annotation rate.
To annotate the maximum number of sequences from this dataset, we extended the window around the IS to look for genes to up to 500 kb distant in either direction. This resulted in 687 sequences returning gene annotations, for a final return rate of 97%. Of the 19 ADA-SCID sequences MAVRIC was unable to annotate, five were excluded during clustering for being >95% similar to another sequence in the dataset. Four more sequences were excluded due to having a non-unique lowest E-value (i.e., these sequences aligned with the same confidence to two or more places in the genome). The remaining 10 sequences had no Refseq genes within 500 kb of the IS (in the original ADA-SCID analysis, 11 sequences had this property).
The distribution of IS is highly similar between the previously published analysis (Aiuti et al., 2007) and MAVRIC permissive criteria (Table 3A). For the combined sequences, MAVRIC analysis returned the same 44%/56% split between intragenic and intergenic integrations. The percentage of integration sites less than 30 kb upstream, 10 kb upstream and within 5 kb of the transcription start site (TSS) is higher in the MAVRIC analysis, likely due to a slightly higher gene density in the newer human genome builds. The distribution of IS around the nearest gene TSS are also similar (data not shown). Using MAVRIC's conservative criteria had a very minor effect on the distribution of integrations, skewing slightly away from distribution seen in the original ADA-SCID analysis.
This table compares the published ADA-SCID analysis with MAVRIC's analysis of the same dataset using the permissive criteria (see Table 1A). Analysis of the total dataset was also performed with the MAVRIC conservative criteria. Although the distributions vary slightly between analysis methods, the overall integration patterns are similar. TSS, transcription start site.
The impact of choosing one gene per integration versus all genes within a defined window
As expected, searching for all genes within 100 kb of the integration site resulted in many more genes annotated compared to listing one nearest gene per integration (Table 3B). The number of Refseq genes returned was approximately four-fold higher relative to linking only a single gene to each IS. Checking these genes against a list of 464 genes listed in the Sanger Cancer Genome project revealed that the all genes datasets contained many more potential oncogenes than the nearest gene datasets. Additionally, using the all genes dataset in Ingenuity and KEGG pathway analysis results in a large shift in the top functional pathways returned (Supplementary Table 2). Restricting the annotations to those genes closest to the insertion site therefore masks potentially interesting genomic features and risks.
This table expands the MAVRIC search parameters to list all RefSeq genes within 100 kb of the IS, which results in a roughly four-fold increase in the number of genes returned. The number of annotated oncogenes also increases. The ADA-SCID analysis had no limit on distance from the IS to the nearest gene, so it was able to annotate all sequences.
Expression level binning reveals that common integration site genes are clustered in highly expressed bins
MAVRIC used the nearest gene list from the permissive analysis parameters as input for gene expression level binning. The list of genes was referenced to hematopoietic stem cell gene expression data obtained from CD34+ umbilical cord blood cells, as measured on a U133 plus 2.0 gene array. The list was then sorted into ten equally sized bins based on expression level. The results are charted based on the number of genes per bin, demonstrating that in the ADA-SCID trial integration occurred more often near highly expressed genes (Fig. 3). Genes identified as common integration site (CIS) genes are also charted separately and are present exclusively in the top three bins. Similar results were found when using the conservative criteria (data not shown). This suggests that the vector used in the ADA-SCID trial has a preference for integrating near highly expressed genes in hematopoietic stem cells.
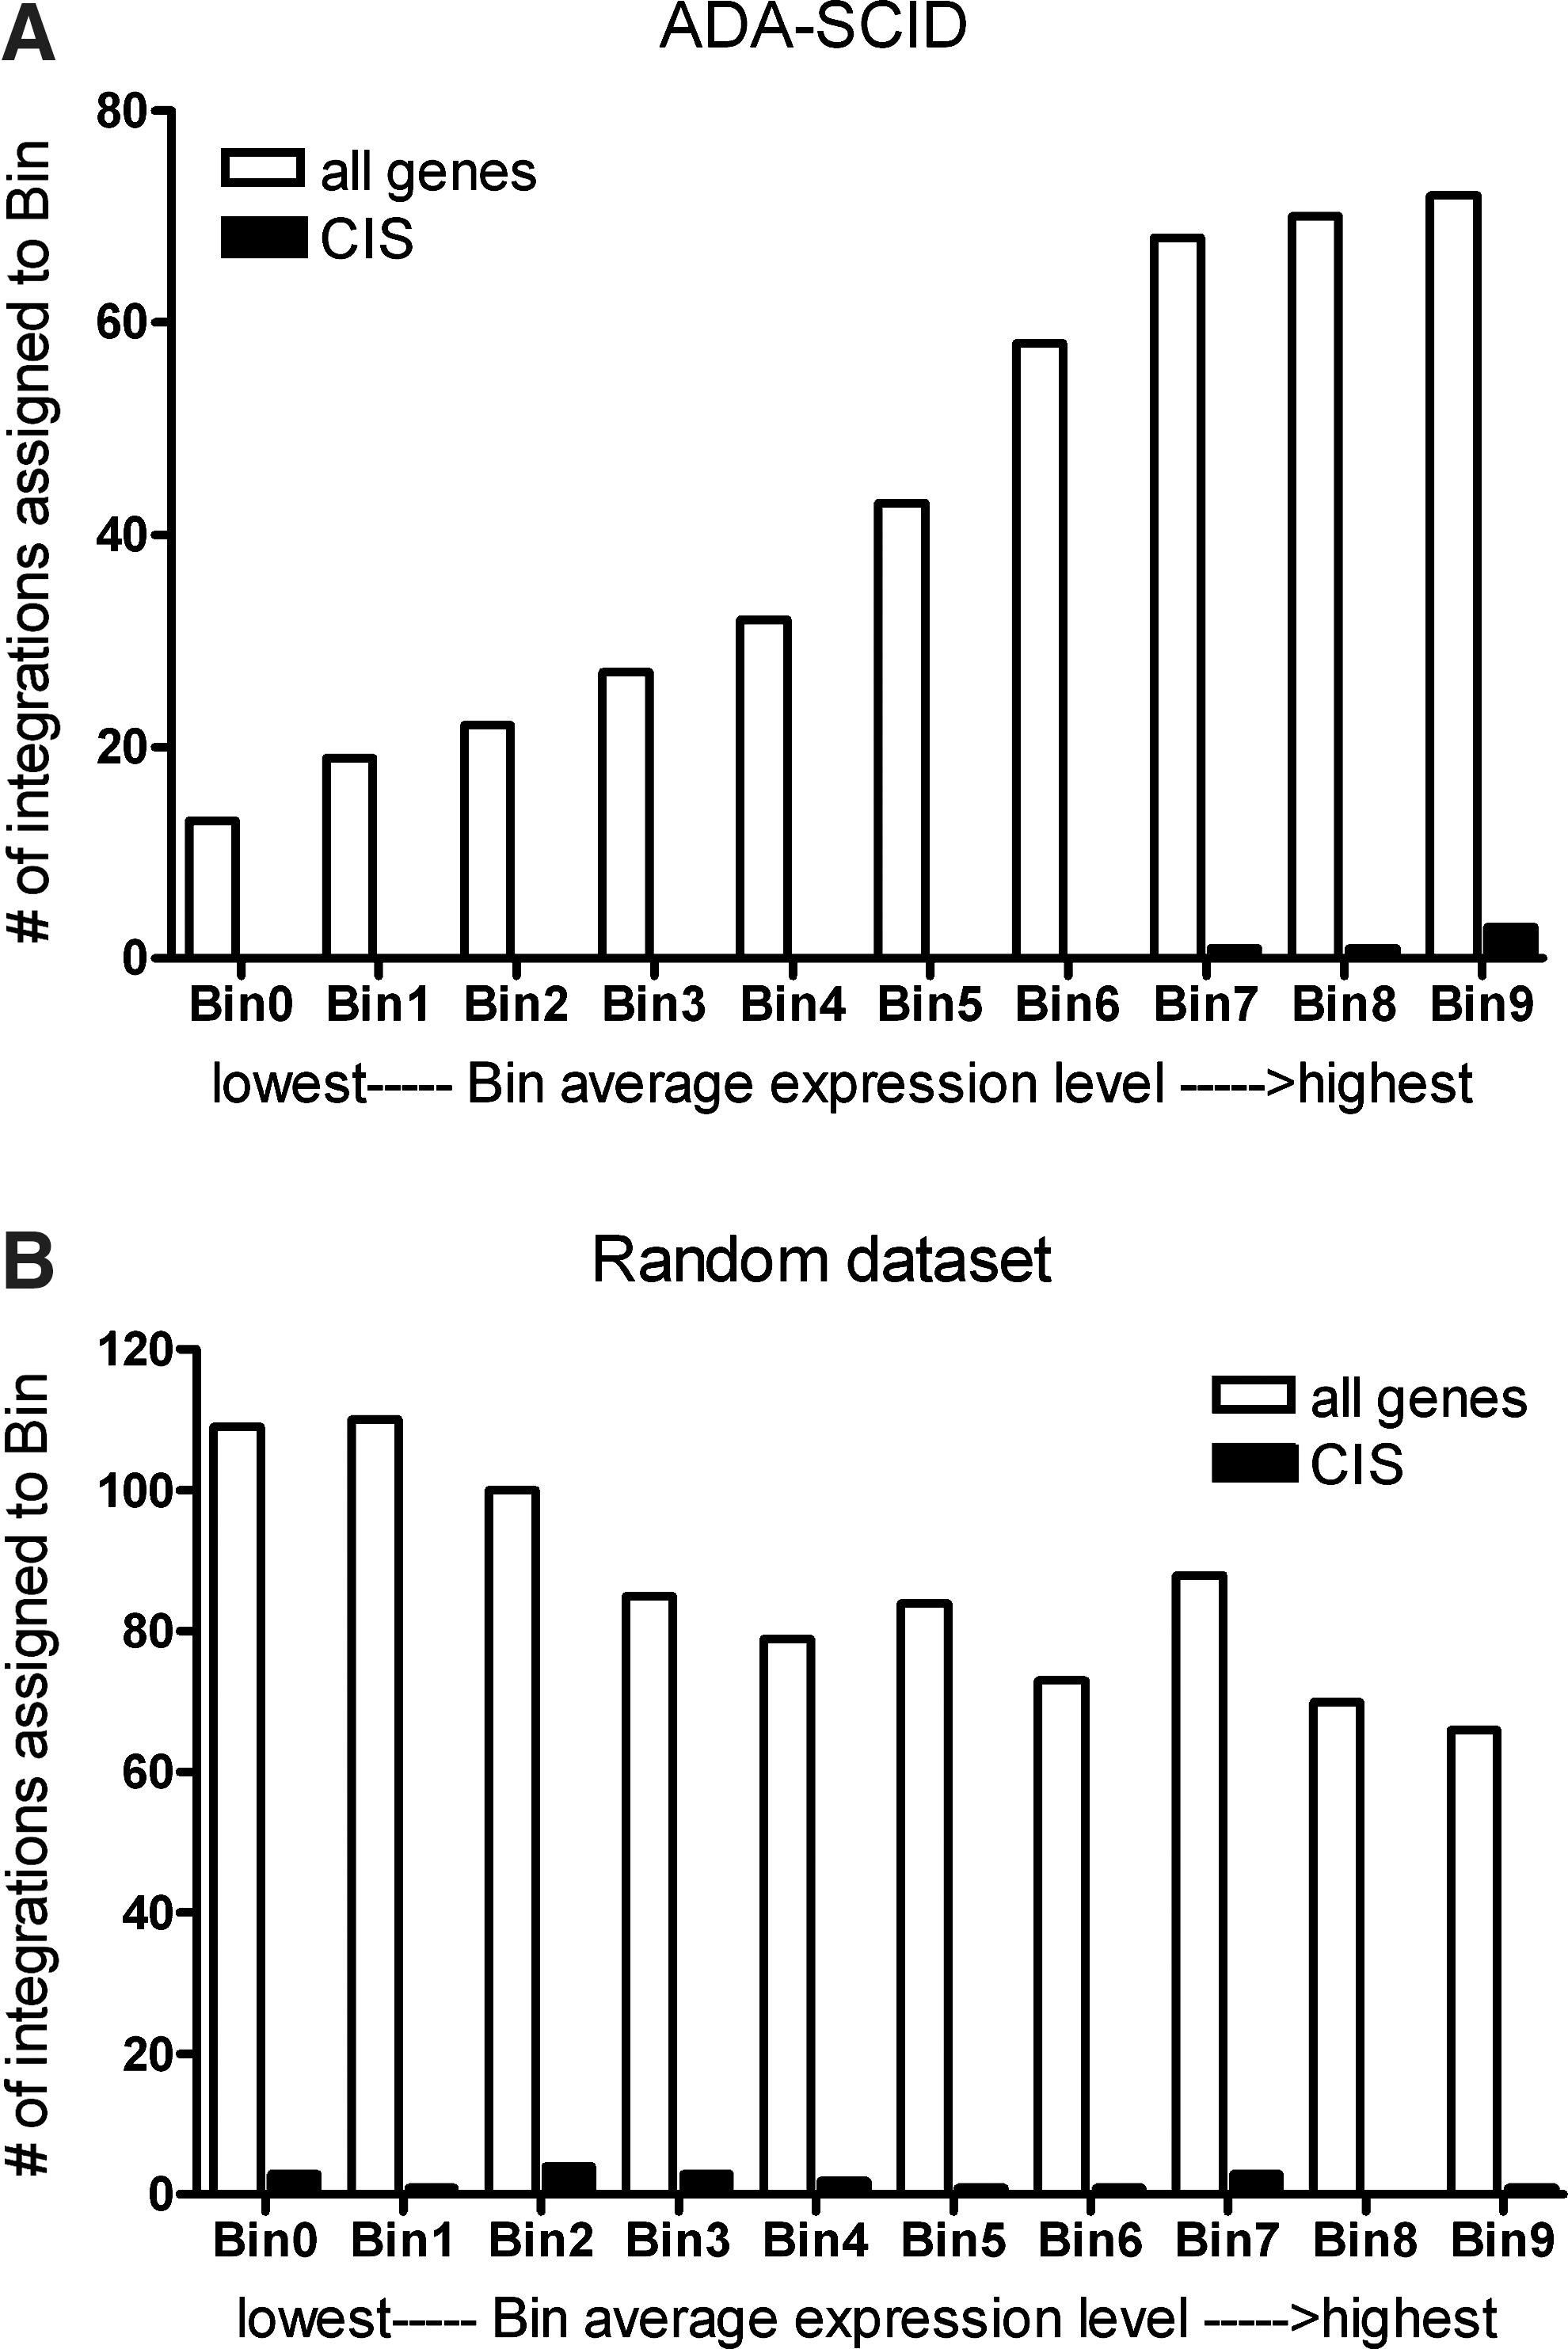
Expression level binning of genes identified in ADA-SCID trial by MAVRIC analysis or randomly selected genes.
ADA-SCID integrations compared to X-SCID integration data
To assess to what extent the ADA-SCID data analyzed in this study overlap with data from the X-SCID clinical trial, previously published data from the London and Paris X-SCID trials (Deichmann et al., 2007; Schwarzwaelder et al., 2007) were compared with the MAVRIC tool using the permissive criteria. The ADA-SCID and X-SCID trials used similar gammaretroviral vectors, which is reflected in a remarkable overlap in the list of genes nearest to an IS (14–16% compared to 4–6% vs random datasets; Table 4).
Table 4 shows the integrations obtained from clinical samples retrieved in the London and Paris X-SCID trials compared to the ADA-SCID integration data used in this study. Analysis consists of unique genes designated as nearest to an IS using MAVRIC's permissive criteria (see Table 1 ). The ADA-SCID data is also compared against four sets of randomly generated integration sites. The overlap between the clinical datasets is roughly three-fold higher than the overlap with the random data.
Discussion
Automated analysis tools allow efficient annotation of virus integration sites according to a predefined set of criteria, reduce the risk of user input errors, and allow for convenient reanalysis in case annotations or database builds change. We created the MAVRIC web tool to automatically validate integration site sequences, align those using BLAST, and annotate them using data retrieved from the Ensembl databases. MAVRIC can remove external or redundant sequences, returns a list of genes near each integration site, and annotates the genomic loci (Fig. 1).
To efficiently process larger datasets, we have employed a clustering strategy, which accelerates BLAST alignments for high throughput sequencing data. Sequences that are found to be >95% similar to a previously uploaded sequence in the dataset are removed. Sequences removed this way are tracked in a table that details why they were excluded and how many times that redundant sequence was found. Obviously, a method to annotate integrations following a defined set of criteria is less likely to make mistakes such as typing errors. Yet there is a problem even when reporting the automatically annotated integrations. Usually, spreadsheets are a convenient way of displaying moderately sized datasets. The automatic correction methods built in to spreadsheets such as Microsoft Excel, however, can cause difficulties when the built-in correction methods are inadvertently used on gene symbols. This problem has been reported previously (Zeeberg et al., 2004) and has also occurred in our analysis.
Another factor to consider when analyzing integration site data is the distance from the IS to nearby genes. Some IS may have no genes within 1 Mb or more, while others have multiple genes less than 50 kb away. We recommend searching for genes within 100 kb on either side of the IS, as viral integrations have been shown to have an effect on nearby gene regulation within this distance, but it is possible to widen this window at the cost of increased processing time. Widening the range to 500 kb allowed 7% more sequences to be annotated and increased the total number of genes returned by almost four-fold but increased the annotation time by 125%.
Investigation of gene expression level binning, included as an optional step in the MAVRIC workflow, can give the user additional insights into the integration preferences of the vector used. Referencing the nearest genes list of the ADA-SCID dataset against expression data generated from hematopoietic stem cells revealed that genes in the three highest expression bins were overrepresented, especially those genes that were also common integration sites. This suggests that the vector used in the ADA-SCID trial has a preference for integrating near highly expressed genes. Users interested in this type of analysis can use the cell type of interest and compare up to two expression values per gene. Any type of gene-centric expression values could be suitable for binning, with the caveat that it is the user's responsibility to assess the relevance of the resulting analyses.
Linking each integration to a single gene (generally the gene nearest to the integration site) is a common method of analysis. This allows every IS to have the same impact on secondary analyses such as gene expression arrays, Ingenuity Pathway Analysis, or other methods of looking for integration patterns in viral vectors. However, it is important to highlight what is meant by “nearest.” In general, we suggest that the nearest gene be whichever gene has its 5’ end closest to the IS, as viral integrations are known to alter expression of nearby genes via the long-terminal repeats (Wu et al., 2003; Lewinski et al., 2006) or the internal promoters (Modlich et al., 2009). There will be occasional integrations in which this method of determining the gene most influenced by the IS will result in important information being missed. For example, consider a hypothetical viral vector integration located on human chromosome 13 at position 32,860,000 (Supplementary Fig. 3). This integration is situated in an intron of the FRY gene, but it is within 25 kb of the 5’ end of gene ZAR1L and within 30 kb of the 5’ end of known oncogene BCRA2. Which gene should be considered “nearest”? Which is the most significant for determining vector safety? Is the orientation of the IS relative to nearby genes also a factor? Investigation of the genomic region around each integration site is highly recommended. Limiting the analysis to one gene per integration or a narrow window around the IS will exclude a high percentage of the genes close enough to potentially be affected by the integration, including genes related to tumorigenesis (Table 3B).
The difference in datasets obtained with or without Refseq filtering, using different NCBI builds, adjusting the alignment criteria, etc., demonstrates how analysis results can be altered by minor changes to annotation settings. It is therefore necessary when describing IS annotations to very explicitly state all parameters that were used in the analysis. Without these parameters, reproduction of alignments and annotations will prove difficult even when all sequence information is available.
Comparing the output of the automated MAVRIC tool to the published analysis of the ADA-SCID gene therapy study demonstrated large similarities in the overall integration patterns while highlighting subtle differences in the annotation processes. The distributions of integration site distance from TSS were very similar, as were the common integration sites. Some of the sequences identified in the ADA-SCID study were excluded by MAVRIC due to failure to achieve a quality threshold (primarily minimum sequence length before or after repeat masking). The remainder were excluded because of multiple identical lowest E-value BLAST alignments.
Integration site analysis of ADA-SCID and X-SCID clinical trials revealed a large overlap in genes that have viral integrations nearby (14-16%). Ingenuity analysis showed the same functional pathways as frequent integration targets in both clinical trials and in mouse studies (Supplementary Fig. 4; Montini et al, 2009; Deichmann et al, 2011). This suggests that closely related vector types may have similar integration profiles across multiple treatments and species. Further cross-study analysis of vector integration sites could lead to new insights into viral vector integration patterns.
In basic structure, MAVRIC is similar to other automated sequence analysis tools such as QuickMap (Appelt et al., 2009). Compared to QuickMap, MAVRIC annotation speed is slower but it annotates more integration sites. In a test run with the ADA-SCID sequences, QuickMap returned 515 unique protein coding genes vs 574 for MAVRIC, with annotations for 601 out of 706 sequences vs 636 for MAVRIC). MAVRIC produces less annotation data than some other annotation tools but has a variety front-end options for the user with regards to the analysis parameters. MAVRIC is also able to incorporate microarray expression data to further investigate viral integration tendencies. We feel it is important to stress that MAVRIC was not designed for processing the number of reads generated by high-throughput sequencing. For these extremely large datasets, MAVRIC should be viewed as a supplementary tool. MAVRIC's ease of use makes it an attractive option for investigators with modest amounts of sequencing data and those who lack a background in bioinformatics.
In summary, automated analysis tools can greatly increase the speed and efficiency of viral integration site annotation. Our tool, MAVRIC, returns detailed information on the genomic location of the integration sites and gives an overview of viral integration patterns. It is well suited to generating annotations for reanalysis of historical datasets or comparison of data from different studies. Regardless of the annotation tool used, the user should carefully choose the quality thresholds and note which database versions and filtering options are used, as small changes in the analysis parameters can have a significant effect on the resulting annotations. Analyzing all datasets with identical analysis parameters helps to ensure that the resulting annotations are optimally suited for direct comparison to enable rapid cumulative data processing. As high throughput sequencing becomes routine and more gene therapy applications move toward clinical implementation, automated analysis tools are becoming essential for rapid patient monitoring. MAVRIC is available for use upon free registration online.
Footnotes
Acknowledgments
The authors would like to thank Prof. A. Aiuti for the use of the ADA-SCID sequencing data used for testing MAVRIC. Funding for this study was provided by the Netherlands Health Research Organization ZonMw, Translational Gene Therapy Program, projects 43100016 and 43400010, by the German Federal Ministry of Education and Research (BMBF project iGene 01GU0813), and by the European Commission's 5th and 6th Framework Programs, Contracts QLK3-CT-2001-00427-INHERINET, LSHB-CT-2004-005242-CONSERT, LSHB-CT-2006-018933, and LSHB-CT-2006-19038. The authors acknowledge Drs. F.J.T. Staal and K. Pike-Overzet, Department of Immunology, Erasmus University Medical Center, for assistance in the microarray analyses.
Author Disclosure Statement
The authors declare no conflicts of interest.
References
Supplementary Material
Please find the following supplemental material available below.
For Open Access articles published under a Creative Commons License, all supplemental material carries the same license as the article it is associated with.
For non-Open Access articles published, all supplemental material carries a non-exclusive license, and permission requests for re-use of supplemental material or any part of supplemental material shall be sent directly to the copyright owner as specified in the copyright notice associated with the article.