
Abstract
Recombinant adeno-associated virus (AAV) represents an efficient system for neuronal transduction. However, a potential drawback of AAV is its restricted packaging capacity of approximately 5 kb. To bypass this limitation, a number of dual- and triple-vector strategies divide the transgene(s) between two or three AAVs. The success of these approaches relies directly on efficient cotransduction of the component AAVs. Although proof of concept for these stratagems has been demonstrated, the underlying cotransduction rate has not been analyzed quantitatively. In this study, cotransduction efficiencies in both retina and hippocampus have been investigated, using two reporter AAVs expressing either a green (GFP) or red (DsR) fluorescent protein. Transduction efficiencies were monitored via microscopy, flow cytometry, and quantitative PCR. After viral transduction with 1.5×10⁹ viral particles of each of the reporter AAVs, approximately one-third of the retinal cells expressed one or both transgenes at levels detectable by native fluorescence. Notably, the majority of the remaining retinal cells were also transduced and expressed the reporters at lower levels, which were detectable only by immunolabeling. Flow cytometric analysis demonstrated cotransduction rates of up to 55% with the two reporter AAVs in retinal cells. Modifying the ratio of the two coadministered AAVs resulted in altered mRNA expression levels of the two reporter genes in cotransduced cell populations. The study suggests that codelivery of AAV is an efficient means of expanding the therapeutic application of AAV in neurons.
Introduction
Despite these positive features, the therapeutic application of AAV has been significantly restricted by its limited packaging capacity of approximately 5 kb (Dong et al., 1996, 2010; Yang et al., 2002; Lai et al., 2010; Wu et al., 2010). Substantial efforts have been made to enhance AAV vector technology, for example, to increase transgene expression levels or to accelerate initiation of transgene expression (McCarty, 2008; Zhong et al., 2008; Monahan et al., 2010). In particular, effective packaging of inserts with sizes greater than the natural limit of approximately 5 kb would enable accommodation of larger genes, regulatory elements, and/or multiple genes, thereby greatly extending the range of potential applications for AAV technology. For example, if we allocate a total of 1 kb for promoter and polyadenylation [poly(A)] sequences, the cDNA capacity of AAV is approximately 4 kb. Approximately 6% of human genes have protein-coding sequences greater than 4 kb (Ensembl, release 66). Among inherited retinal dystrophies, certain forms of retinitis pigmentosa (Hartong et al., 2006), cone–rod dystrophies (Hamel, 2007), macular degenerations (Musarella, 2001), and Usher syndrome (Yan and Liu, 2010) involve genes for which the corresponding cDNAs are larger than the natural size limit of AAV. One way to overcome this size constraint may be that certain AAV serotypes can accommodate larger genomes. Allocca and colleagues (2008) reported that AAV2/5 incorporated up to 8.9 kb more efficiently than six other AAV serotypes. However, follow-up studies suggest that expression of the complete gene may have resulted from partial packaging, and subsequent homologous recombination of the expression cassettes in transduced cells, rather than packaging of oversized inserts (Dong et al., 2010; Lai et al., 2010; Wu et al., 2010). Monahan and colleagues (2010) demonstrated that expression from a 5.6-kb transgene in AAV2/2 and AAV2/8 vectors could be enhanced via adjuvant proteasome inhibition. Another approach that in effect serves to increase the AAV cargo capacity is the dual (or triple) vector strategy, in which two (or three) AAVs, typically carrying one therapeutic gene per vector, are cotransduced into target cells (Fan et al., 1998; Muramatsu et al., 2002; Millington-Ward et al., 2011). The dual-vector split-gene strategy, in contrast, employs a single oversized expression cassette (5-10 kb) divided between two AAV vectors, each containing up to 5 kb (Yan et al., 2000; Duan et al., 2000). Recombination of the full-length insert in the target cells is then achieved by exploiting, for example, homologous recombination between two trans-splicing AAV vectors (Ghosh et al., 2009). The functionality of such strategies has been demonstrated in muscle (Yan et al., 2000; Ghosh et al., 2006, 2009), lung (Halbert et al., 2002), and retina (Reich et al., 2003). Inevitably, efficient cotransduction is critical to the success of these multiple AAV vector strategies. For example, significantly greater expression of recombined genes was achieved when the most efficient serotypes, that is, AAV2/6 for muscle (Ghosh et al., 2006) and AAV2/5 for retina (Reich et al., 2003), were employed for dual-vector split-gene strategies.
AAV coadministration has been explored in various tissues including the brain and retina in vivo (Fan et al., 1998; Duan et al., 2000; Yan et al., 2000; Muramatsu et al., 2002; Reich et al., 2003; Ghosh et al., 2006, 2009; Millington-Ward et al., 2011). However, codelivery of multiple AAVs in these studies has been investigated only qualitatively, by histology and/or indirectly by evaluating therapeutic benefit. Importantly, quantitative analysis of the rate of cell coinfection and the level of expression of each component would enable assessment of the potential and limitations of the approach, as well as optimization of the multiple AAV vector strategies. Therefore the current study focuses on determining the efficacy of AAV coinfection. In particular, cotransduction has been explored in two CNS targets: the retina and hippocampus. Two reporter AAVs, each expressing an undivided Living Colors fluorescent protein-encoding gene, have been employed to probe the dynamics of a dual-vector strategy. AAV2 was packaged into a type AAV5 capsid, as this serotype (AAV2/5) has been found previously to efficiently transduce brain neurons (Burger et al., 2004; McKee et al., 2010) and photoreceptors (Auricchio et al., 2001; Yang et al., 2002; O'Reilly et al., 2007). After viral transduction with 1.5×10⁹ viral particles (VP) of each of the reporter AAVs, approximately one-third of the retinal cells expressed one or both transgenes at levels detectable by native fluorescence. Notably, the majority of the remaining retinal cells were also transduced and expressed the reporters at lower levels, which were detectable only by immunolabeling. Significant cotransduction (up to 55% in photoreceptors) with the two reporter AAVs was obtained by this approach. In addition, we systematically altered the ratio of the reporter gene AAV vectors in the delivery cocktail, quantified the number of cotransduced cells, and determined the mRNA levels of the reporter genes in these populations. The results obtained in this study highlight the feasibility of multiple vector strategies for AAV-delivered CNS gene therapies.
Materials and Methods
Cloning and AAV production
The EGFP gene (GFP; GenBank accession no. U57608) (Clontech, Mountain View, CA) and the DsRed-Express2 gene (DsR; GenBank accession no. FJ226077) (Clontech) were cloned downstream of the cytomegalovirus (CMV) promoter in pAAV-MCS (Stratagene, La Jolla, CA; Fig. 1). The expression cassettes comprised the CMV immediate-early promoter, the human β-globin intron, the reporter gene (GFP or DsR), and the human growth hormone polyadenylation signal [HGH p(A)]. The constructs were packaged into helper-free recombinant AAV2/5 viruses as described (O'Reilly et al., 2007) to generate AAV-GFP and AAV-DsR. Briefly, the expression cassettes were transfected into human embryonic kidney (HEK)-293 cells (CRL-1573; American Type Culture Collection [ATCC], Manassas, VA) with pRep2/Cap5 and pHelper (Stratagene). Fifty 150-mm plates of confluent cells were transfected, using polyethylenimine. Forty-eight hours posttransfection, crude viral lysates were cleared and purified by cesium gradient centrifugation. AAV-containing fractions were dialyzed against phosphate-buffered saline (PBS). Genomic titers (viral particles per milliliter; VP/ml) were determined by quantitative real-time PCR (qPCR).
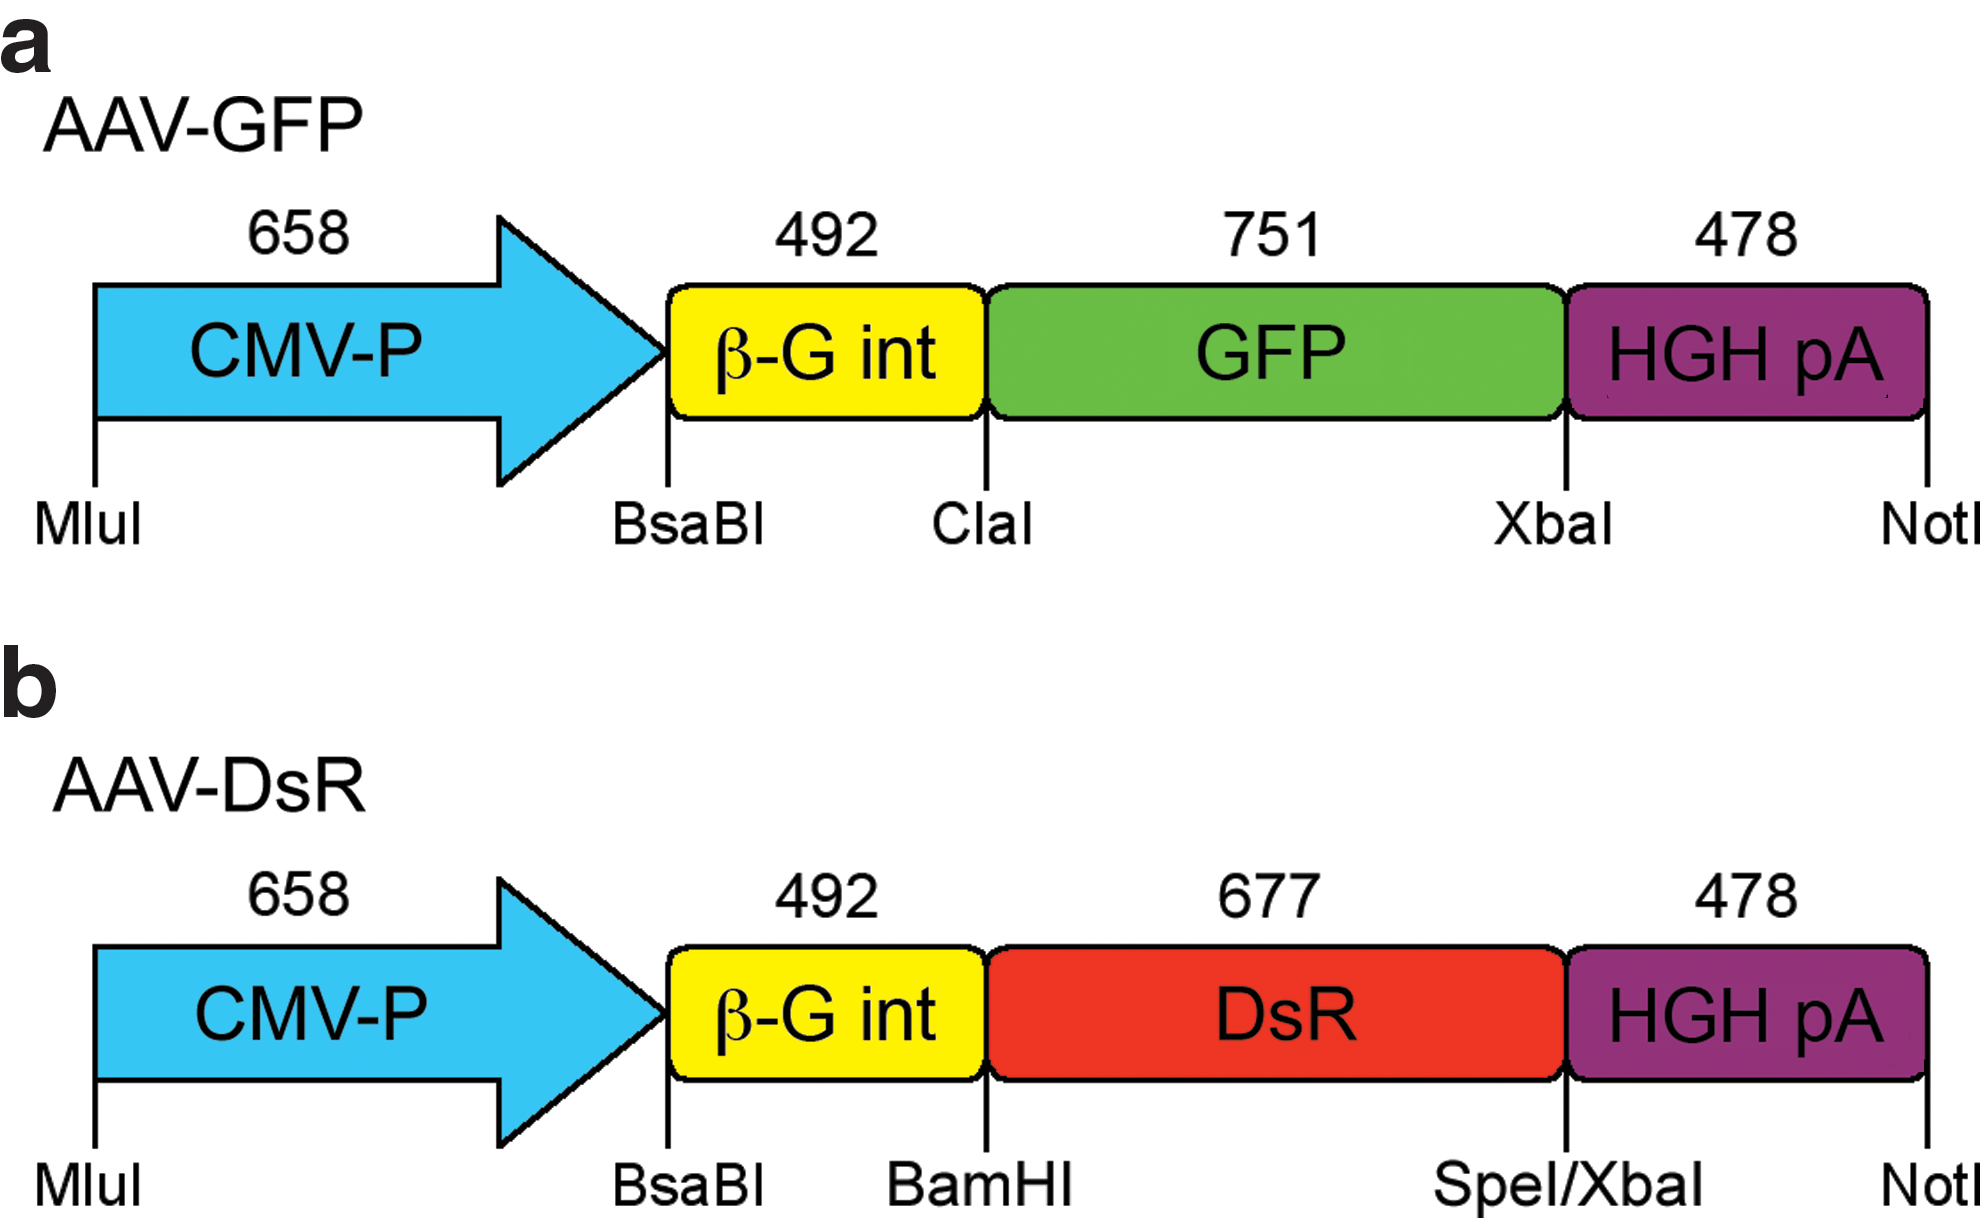
Schematic representation of reporter AAV vector constructs. EGFP (GFP;
Cell culture
Human cervical carcinoma cells (HeLa, CCL-2; ATCC) were transduced with AAV-GFP and AAV-DsR in duplicate. Cells (1×10⁵ per well) were seeded on plastic coverslips in 1 ml of Dulbecco's modified Eagle's medium containing 10% calf serum in a 24-well plate and incubated overnight at 37°C. Medium was then aspirated and the cells were washed with PBS. AAV-GFP and/or AAV-DsR (2.5×10⁹ VP) was then added to each well, in 200 μl of PBS. After incubation for 1 hr at 37°C, 1 ml of medium was added, and the cells were incubated for a further 48 hr.
Animals and AAV administration
Procedures were approved by the Animal Research Ethics Committee of Trinity College Dublin (Dublin, Ireland) and were carried out in strict compliance with European Communities Regulations 2002 and 2005 (Cruelty to Animals Act) and, for subretinal injections, the Association for Research in Vision and Ophthalmology (ARVO) and under licenses issued by the Irish Department of Health. Animals were kept under a 12-hr light/12-hr dark cycle with free access to water and food.
Subretinal injections in BALB/c mice (Charles River, Wilmington, MA) were carried out as described (Chadderton et al., 2009). Briefly, adult mice were anesthetized by intraperitoneal injection of a mixture of medetomidine hydrochloride (Domitor; Pfizer Animal Health, Cork, Ireland) and ketamine hydrochloride (Vetalar; Pfizer Animal Health), 0.8 and 100 mg/kg body weight, respectively. Pupils were dilated with Minims tropicamide 1% (Chauvin Pharmaceuticals, Surrey, UK) and Minims phenylephrine 2.5% (Chauvin Pharmaceuticals), and, using topical anesthesia (Minims amethocaine 0.5%; Chauvin Pharmaceuticals), a small puncture was made in the sclera. A 34-gauge blunt-ended microneedle attached to a 10-μl Hamilton syringe was inserted through the puncture, and 3 μl of AAV (1.5×10⁹–3.15×10¹⁰ VP) was administered to the subretinal space. After subretinal injection, atipamezole hydrochloride (Antisedan, 10 mg/g body weight; Pfizer Animal Health), an anesthetic-reversing agent, was delivered by intraperitoneal injection. Body temperature was maintained with a homeothermic heating device.
Adult, male Wistar-CRL rats were obtained from the Bioresources Unit, Trinity College Dublin. Site-directed injection to the dentate gyrus in the hippocampus was carried out as described (McKee et al., 2010). Briefly, rats were anesthetized as described previously and placed in a stereotaxic frame. The skulls was trepanned bilaterally at a position of 3.8 mm posterior and 1.5 mm lateral to the bregma and a cannula loaded with AAV was slowly lowered into the brain to a depth of 3.5 mm ventral to the bregma. AAV (1.0×10⁹ VP) was then infused into the brain at a rate of 0.1 μl/min over a 10-min period. Postinjection, the cannula was kept in place for a further 2 min and then removed slowly, the incisions were closed, and the animals were placed in a heated cage (35°C) and monitored. The anesthetic was reversed as described previously for mice and carprofen (Rimadyl, 0.1 ml/kg, intraperitoneal; Pfizer Animal Health) was administered as a postoperative analgesic.
Flow cytometry and mRNA expression analysis
Adult BALB/c mice were subretinally injected with various ratios of AAV-GFP and AAV-DsR. Two weeks postinjection, retinas were harvested and trypsin-dissociated, and live transduced cells were analyzed and sorted on the basis of the native fluorescence of GFP and DsR, using a BD FACSAria cell sorter equipped with BD FACSDiva software (Becton Dickinson, Oxford, UK) as described (Palfi et al., 2006). Intact cells were detected by DRAQ5 staining (Biostatus, Shepshed, UK); typically 20,000 to 50,000 cells were collected per sample and total RNA was extracted with an RNeasy kit (Qiagen, Hilden, Germany). Parallel analysis was performed with a BD Accuri C6 flow cytometer with BD CFlow Plus software. GFP and DsR mRNA expression levels were assessed by quantitative reverse transcription real-time PCR (RT-qPCR), using a 7300 real-time PCR system (Applied Biosystems, Foster City, CA), and a QuantiTect SYBR green RT-PCR kit (Qiagen); 18S RNA was used as an endogenous control.
The efficiency of detection of DsR and GFP by flow cytometry was analyzed by immunocytochemistry (Doonan et al., 2005). Briefly, retinal samples transduced with AAV-GFP and AAV-DsR were dissociated; the cells were fixed in 1% paraformaldehyde for 30 min; and immunocytochemistry was performed for GFP (chicken anti-GFP, 1:1500 dilution; Abcam, Cambridge, UK) and DsR (rabbit anti-DsR, 1:200 dilution; Clontech), using Alexa Fluor 647 anti-chicken IgG (1:1500 dilution) and Alexa Fluor 750 anti-rabbit IgG (1:400 dilution) secondary antibodies (Invitrogen/Life Technologies, Grand Island, NY). Native GFP and DsR fluorescence was detected in parallel with the Alexa Fluor signals, using flow cytometry (CyAn ADP analyzer; Beckman Coulter Diagnostics, Lismeehan, Ireland). Controls used to determine background fluorescence and to set gates included untransduced cells, cells transduced only with AAV-GFP, and cells transduced only with AAV-DsR, processed with or without immunocytochemistry. SYTOX blue (Invitrogen) was used for nuclear detection. Data from flow cytometry and PCR analyses are presented as means±SD. Statistical analysis was carried out by one-way analysis of variance (ANOVA) with Tukey's multiple comparison post hoc test or Student t test (Prism version 5; GraphPad Software, La Jolla, CA); differences with p<0.05 were considered significant.
Histology
HeLa cells, eyes, and brains were fixed in 4% paraformaldehyde for 20 min, 4 hr, and 24 hr, respectively; fixed eyes and brains were then cryosectioned (10 μm). Native fluorescence of the reporters was analyzed with a Zeiss Axiophot fluorescence microscope (Carl Zeiss, Welwyn Garden City, UK); nuclei were counterstained with 4′,6-diamidino-2-phenylindole (DAPI). For GFP immunocytochemistry, chicken anti-GFP primary antibody (1:1500 dilution; Abcam) and Alexa Fluor 647 anti-chicken IgG (1:1500 dilution; Invitrogen) were used and nuclei were counterstained with DAPI. Microscopy images were taken with an Olympus FV1000 confocal microscope (Olympus Europa Holding, Hamburg, Germany). The Alexa Fluor signal was false-colored in red. Corresponding microscopy images taken with different filters were overlaid, using Photoshop version 10 (Adobe Systems Europe, Glasgow, UK).
Results
Initially, two fluorescent protein reporter gene AAV vectors were generated that expressed either DsRed-Express2 (DsR) or EGFP (GFP) genes from the immediate-early CMV promoter: AAV-DsR and AAV-GFP (Fig. 1). Subsequently, HeLa cells were used to explore the feasibility of AAV cotransduction in vitro, using detection of the native reporter fluorescence. HeLa cells cultured on coverslips in 24-well plates were transduced with the two reporter AAVs and were analyzed by fluorescence microscopy 48 hr posttransduction. A significant number of cells from wells transduced with either 2.5×10⁹ VP of AAV-DsR (Supplementary Fig. S1a–c; supplementary data are available online at
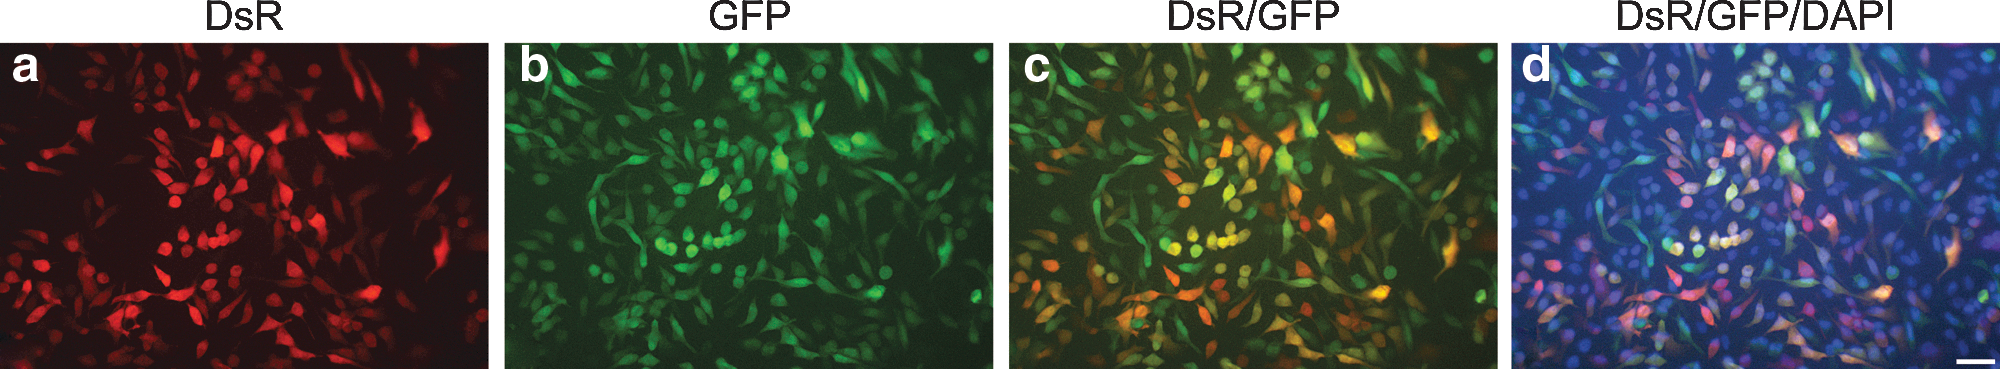
Native fluorescence of HeLa cells cotransduced with reporter AAVs. HeLa cells (1×10⁵ per well) were seeded on plastic coverslips in a 24-well plate and incubated overnight. Cells were transduced with a mixture of 2.5×10⁹ AAV-DsR and 2.5×10⁹ AAV-GFP in duplicate and incubated for 48 hr. Cells were then fixed and counterstained with 4′,6-diamidino-2-phenylindole (DAPI).
As photoreceptor cells are particularly amenable to transduction by AAV2/5 and the retina is readily accessible for quantitative analysis in vivo, efficacy of AAV2/5 cotransduction was evaluated in this tissue by detection of the native reporter fluorescence. Initially, eyes of adult wild-type mice were subretinally injected with a mixture of 1.5×10⁹ VP of AAV-GFP and 1.5×10⁹ VP of AAV-DsR (n=4). Two weeks postinjection eyes were fixed and whole-mounted. Areas of the retinas transduced by the two reporter gene vectors overlapped completely, as demonstrated on whole-mount preparations, and corresponded to approximately 40–50% coverage of the retina (Fig. 3). Subsequently, adult wild-type mice were subretinally injected with various ratios of the reporter AAVs: 1.5×10⁹ VP of AAV-GFP and 1.5×10⁹ VP of AAV-DsR (1:1 ratio), 1.5×10⁹ VP of AAV-GFP and 7.5×10⁸ VP of AAV-DsR (1:1/2 ratio), 1.5×10⁹ VP of AAV-GFP and 3.0×10⁸ VP of AAV-DsR (1:1/5 ratio), 1.5×10⁹ VP of AAV-GFP and 1.5×10⁸ VP of AAV-DsR (1:1/10 ratio), and 3.0×10¹⁰ VP of AAV-GFP and 1.5×10⁹ VP of AAV-DsR (20:1 ratio). Two weeks postadministration, eyes were fixed and processed for histology (n=3 per group). Significant coexpression of the two reporters was observed in the photoreceptor cells (outer nuclear layer, ONL) and the retinal pigment epithelium (RPE) by fluorescence microscopy (Fig. 4). Note that the color of cotransduced cells is depicted as yellow/orange in the images where DsR and GFP signals are overlaid (Fig. 4k–o). As the ratio of AAV-DsR was decreased from 1:1 (Fig. 4a, f, and k) to 1:1/2 (Fig. 4b, g, and l), 1:1/5 (Fig. 4c, h, and m), and 1:1/10 (Fig. 4d, i, and n), the quantity of DsR label and the number of cotransduced cells decreased. In contrast, transductions with a 20:1 ratio (Fig. 4e, j, and o), that is, greatly increasing the quantity of AAV-GFP, resulted in histology similar to that obtained with the 1:1 ratio (Fig. 4a, f, and k). In control experiments (n=3 per group), mice were uninjected or were subretinally injected with either 1.5×10⁹ VP of AAV-DsR or 1.5×10⁹ VP of AAV-GFP alone (Supplementary Fig. S2). Reporter expression was not detected in uninjected animals (Supplementary Fig. S2a, d, and g), and dual-labeled cells were not found in retinas transduced with a single reporter gene (Supplementary Fig. S2b, c, e, f, h, and i).
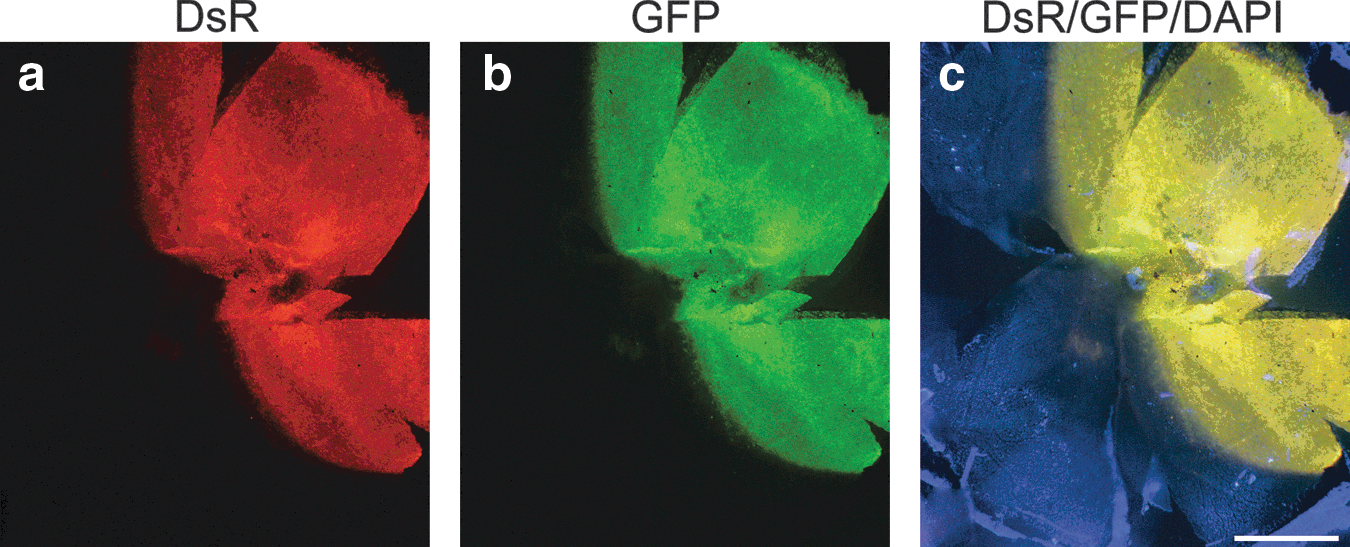
Native fluorescence of reporter proteins in a whole-mounted mouse retina cotransduced with reporter AAVs. Eyes of adult wild-type mice were subretinally injected with a mixture of 1.5×10⁹ VP of AAV-GFP and 1.5×10⁹ VP of AAV-DsR. Two weeks postinjection eyes were fixed, and nuclei were counterstained with DAPI and whole mounted (n=4).
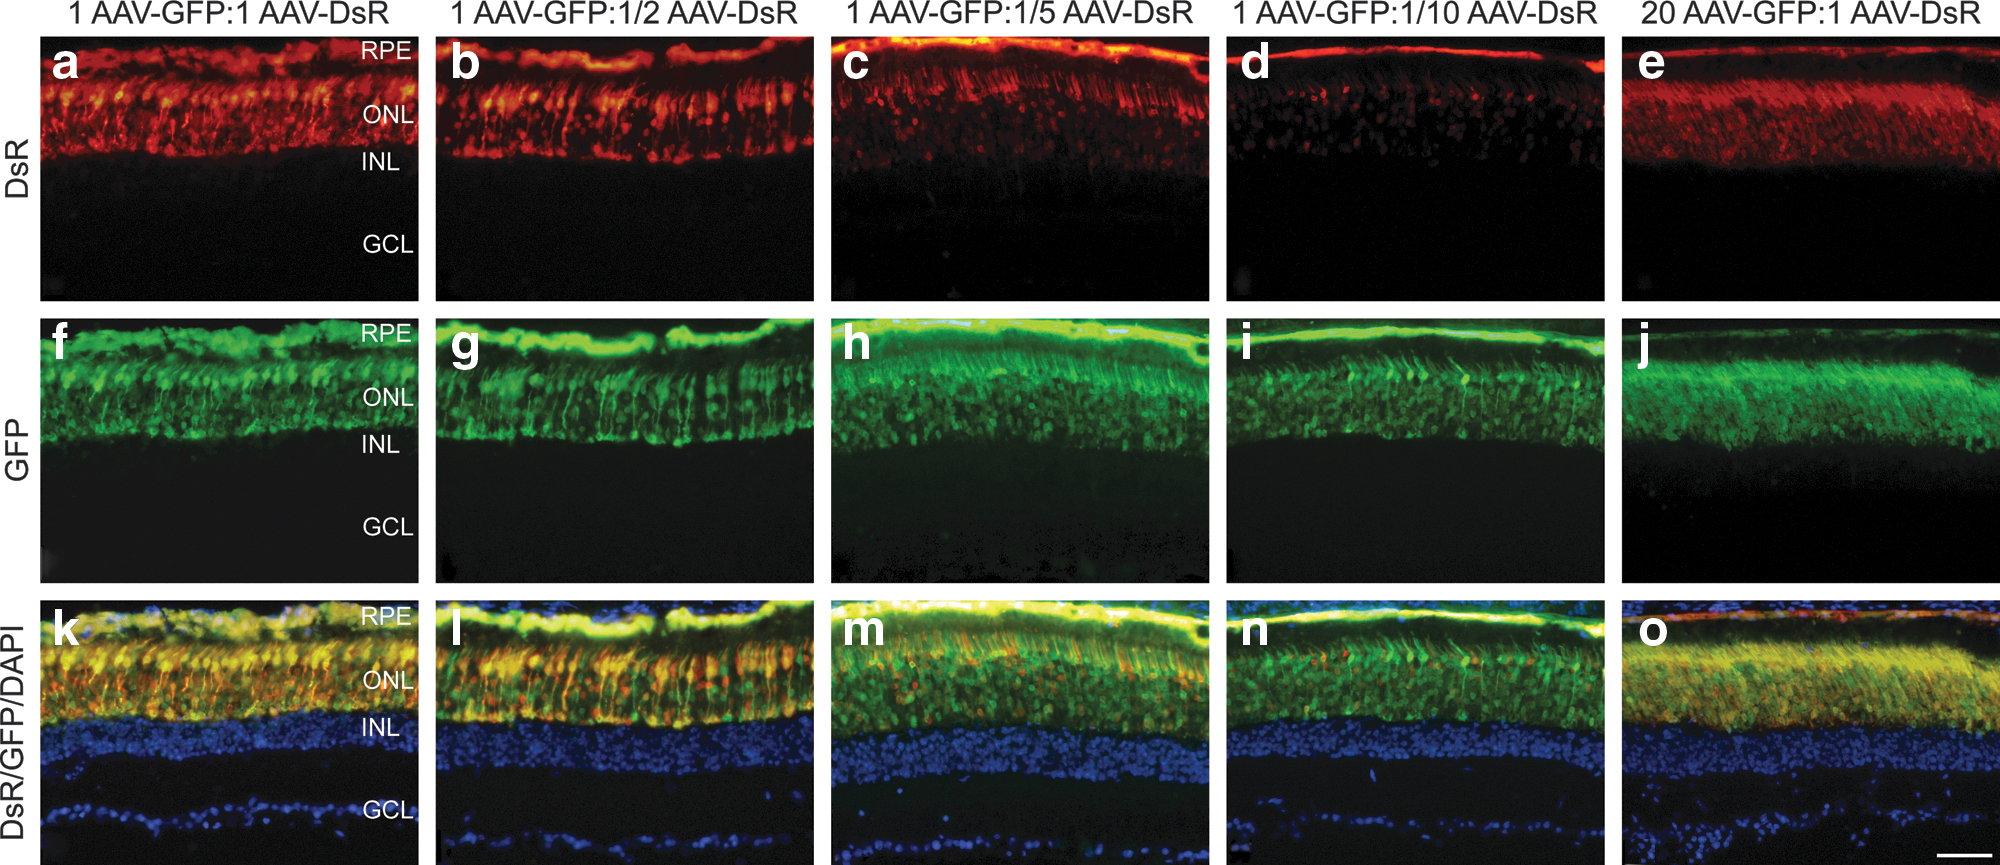
Native fluorescence of reporter proteins in transduced retinal sections. Eyes of adult wild-type mice were subretinally injected with various mixtures of reporter AAVs (n=3). Representative microscopy images correspond to injections of 1.5×10⁹ VP of AAV-GFP and 1.5×10⁹ VP of AAV-DsR (1 AAV-GFP:1 AAV-DsR;
Further sets of retinas, injected with the same ratios of AAV-DsR and AAV-GFP described previously, were trypsin-dissociated and analyzed by flow cytometry, using detection of the native reporter fluorescence 2 weeks postinjection (n=3). Flow cytometry enabled quantification and collection of the labeled cell populations. Representative flow cytograms corresponding to retinas that were untransduced or transduced with AAV-DsR only; AAV-GFP only; and 1:1, 1:1/2, 1:1/5, 1:1/10, and 20:1 AAV-GFP:AAV-DsR ratios are depicted in Supplementary Fig. S3. The average of the total labeled cells was 34.2±9.7% in these groups and the percentage of labeled cells in the AAV-GFP-alone and AAV-DsR-alone groups was 40.1±6.9 and 28.7±3.5%, respectively. Although the difference between the number of transduced cells in the AAV-GFP-only and AAV-DsR-only groups was not statistically significant, we consistently detected less labeling with DsR compared with GFP. For the 1:1 ratio of AAV-GFP to AAV-DsR, the distribution of the labeled cells was 57.7±8.8% unlabeled, 16.1±2.5% GFP+ only, 3.4±1.4% DsR+ only, and 23.1±7.5% colabeled (Supplementary Fig. S4). A bar chart representation of the relative distribution of labeled cells corresponding to transductions with each AAV-GFP:AAV-DsR ratio is given in Fig. 5; note that the sum of labeled cells in each group was taken as 100% and that the background labeling was 2–5%. For example, the small percentage of colabeled cell populations present in the AAV-DsR-only and AAV-GFP-only injections is clearly an artifact of the analysis. Relative percentages of colabeled cells were determined as 54.2±17.5% (1:1 ratio), 32.8±1.8% (1:1/2 ratio), 12.6±4.7% (p<0.01; 1:1/5 ratio), 6.8±3.8% (p<0.01; 1:1/10 ratio), and 46.2±10.9% (20:1 ratio). Note that statistical significance is given in comparison with the value obtained with the 1:1 ratio injections. In general, decreasing the ratio of AAV-DsR from 1:1 to 1:1/2, 1:1/5, and 1:1/10 decreased the quantity of cotransduced cells and DsR-positive (DsR+) cells whereas the number of GFP-positive (GFP+) cells increased as anticipated (Fig. 5). In contrast, the increased ratio of AAV-GFP (20:1 ratio) did not have a significant effect on the distribution of labeled cells (Fig. 5).

Distribution of labeled cells detected by flow cytometry, using native fluorescence of reporters in transduced retinas. Eyes of adult wild-type mice were subretinally injected with various mixtures of AAV-DsR and AAV-GFP (n=3). Two weeks postinjection retinas were removed from the eyecups and trypsin-dissociated, and cells were analyzed and sorted by flow cytometry. Columns illustrate the means (±SD) of labeled cells from retinas injected with 1.5×10⁹ VP of AAV-DsR, 1.5×10⁹ VP of AAV-GFP, 1.5×10⁹ VP of AAV-GFP and 1.5×10⁹ VP of AAV-DsR (1:1 ratio), 1.5×10⁹ VP of AAV-GFP and 7.5×10⁸ VP of AAV-DsR (1:1/2 ratio), 1.5×10⁹ VP of AAV-GFP and 3.0×10⁸ VP of AAV-DsR (1:1/5 ratio), 1.5×10⁹ VP of AAV-GFP and 1.5×10⁸ VP of AAV-DsR (1:1/10 ratio), and 3.0×10¹⁰ VP of AAV-GFP and 1.5×10⁹ VP of AAV-DsR (20:1 ratio). The sum of labeled cells was taken as 100% for each injection mixture. Red, green, and yellow represents DsR-positive, GFP-positive, and colabeled cells, respectively. The statistical significance of differences in the amounts of colabeled cell population (represented by yellow column portions) compared with that of the samples injected with the 1:1 ratio mixture was determined by ANOVA. **p<0.01.
Expression of DsR and GFP mRNAs was quantified by RT-qPCR in the colabeled cell populations, which were collected by flow cytometry (n=3 per group; Fig. 6). The relative expression of DsR mRNA in the cotransduced cell populations decreased when the proportion of DsR was decreased in the AAV-GFP:AAV-DsR injection cocktail (Fig. 6a). Relative expression levels of DsR in the retinas injected with the 1:1/5 and 1:1/10 AAV-GFP:AAV-DsR ratios were significantly different when compared with the samples injected with the 1:1 ratio (taken as 100%), that is, 45.9±11.8% (p<0.05) and 23.0±6.7% (p<0.001), respectively. Although the quantity of AAV-GFP administered remained the same between all injections, the relative expression of GFP mRNA was inversely related to expression of DsR mRNA, that is, GFP mRNA levels increased in cotransduced cell populations when the proportion of AAV-DsR was decreased in the injection cocktail (Fig. 6b). Relative expression levels of GFP mRNA were significantly different in the samples with 1:1/5 and 1:1/10 AAV-GFP:AAV-DsR ratios when compared with the sample with the 1:1 ratio (taken as 100%), that is, 208.6±18.6% (p<0.05) and 263.6±150% (p<0.05), respectively. Furthermore administration of the high dose of AAV-GFP (20:1 ratio) resulted in increased GFP mRNA (129.3±87%) and decreased DsR mRNA expression (66.1±23.7%) in cotransduced cell populations when compared with the values obtained with the 1:1 ratio injection cocktail. However, the changes in expression were not statistically significant and in particular the changes in GFP expression were modest given the 20-fold increase in the dose of AAV-GFP administered (Fig. 6a and b). The relative DsR:GFP mRNA expression ratios in the cotransduced cell populations were 1.00, 0.626, 0.220, 0.087, and 0.511 in samples injected with 1:1, 1:1/2, 1:1/5, 1:1/10, and 20:1 AAV-GFP:AAV-DsR injection cocktails, respectively (Fig. 6c).
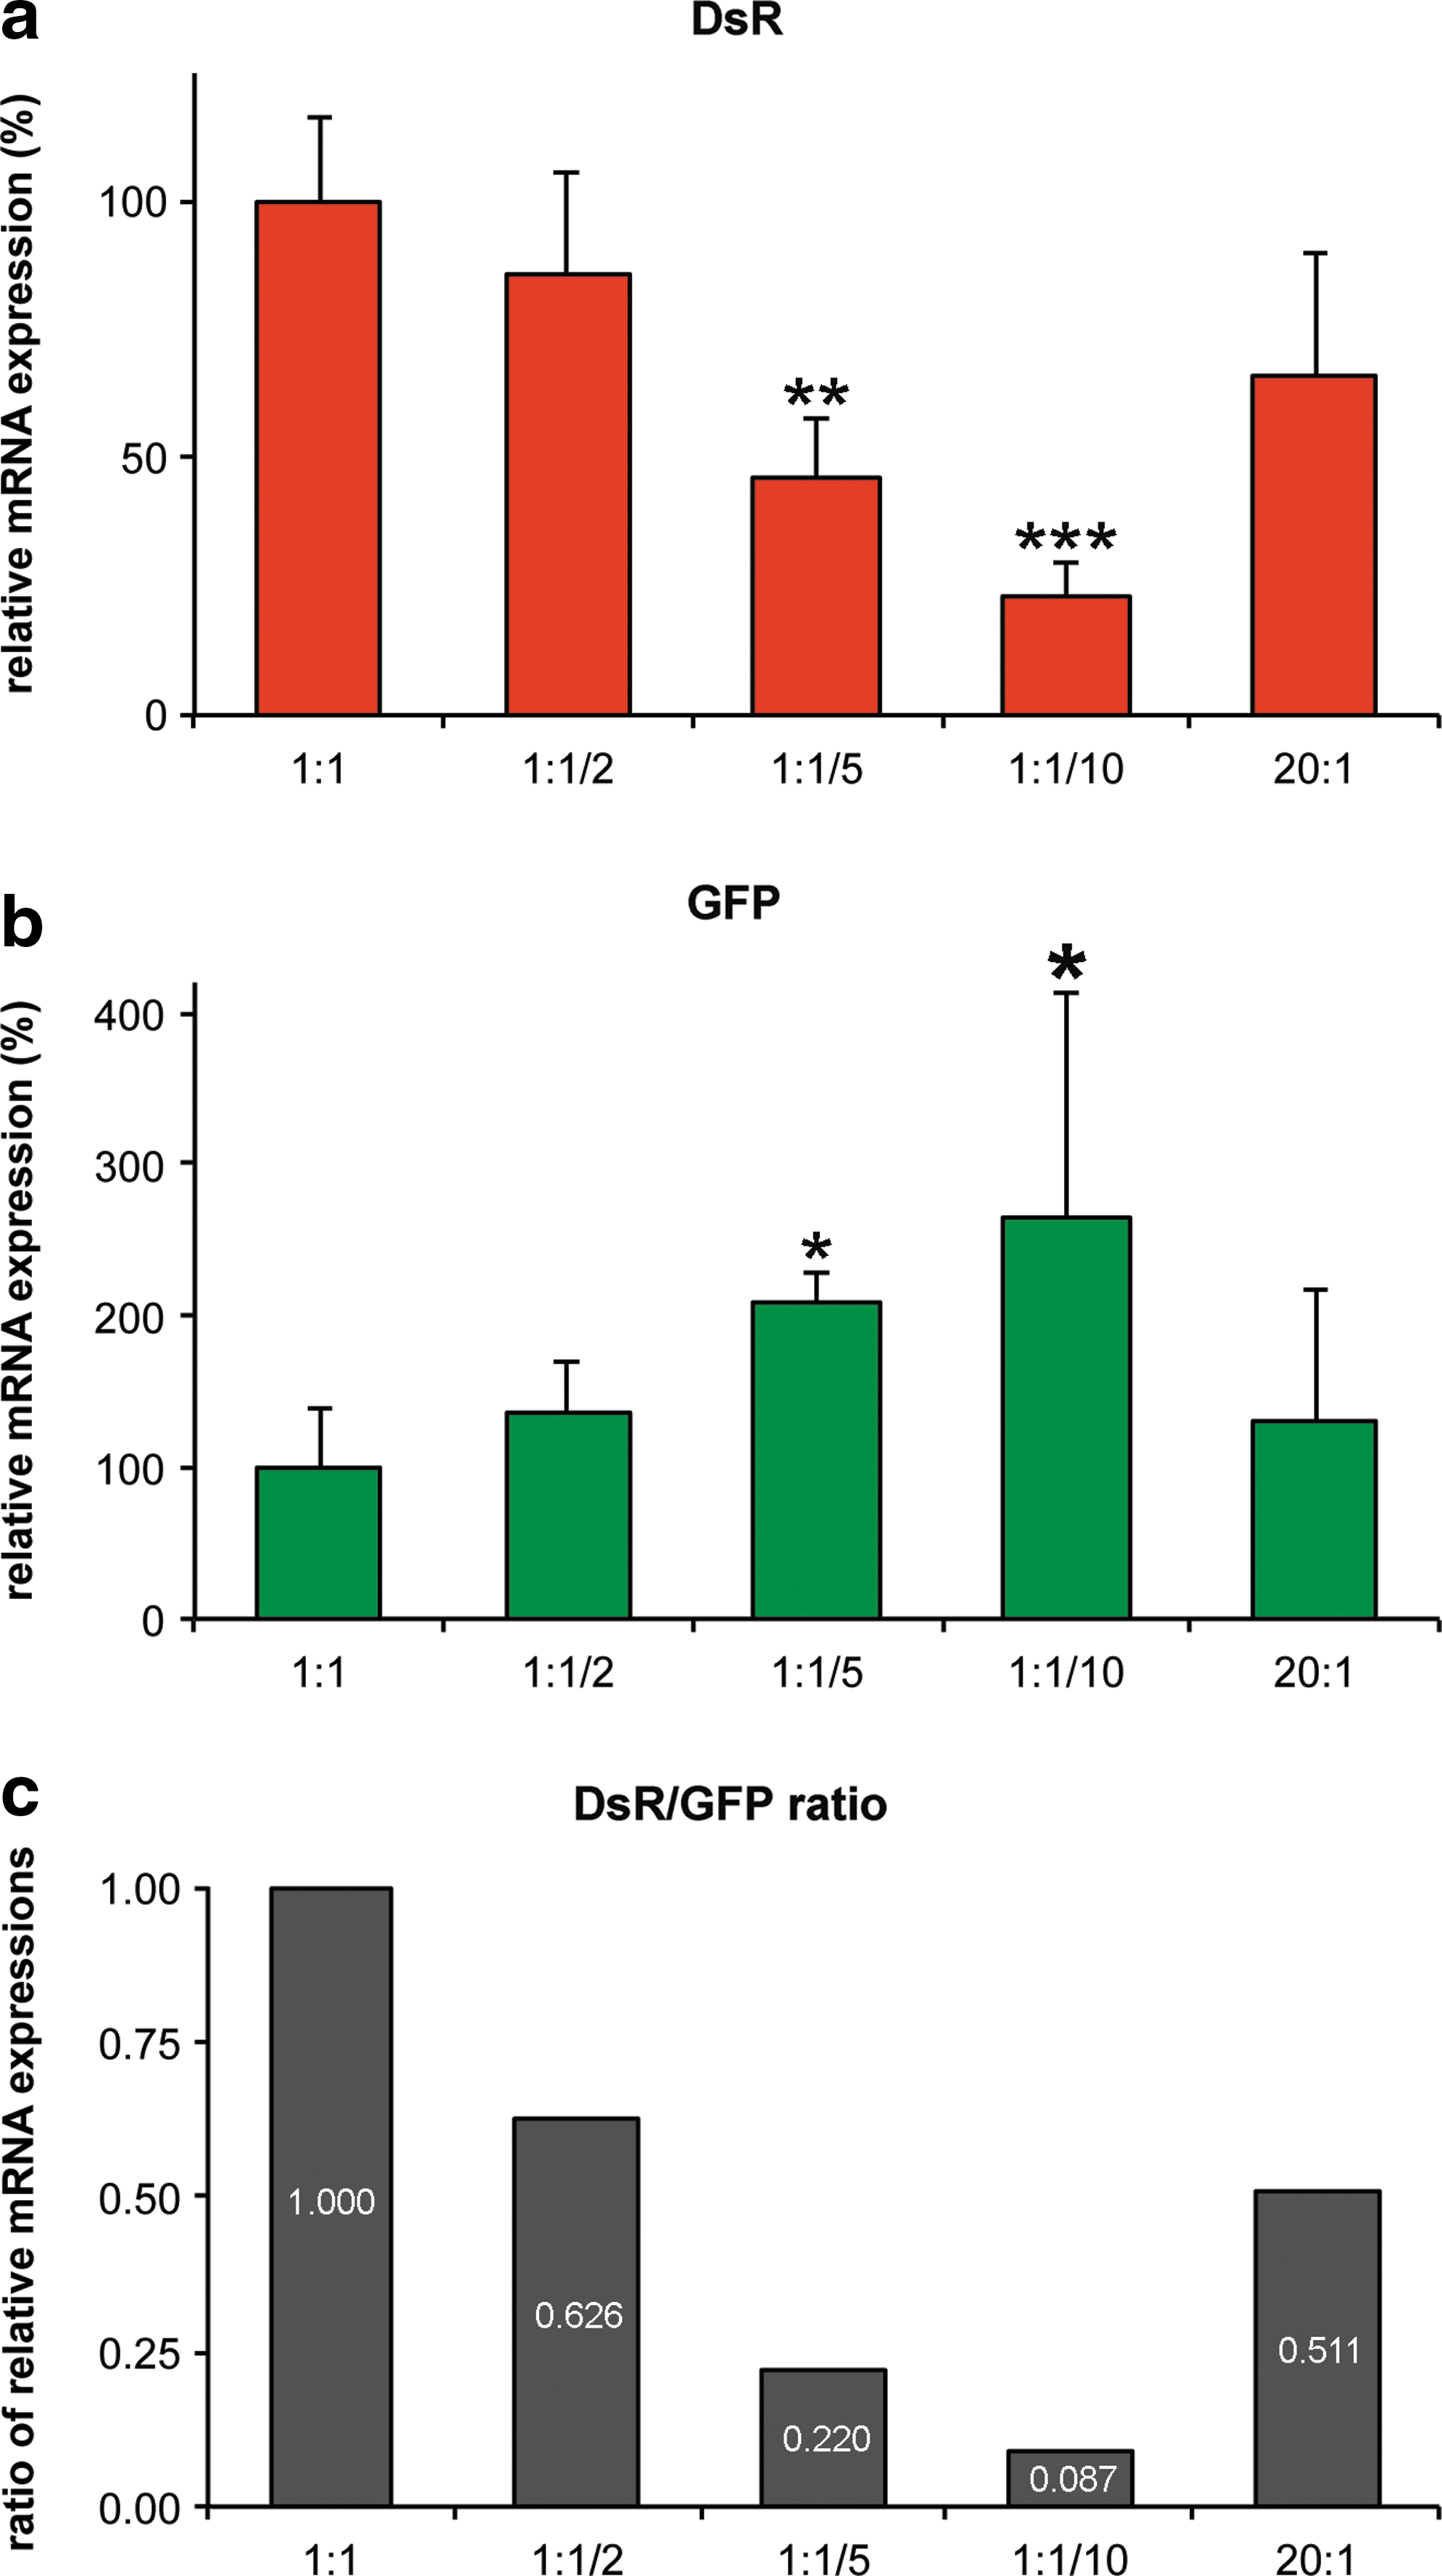
Quantification of mRNA expression of GFP and DsR in transduced photoreceptors. Eyes of adult wild-type mice were subretinally injected with various mixtures of AAV-DsR and AAV-GFP (n=3) as indicated previously. Two weeks postinjection retinas were removed from the eyecups and trypsin-dissociated, labeled cells were isolated by flow cytometry, and total RNA was purified. The bar charts indicate relative expression of
As the proportion of DsR+ cells was consistently lower compared with that of the GFP+ cells we investigated whether differences in the detection efficiencies of the native fluorescence of DsR and GFP may have contributed to this observation. For example, the brightness (defined as extinction coefficient×quantum yield/1000) of GFP (34) is more than double that of DsR (15;
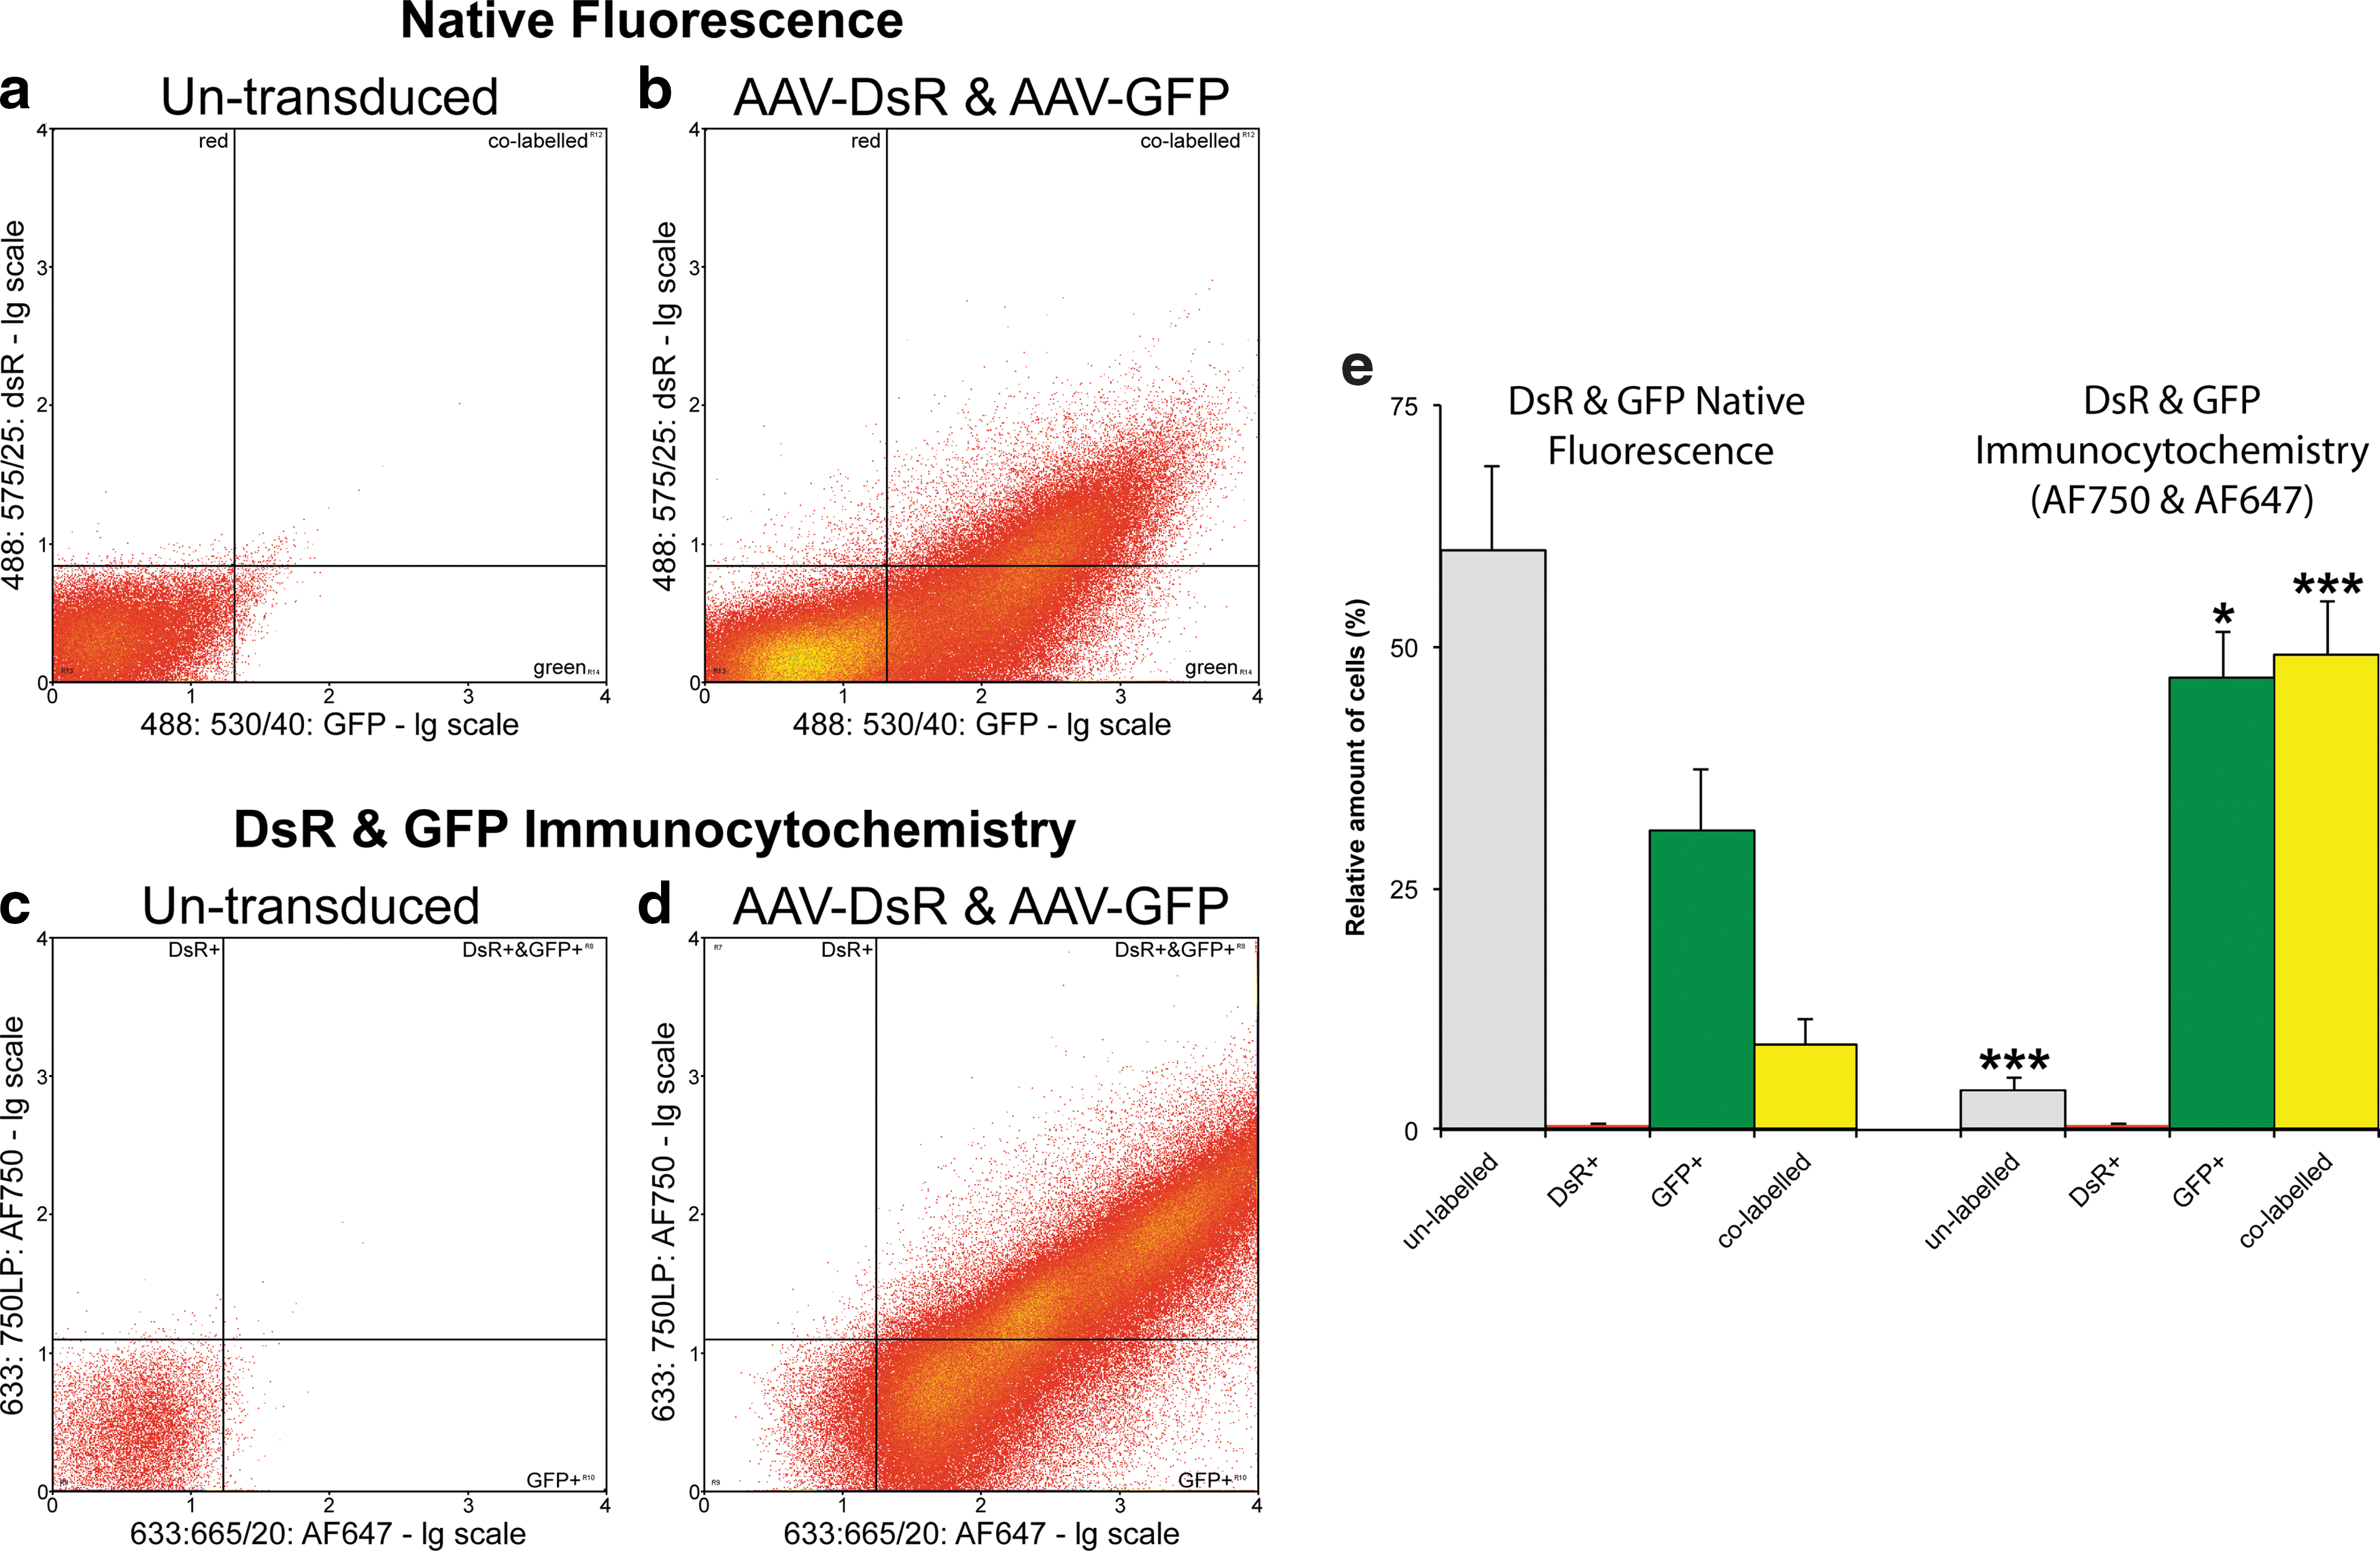
Flow cytometric analysis of reporter gene expression from transduced and control retinas, using native fluorescence and immunocytochemistry. Eyes of adult wild-type mice were subretinally injected with a mixture of 1.5×10⁹ VP of AAV-GFP and 1.5×10⁹ VP of AAV-DsR (1:1 ratio; n=3). Two weeks postinjection retinas were removed from the eyecups, trypsin-dissociated, fixed, and labeled by immunocytochemistry. DsR and GFP were detected with rabbit anti-DsR (Clontech) plus anti-rabbit Alexa Fluor 750 (Invitrogen) and chicken anti-GFP (Abcam) plus anti-chicken Alexa Fluor 647 (Invitrogen), respectively. Native DsR and GFP fluorescence was detected in parallel with the Alexa Fluor signals, using a CyAn ADP analyzer (Beckman Coulter). Representative flow cytometry scattergrams indicate the distribution of cells, using
The data from flow cytometry indicated that in addition to the cells expressing the reporter proteins at sufficient levels to enable detection by native fluorescence, most of the remaining cells also expressed the reporters, albeit at much lower levels. Reporter protein expression at these lower levels was detectable only by fluorescent immunolabeling (Fig. 7). To provide in situ histological evidence of the existence of cells in the retina expressing reporter genes at lower levels, unstained sections from the pool used for detection of native fluorescence (Fig. 4) were reanalyzed, employing immunocytochemistry for detection. We evaluated expression of GFP (as the flow cytometric data suggested that approximately 95% of the cells were GFP+, and the fluorochrome of the secondary antibody used to detect GFP (Alexa Fluor 647) was readily detectable by confocal microscopy). Figure 8 depicts untransduced control (Fig. 8a, c, and e) and AAV-GFP/AAV-DsR (1:1 ratio)-transduced retinas (Fig. 8b, d, and f), using Alexa Fluor 647-labeled GFP immunocytochemistry. In transduced retinas, the Alexa Fluor 647 signal was detectable not only in the photoreceptor cell layer (Fig. 8b, ONL: arrowhead), where the native GFP fluorescence was also evident (Fig. 8d), but also in the inner nuclear layer (Fig. 8b, d, and f; INL: *), where the native GFP signal was not visible. Notably, the untransduced control retinas showed only background labeling for both GFP and Alexa Fluor 647 signals.
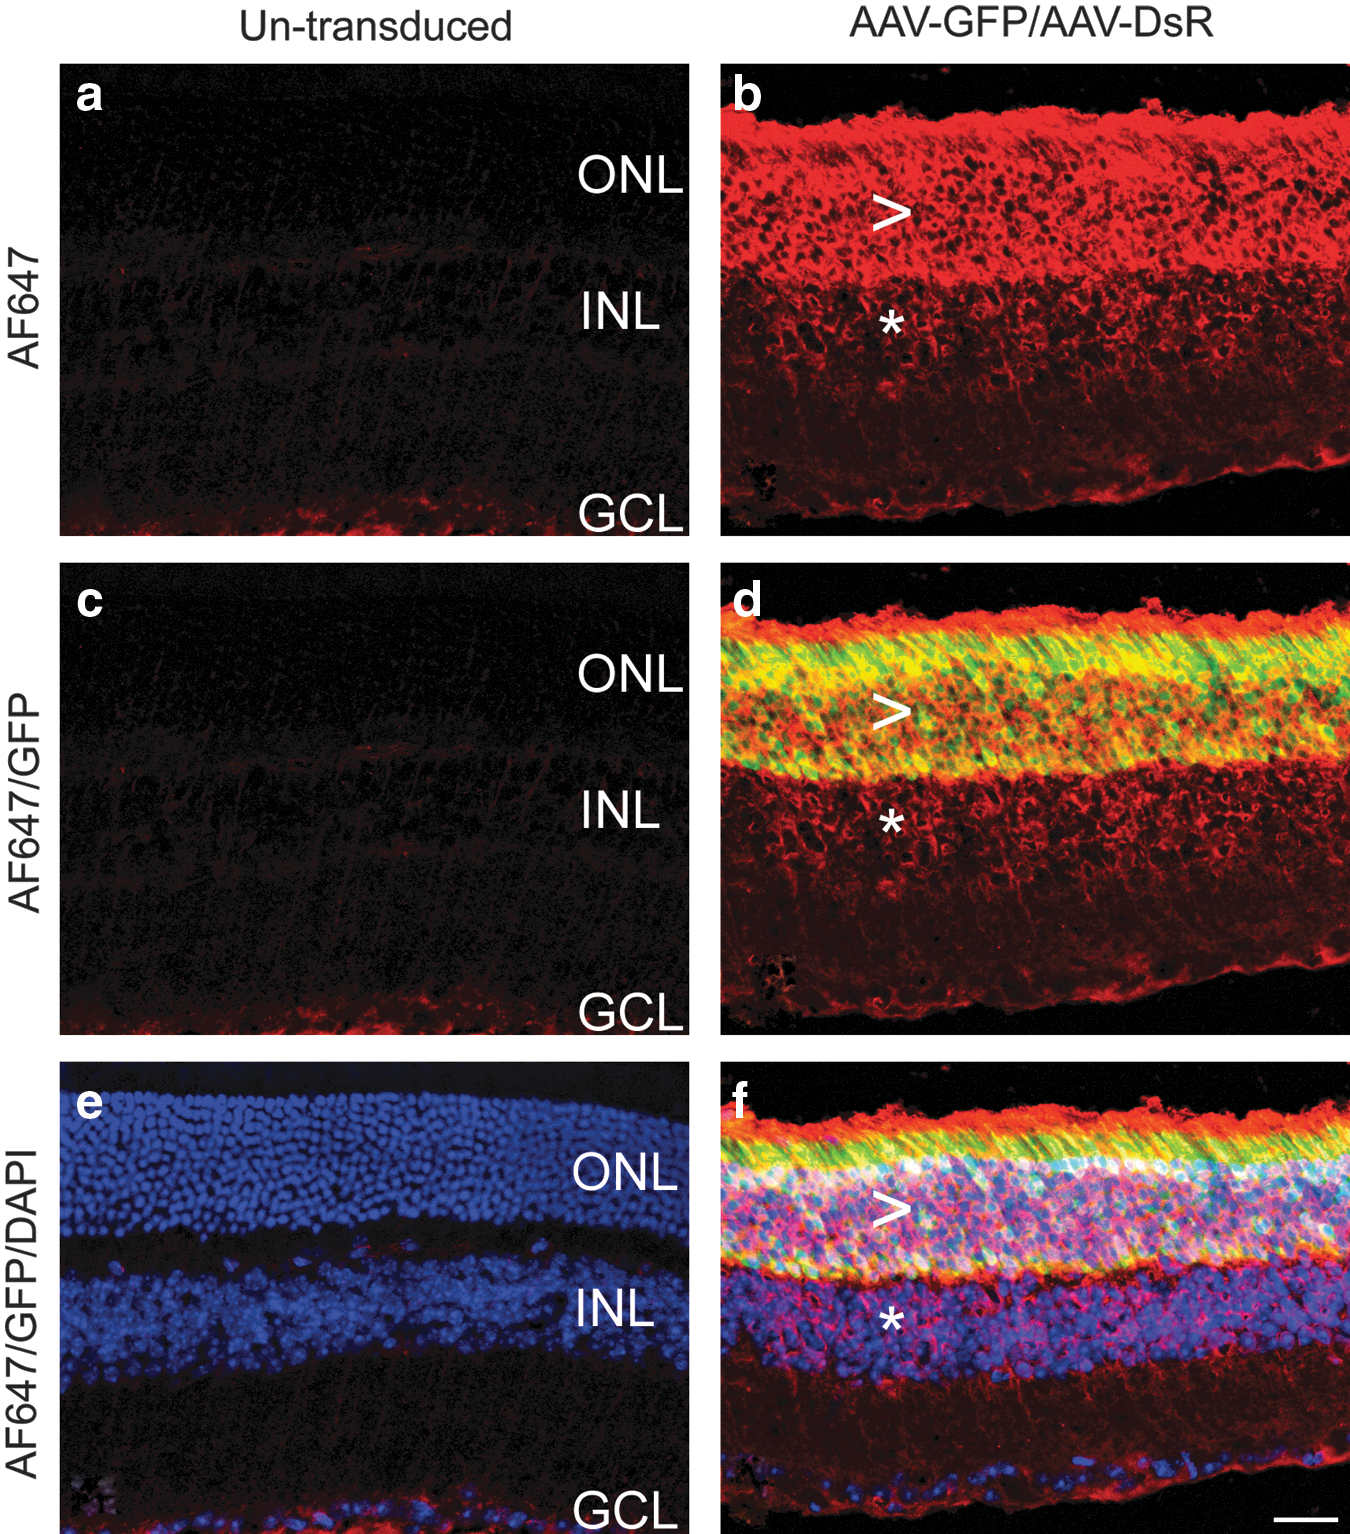
Immunocytochemistry-assisted histological detection of GFP in transduced retinas. Eyes of adult wild-type mice were subretinally injected with 1.5×10⁹ VP of AAV-GFP and 1.5×10⁹ VP of AAV-DsR. Two weeks postinjection eyes were fixed, cryosectioned (10 μm), and processed for GFP immunocytochemistry with chicken anti-GFP (diluted 1:1500; Abcam) and anti-chicken Alexa Fluor 647 antibodies (AF647, diluted 1:1500; Invitrogen). Note that the Alexa Fluor 647 signal was false-colored in red. Nuclei were counterstained with DAPI. Confocal microscopy images illustrate
To demonstrate AAV cotransduction in a neuronal cell type distinct from retinal cells, AAV-DsR and AAV-GFP cotransduction was also explored in the hippocampus, using detection of the native reporter fluorescence. The dentate gyri in adult wild-type rats were stereotaxically injected (coordinates: anteroposterior, −3.8 mm; mediolateral, −1.5 mm; and dorsoventral, −3.5 mm) with a mixture of 0.5×10⁹ VP of AAV-DsR and 0.5×10⁹ VP of AAV-GFP (n=5). Four weeks postinjection brains were fixed and processed for histology. Fluorescence microscopy images of representative sections from the injected area are depicted in Fig. 9. The overlay of the DsR (Fig. 9b) and GFP signals (Fig. 9c) illustrates that a significant proportion of the neurons coexpress the two reporter genes (Fig. 9d and e). As previously, the colabeled cells displayed yellow/orange colors in the overlaid images (Fig. 9d and e). In contrast to retinal transduction, the labeled cells represented a small portion of the total number of cells in the hippocampus and therefore quantitative experiments were not carried out. However, the data support the view that in principle cotransduction of brain neurons with multiple AAV vectors is feasible.
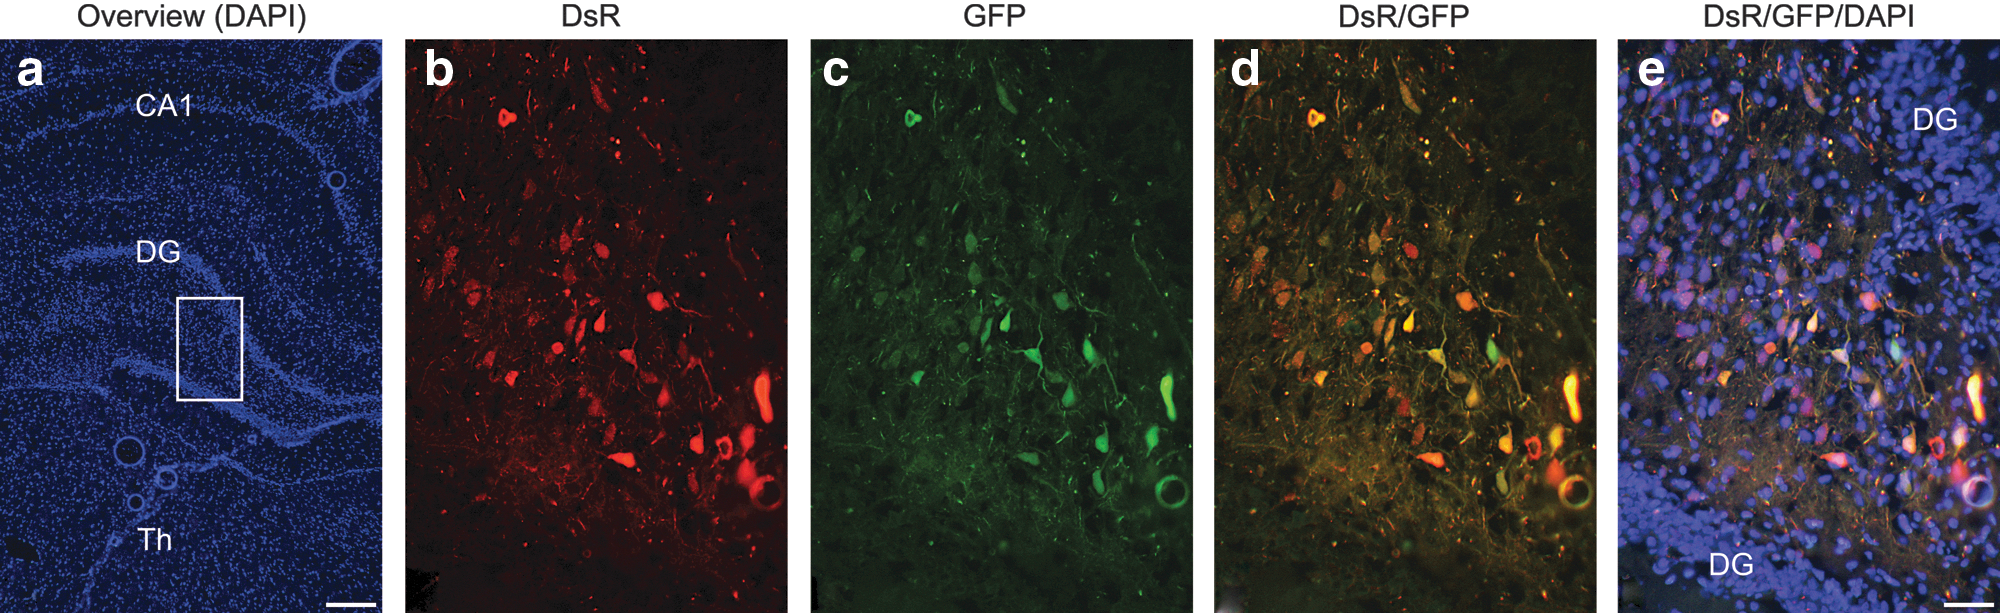
Native fluorescence of reporter proteins in a cotransduced rat hippocampus. The dentate gyri in adult wild-type rat brains were stereotaxically injected (coordinates: anteroposterior, −3.8; mediolateral, −1.5; and dorsoventral, −3.5) with a mixture of 1.5×10⁹ VP of AAV-DsR and 1.5×10⁹ VP of AAV-GFP (n=5). Four weeks postinjection brains were fixed, cryosectioned (10 μm), and processed for histology. Nuclei were counterstained with DAPI.
Discussion
Despite a number of attractive qualities of AAV as a gene delivery vehicle (Kay, 2011), a feature restricting the therapeutic potential of AAV is its limited cargo size of approximately 5 kb (Dong et al., 1996, 2010; Lai et al., 2010; Wu et al., 2010). This not only limits the number of genes that are amenable to AAV delivery but there are certain gene therapy scenarios wherein delivery of two or more components may be preferable, or indeed necessary. For example, dual-component therapies have been used in combination therapies exploiting gene replacement and neurotrophic factor coadministration (Buch et al., 2006) or in various suppression and replacement therapies (Millington-Ward et al., 1997; Kim and Rossi, 2003; Palfi et al., 2006; Kubodera et al., 2011; Millington-Ward et al., 2011). However, the success of such approaches may be directly dependent on the efficiency of cotransduction in the target cells. Although there will clearly be challenges associated with obtaining regulatory approval for dual-vector gene therapies, it is notable that combination therapies are routinely in use for other therapeutic modalities and will likely be explored extensively for gene-based medicines in the future.
Therefore, the focus of this study has been on defining cotransduction efficiencies using two AAV vectors. The retina and the hippocampus were chosen for the study as these are prime targets for AAV delivery to the CNS (Auricchio et al., 2001; Yang et al., 2002; Burger et al., 2004; O'Reilly et al., 2007; McKee et al., 2010; Kay, 2011; Millington-Ward et al., 2011). Recombinant AAV2/5 vectors, each expressing a fluorescent reporter gene, GFP and DsR (AAV-GFP and AAV-DsR), were generated. This enabled fast and robust analysis of transduction by fluorescence microscopy and flow cytometry. Achieving sufficiently high local concentrations of AAV for robust transduction in certain areas of the brain may be challenging with a dose of 1.0×10⁹ VP, which was used in this study. Nevertheless, substantial coexpression of the two reporters (detecting their native fluorescence) has been demonstrated in the dentate gyrus of the rat brain by fluorescence microscopy in this study (Fig. 8). Notably, using higher AAV doses, for example, 2.0×10¹⁰ (which was employed, e.g., in the study by Burger and colleagues, 2004), enables higher transduction rates in hippocampal neurons.
In contrast, delivery of ≥1.5×10⁹ AAV viral particles into the enclosed subretinal space enabled substantial transduction of the mouse retina. Using detection of the native fluorescence of the two reporter proteins, approximately 40–50% coverage of the total retina (Fig. 3) was obtained from a single subretinal injection and an average of 35% of total retinal cells were transduced using 3.0×10⁹ VP. Similar quantities of AAV vectors have previously been used in the mouse eye to obtain functional benefit in disease models (Pawlyk et al., 2005; Chadderton et al., 2009; Palfi et al., 2010; Mao et al., 2012). Given the tropism of AAV2/5, the 35% infectivity obtained corresponded primarily to photoreceptor cells. As this cell type represents approximately 80% of the cells in the mouse retina (Jeon et al., 1998) it can be estimated that approximately 44% of the photoreceptors in the whole retina were transduced. With 40–50% injection coverage of the retina this figure of 44% represents the majority of photoreceptors (>95%) within the targeted area. This qualitative assessment is in good agreement with the histological results obtained (Fig. 4). The potency of transduction together with the viability of retinal cells postdissociation enabled quantification of the rate of photoreceptor cotransduction by flow cytometry.
Initially, native fluorescence of DsR and GFP was analyzed in live retinal cells, and by flow cytometry it was established that approximately 55% of the transduced cells were cotransduced when injected with the 1:1 AAV-GFP:AAV-DsR injection mix (3.0×10⁹ VP in total). A tendency toward higher numbers of GFP-positive cells was apparent in these injections, where apart from the colabeled cells, 38% of cells were GFP+ only and 8% were DsR+ only (Fig. 5). This differential in cell labeling between the two AAV reporter vectors may have been due to different infectious titers of the two AAVs (notably, the same numbers of viral particles based on CMV genomic titers were injected) or potential differences between detection efficiencies of GFP and DsR. For example, the brightness of DsR is less than half that of GFP (
As photoreceptors represent approximately 80% of the cells in the mouse retina (Jeon et al., 1998), the observation of greater than 95% labeled cells suggests that nonphotoreceptor cells must also be transduced. The part of the retina that became detached during AAV delivery may be defined as the injection site. This represents the area of the retina (40–50%) that shows strong native fluorescence from the expressed reporter genes in the photoreceptor and retinal pigment epithelium cell layers. As a strong correlation between both the DsR and GFP signals (Fig. 7b) and Alexa Fluor 750 and Alexa Fluor 647 signals (Fig. 7d) has been observed in cotransduced samples, high levels of expression of one reporter gene are usually paired with high levels of expression of the other reporter. In the inner retinal layers or in parts of the retina outside the injection area, reporter gene expression is substantially lower and below the threshold of native fluorescence detection. Nevertheless, most of these cells still express the reporter genes and expression was readily detected with immunolabeled flow cytometry. In addition, histological evidence for the presence of transduced inner retinal cells that were not positive for native GFP fluorescence but were positive for GFP immunocytochemistry has also been provided (Fig. 8). In support of these results, which suggest an almost pan-retinal transduction when 3.0×10⁹ VP of AAV2/5 is administered subretinally in mice, it is worth noting that Stieger and colleagues (2009), using direct detection of AAV2/5 particles by electron microscopy, found AAV2/5 capsids in all layers of the dog retina after subretinal injection. This phenomenon was AAV capsid dependent and a different pattern of AAV2/2 distribution in the retina was observed after subretinal injection (Stieger et al., 2009). The presence of AAV beyond the injection area was also detected in other studies (Provost et al., 2005; Jacobson et al., 2006; Stieger et al., 2008).
Although immunocytochemistry increased the detection efficiency of both reporter proteins significantly, the relative ratio of cotransduced cells amongst the transduced cells did not increase compared with that detected by native live fluorescence (50–55%). Approximately half of the labeled cells were colabeled and the remaining half were GFP+ only, when using immunocytochemical detection. Factors, such as different infectious titers of the two AAV preparations, may account for the differential results between GFP and DsR labeling. Furthermore, Bennicelli and colleagues (2008) have demonstrated that employing a larger backbone in the plasmid carrying the transgene(s) used for AAV production (see Materials and Methods) increased gene expression, primarily as a result of decreased mispackaging of the backbone. As plasmids without this backbone modification were used to produce AAV-DsR and AAV-GFP for the study, mispackaging of the backbone may have resulted in a proportion of AAVs without reporter genes, effectively decreasing the cotransduction rate. One may hypothesize that if the occurrence of DsR-labeled cells had been equal to that of GFP, the percentage of colabeled cells would have been higher.
In addition, mRNA levels corresponding to expression of the reporter genes in the cotransduced cell populations have been evaluated. Decreasing AAV-DsR in the injection mix not only decreased the colabeled cell population but also the relative expression of DsR mRNA in these cells. For example, in the 1:1/2, 1:1/5, and 1:1/10 ratio injection mixtures the relative DsR mRNA expression decreased to approximately 86, 46, and 23%, respectively, a trend that was anticipated. In parallel, whereas the viral dose of AAV-GFP administered remained the same in injection mixtures, the expression of GFP mRNA increased to approximately 137, 209, and 264%, respectively, within the AAV-GFP- and AAV-DsR-cotransduced cell population as the dose of AAV-DsR decreased. These data suggest that reducing the quantity of AAV-DsR enabled more AAV-GFP transduction to occur. In contrast, when the quantity of AAV-GFP was increased 20-fold (3.0×10¹⁰ VP) while AAV-DsR remained at 1.5×10⁹ VP, GFP expression increased relatively modestly to approximately 129% and DsR expression declined to approximately 66% within the cotransduced cell population. Clearly the expression levels of the two reporter genes in cotransduced cells are dependent on both the quantities and ratios of the two AAVs in the injection mixture. In addition, it appears that at a viral dose of greater than 3.0×10⁹ VP the expression levels of these transgenes tend to plateau in the cotransduced cells. For example, a significant increase in the dose of one vector (20-fold) did not result in a linear increase in transgene expression. Notably, these data relate to the experimental setup used in this study. Nevertheless, establishing the quantity of viral particles at which expression levels plateau from a single AAV or a combination of AAV vectors would be beneficial for many studies. The results therefore highlight the importance of optimizing the number of viral particles for each AAV-expressed transgene in a given target cell type.
Various CNS disorders may be amenable to gene therapies using multicomponent AAV strategies (Muramatsu et al., 2002; Farrar et al., 2010; Kay, 2011). For example, in models of Parkinson's disease coexpression of three dopamine-synthesizing enzymes proved beneficial (Muramatsu et al., 2002). Furthermore, spatial and temporal control of transgene expression could be mediated by a second AAV vector expressing, for example, inducible Cre recombinase (Li et al., 2006). In the case of therapies for mendelian diseases in which the underlying mutation is unknown, a combination therapy of antioxidants and/or growth factors may prolong cell survival and function (Komeima et al., 2007; Yang et al., 2009; Li et al., 2010). To treat patients with retinal degenerations it is possible that multivalent therapeutic strategies may be required. For example, for patients with later stages of retinal degeneration, in whom the remaining photoreceptor cell numbers are minimal, optogenetic strategies may provide a therapeutic solution (Cepko, 2010). Optogenetics enables other retinal cells to respond to light, thereby bypassing the naturally occurring photoreceptor-based perception of light (Lagali et al., 2008; Busskamp et al., 2010; Caporale et al., 2011). It may be that for these strategies, supplementation with growth factors and/or antioxidants may enhance viability of the treated retinal cells (Komeima et al., 2007; Yang et al., 2009; Cepko, 2010; Li et al., 2010). Notably, the use of multiple gene therapy components in “combination therapies” for retinopathies will likely exceed the cargo capacity of a single AAV vector and could therefore benefit from the dual (or triple) AAV delivery strategy explored in the current study.
In summary, given the increasing interest in the use of dual-AAV vector therapies for delivery of large transgenes or multivalent therapies, the objective of this study was to explore cotransduction of two AAV vectors in the CNS. The results obtained demonstrate that potent cotransduction can be achieved in both brain and retina after codelivery of two AAV2/5 vectors. Quantitative analyses revealed up to 50–55% cotransduction in our experimental setup. Immunocytochemical detection of the reporter proteins suggested that their expression was more widespread than detected by their native fluorescence. In addition, it has become apparent that the level of transgene expression achieved from each cotransduced AAV vector is not solely dependent on the absolute quantity of vector delivered but is also significantly influenced by the relative ratio of each AAV vector. For any therapy involving two AAVs, this codependence must be evaluated and optimized such that the correct level of transgene expression from each virus is obtained. Moreover, analysis of transgene expression in cotransduced cells revealed that increasing the dose of AAV vector did not necessarily provide a concomitant increase in levels of transgene expression in photoreceptors. Establishing the quantity of viral particles at which expression levels plateau is important in order to optimize the potential therapeutic benefit derived from multiple component therapies.
Footnotes
Acknowledgments
The authors thank the staff of the Bioresources Unit (Trinity College Dublin) for animal husbandry, Matthew A. Carrigan and Karsten Hokamp (Department of Genetics, Trinity College Dublin) for analysis of the Ensembl database, and Gavin MacManus (School of Biochemistry and Immunology, Trinity College Dublin) for confocal microscopy. This research was supported by grant awards from the Science Foundation Ireland and Fighting Blindness Ireland. A.B.F. is a recipient of an International Society for Advancement of Cytometry Scholar Award.
Author Disclosure Statement
G.J.F. and P.F.K. are directors of Genable Technologies; A.P. and N.C. are consultants for Genable Technologies. These authors have competing interests.
References
Supplementary Material
Please find the following supplemental material available below.
For Open Access articles published under a Creative Commons License, all supplemental material carries the same license as the article it is associated with.
For non-Open Access articles published, all supplemental material carries a non-exclusive license, and permission requests for re-use of supplemental material or any part of supplemental material shall be sent directly to the copyright owner as specified in the copyright notice associated with the article.