
Abstract
We have examined whether Ad.sTβRFc and TAd.sTβRFc, two oncolytic viruses expressing soluble transforming growth factor-β receptor II fused with human Fc (sTGFβRIIFc), can be developed to treat bone metastasis of prostate cancer. Incubation of PC-3 and DU-145 prostate tumor cells with Ad.sTβRFc and TAd.sTβRFc produced sTGFβRIIFc and viral replication; sTGFβRIIFc caused inhibition of TGF-β-mediated SMAD2 and SMAD3 phosphorylation. Ad(E1-).sTβRFc, an E1– adenovirus, produced sTGFβRIIFc but failed to replicate in tumor cells. To examine the antitumor response of adenoviral vectors, PC-3-luc cells were injected into the left heart ventricle of nude mice. On day 9, mice were subjected to whole-body bioluminescence imaging (BLI). Mice bearing hind-limb tumors were administered viral vectors via the tail vein on days 10, 13, and 17 (2.5×10¹⁰ viral particles per injection per mouse, each injection in a 0.1-ml volume), and subjected to BLI and X-ray radiography weekly until day 53. Ad.sTβRFc, TAd.sTβRFc, and Ad(E1-).sTβRFc caused significant inhibition of tumor growth; however, Ad.sTβRFc was the most effective among all the vectors. Only Ad.sTβRFc and TAd.sTβRFc inhibited tumor-induced hypercalcemia. Histomorphometric and synchrotron micro-computed tomographic analysis of isolated bones indicated that Ad.sTβRFc induced significant reduction in tumor burden, osteoclast number, and trabecular and cortical bone destruction. These studies suggest that Ad.sTβRFc and TAd.sTβRFc can be developed as potential new therapies for prostate cancer bone metastasis.
Introduction
Transforming growth factor (TGF-β) has been shown to play an important role in controlling bone metastasis of prostate cancer (Massague, 2008; Sato et al., 2008; Nguyen et al., 2009; Juarez and Guise, 2011). Prostate tumor cells are known to produce TGF-β1 (Barrett et al., 2006), and high levels of TGF-β1 in the blood circulation, and TGF-β-dependent SMAD phosphorylation pathways in the tumors are poor prognostic markers of prostate cancer (Shariat et al., 2001; Lu et al., 2007; Schroten et al., 2011). Therefore, targeting TGF-β is an attractive approach for the treatment of bone metastases (Iyer et al., 2005; Massague, 2008; Sato et al., 2008; Jones et al., 2009; Nguyen et al., 2009; Juarez and Guise, 2011; Mishra et al., 2011). Considering these, and other studies that suggest oncolytic adenoviruses as a potential new class of antitumor agents (Bischoff et al., 1996; de Vrij et al., 2010; Toth et al., 2010), our laboratory is interested in developing recombinant oncolytic adenoviruses that will kill tumor cells and simultaneously target the TGF-β pathways. We have created Ad.sTβRFc, an oncolytic adenovirus expressing sTGFβRIIFc, a protein that can directly target TGF-β and inhibit TGF-β signaling (Seth et al., 2006; Hu et al., 2010a). Because human telomerase reverse transcriptase (TERT) promoter is generally expressed at higher levels in prostate cancer (Shay and Bacchetti, 1997), we have also developed an oncolytic adenovirus, TAd.sTβRFc (Hu et al., 2010a), which is similar to Ad.sTβRFc except that the human TERT promoter drives adenoviral replication.
In this study, we have examined the effects of systemic administrations of Ad.sTβRFc, TAd.sTβRFc, and Ad(E1-).sTβRFc (a nonreplicating virus expressing sTGFβRIIFc) in a prostate cancer bone metastasis model. Our results show that infection of prostate tumor cells with Ad(E1-).sTβRFc, Ad.sTβRFc, and TAd.sTβRFc produced sTGFβRIIFc protein, resulting in the inhibition of TGF-β signaling; and that Ad.sTβRFc and TAd.sTβRFc produced high levels of viral replication in tumor cells. We have shown that intravenous injection of Ad.sTβRFc and TAd.sTβRFc caused inhibition of skeletal tumor growth and tumor-induced hypercalcemia. Ad(E1-).sTβRFc exhibited antitumor activity, albeit weaker than that of oncolytic adenoviruses, and did not inhibit hypercalcemia. Our work described here suggests that Ad.sTβRFc and TAd.sTβRFc, the two oncolytic adenoviruses targeting TGF-β signaling, can be developed as potential drugs for the treatment of prostate cancer bone metastases.
Materials and Methods
Cell culture
PC-3 and DU-145 (human prostate tumor cell lines), and TRAMP-C2, a mouse prostate tumor cell line, were purchased from the American Type Culture Collection (ATCC, Manassas, VA), and the PC-3-luc cell line was produced by transducing PC-3 cells with a retrovirus expressing luciferase gene as previously described (Loberg et al., 2006). All prostate tumor cell lines were cultured in RPMI 1640 medium containing 10% fetal calf serum. HEK293, a human embryonic kidney epithelial cell line (ATCC), was maintained in Dulbecco's modified Eagle's medium (DMEM) containing 10% fetal calf serum. All medium components were purchased from Gibco/Invitrogen (Grand Island, NY).
Adenoviral vectors
Adenoviral vectors used in these studies were as follows: Ad(E1-).sTβRFc, an E1– adenovirus expressing sTGFβRIIFc; Ad.GFPluc, an adenovirus expressing the GFP–luc gene; Ad.sTβRFc, an oncolytic adenovirus expressing the sTGFβRIIFc gene; and TAd.sTβRFc, an oncolytic adenovirus expressing the sTGFβRIIFC gene except that the TERT promoter drives viral replication. Oncolytic adenoviruses were constructed with a dl01/07 mutant of Ad5, containing two deletion mutations in the E1A region (Howe et al., 2000) as previously described (Seth et al., 2006; Hu et al., 2010a). Adenoviral vectors were grown in HEK293 cells and purified by double CsCl2 gradient centrifugation as described (Katayose et al., 1995). Viral particle (VP) numbers were determined by measuring the optical density at 260 nm (OD260) of sodium dodecyl sulfate-treated purified adenoviral solutions.
Adenoviral replication assay
Cells were plated in 6-well dishes (4×10⁵ cells per well). The next day, cells were incubated with adenoviral vectors (2.5×10⁴ VP/cell) for 3 hr. Cells were washed three times with medium, and the incubations were continued for 48 hr. Both 3- and 48-hr samples were used to prepare crude viral lysates, and various aliquots were used to infect HEK293 cells. Viral plaque assays were conducted as described earlier (Hu et al., 2010a). Viral titers were represented as viral burst size (an increase in viral titer from 3 to 48 hr) as previously described (Hu et al., 2010a).
Cytotoxicity assays
To examine virus-induced cytotoxicity, cells were plated in 96-well plates (103 cells per well). The next day, cells were infected with various doses of adenoviral vector, and the incubations were continued for 7 days. Cells were washed, fixed, and stained with sulforhodamine B (Sigma-Aldrich, St. Louis, MO), and the absorbance at 564 nm (A564) was measured as previously described (Katayose et al., 1995). Untreated control cells were considered to have 100% survival.
sTGFβRIIFc expression
Cells were plated in 6-well dishes (4×10⁵ cells per well). The next day, cells were infected with various viral vectors (2.5×10³ VP/cell) for 24 hr. Medium was changed to serum-free medium, and the incubations were continued for another 24 hr. Medium was collected and cell lysates were prepared and subjected to Western blot analyses for sTGFβRIIFc expression as previously described (Seth et al., 2006). sTGFβRIIFc levels in the medium were examined by ELISA, using antibodies against the human IgG Fcγ fragment (Jackson ImmunoResearch) as described (Hu et al., 2010b).
SMAD phosphorylation
Cells were plated in 6-well plates (4×10⁵ cells per well). The next day, cells were serum starved overnight. Cells were exposed to TGF-β1 (1 ng/ml; Sigma-Aldrich) in the absence or presence of sTGFβRIIFc (250 ng/ml) for 1 hr, and cell lysates were subjected to Western blot analyses according to published methods (Katayose et al., 1995; Hu et al., 2010a; Gupta et al., 2011). Membranes were treated with phosphorylated SMAD2 (p-SMAD2), p-SMAD3, or SMAD2/3 antibodies (Cell Signaling, Danvers, MA) followed by horseradish peroxidase-conjugated bovine anti-rabbit IgG secondary antibody (Santa Cruz Biotechnology, Santa Cruz, CA). The blots were visualized with enhanced chemiluminescence substrate (GE Healthcare Life Sciences, Piscataway, NJ). The p-SMAD2, p-SMAD3, and total SMAD2/3 protein bands were quantified with IPLab 4.0.8 imaging software (BD Biosciences, San Jose, CA), and the ratios of p-SMADs and total SMAD2/3 were calculated.
Animal model
All animal experiments were conducted according to animal protocols approved by the Institutional Animal Care and Use Committee of the NorthShore University HealthSystem (Evanston, IL). To establish bone metastasis, PC-3-luc cells (2.5×10⁵/mouse) were injected into the left heart ventricle (day 0) of 4-week-old male nude mice (NU/NU) (Charles River Laboratories, Wilmington, MA). On day 9, mice were subjected to bioluminescence imaging (BLI) in the dorsal and ventral positions, using Xenogen IVIS Spectrum imaging equipment (Caliper Life Sciences, Hopkinton, MA). Photon signals were quantified with Living Image software 3.0 as previously described (Hu et al., 2011). Mice were distributed into various groups, with statistically indistinguishable BLI signals within each group. Various viral vectors were administered via the tail vein on days 10, 13, and 17 (2.5×10¹⁰ VP per injection per mouse, each injection in a 0.1-ml volume). The control group of mice was administered buffer alone.
Bioluminescence imaging
Mice were initially imaged in the dorsal and ventral positions on day 9, and once a week until day 53, using the Xenogen IVIS Spectrum system (Caliper Life Sciences) as previously described (Hu et al., 2011). Mice were injected intraperitoneally with 100 μl (150 mg/kg) of the
X-ray radiography imaging
Mice were subjected to X-ray radiography in the prone position, using a Faxitron X-ray system (Faxitron X-Ray, Wheeling, IL). Bone lesions were quantified in the femur and tibia of both hind limbs, using ImageJ software (National Institutes of Health, Bethesda, MD) as described earlier (Hu et al., 2010b, 2011).
Calcium and sTGFβRIIFc measurements in blood
At the terminal time point (day 53), mice were killed after blood collection. Serum was obtained by centrifuging blood at 3000 rpm for 10 min. Calcium concentrations were measured with a QuantiChrom calcium assay kit (BioAssay Systems, Hayward, CA). sTGFβRIIFc amounts in serum samples were determined by ELISA according to published methods (Hu et al., 2010a).
Tumor burden analyses and osteoclast measurements
Mice were killed on day 53, and long bones were isolated from hind limbs. Tibia and femur were fixed in formaldehyde, paraffin embedded, and sliced, and median sagittal sections were subjected to hematoxylin and eosin (H&E) staining as described (Hu et al., 2011). Slices were photographed (magnification, ×20), tumors were marked (yellow outline), and tumor areas were calculated with NIS-Elements BR 3.10 software (Nikon, Melville, NY). Bone slices were stained with tartrate-resistant acid phosphatase (TRAP) as described (Hu et al., 2011). Tumor–bone interface length was measured, and multinucleated TRAP-positive osteoclasts across the tumor–bone interface were counted on TRAP-stained slices.
Synchrotron micro-computed tomography
Synchrotron micro-computed tomography (microCT), used to image volumes of representative hind limbs of each treatment group, was performed with station 2-BM of the Advanced Photon Source (APS) at Argonne National Laboratory (Argonne, IL), using the dedicated microCT instrument (Wang et al., 2001). The following conditions were used for data collection: 15 keV, 0.12-degree rotation increment, 180-degree rotation range, and (2K)2 reconstructions with 2.9-μm isotropic volume elements (voxels). Three-dimensional (3-D) images of bone sections spanning 3.0 mm below the growth plate regions were constructed with Amira 5.3.2 software (Visage Imaging, San Diego, CA).
Statistical evaluations
All statistical analyses were performed with GraphPad Prism 5 for Windows (GraphPad Software, San Diego, CA). Data are presented as means±SEM. To analyze time course experiments to evaluate BLI signal progression, X-ray-based lesion size progression, and body weight progression, two-way repeated-measure analysis of variance (ANOVA) followed by Bonferroni post-tests was used. For multiple group analyses for BLI signal fold inductions, X-ray-positive lesion sizes, tumor burden, plasma calcium levels, and osteoclast numbers, statistical significance was analyzed by one-way ANOVA followed by Bonferroni post-tests. A chi-square test was used to analyze tumor-free incidence data. p<0.05 was considered a statistically significant difference.
Results
Adenovirus-mediated transgene expression and viral replication in prostate cancer cells
To examine whether prostate cancer cells are appropriate targets for adenoviral vectors, PC-3, DU-145, and TRAMP-C2 cells were infected with Ad.GFPluc for 24 hr and examined under a florescence microscope. Human prostate tumor cell lines PC-3 and DU-145 produced green fluorescent protein (GFP) expression in nearly 100% of cells (Fig. 1A). Mouse tumor cell line TRAMP-C2 also expressed GFP protein, although the signal was slightly weaker. To examine adenovirus-mediated sTGFβRIIFc expression in prostate tumor cells, PC-3, DU-145, and TRAMP-C2 cells were exposed to Ad(E1-).sTβRFc, Ad.sTβRFc, and TAd.sTβRFc for 48 hr, and sTGFβRIIFc expression was examined by Western blot analysis. As shown in Fig. 1B, all three cell lines produced sTGFβRIIFc protein, which was secreted into the extracellular medium (Fig. 1B). The amounts of sTGFβRIIFc in the media from Ad(E1-).sTβRFc-, Ad.sTβRFc-, and TAd.sTβRFc-infected PC-3, DU-145, and TRAMP-C2 cells were in the range of 0.22–8.02 μg/ml (Fig. 1C).

Adenovirus-mediated transgene expression in prostate tumor cells.
To examine the effect of sTGFβRIIFc on TGF-β-mediated signaling, PC-3, DU-145, and TRAMP-C2 cells were exposed to TGF-β1 for 1 hr, and cell lysates were analyzed for the presence of phosphorylated SMAD2 (p-SMAD2) and SMAD3 (p-SMAD3) proteins. Western blot results indicated that in all three cell lines TGF-β1 induced SMAD2 and SMAD3 phosphorylation; however, total SMAD2 and SMAD3 levels were relatively less altered (Fig. 1D). Incubation of TGF-β1 with sTGFβRIIFc reduced TGF-β-dependent SMAD2 and SMAD3 phosphorylation (Fig. 1D). Quantification of p-SMAD2 confirmed TGF-β-mediated induction of p-SMAD2 and p-SMAD3, and the inhibition of TGF-β-dependent SMAD2 and SMAD3 phosphorylation by sTGFβRIIFc in all three cell lines (Fig. 1E and F). Interestingly, basal levels of p-SMAD3 were relatively higher in the TRAMPC-2 tumor cell line, which could partly explain the relatively lesser induction by TGF-β1.
Next, we examined the replication potential of oncolytic viruses in prostate tumor cells. PC-3, DU-145, and TRAMP-C2 cells were exposed to Ad(E1-).sTβRFc, Ad.sTβRFc, or TAd.sTβRFc for 3 or 48 hr, and viral titers (burst sizes) were determined. There was a large increase in viral titers, on the order of 104 per cell, in PC-3 cells infected with Ad.sTβRFc and TAd.sTβRFc, whereas no significant viral titers were observed in cells infected with Ad(E1-).sTβRFc (Fig. 2A). Similar viral titers were observed in DU-145 cells (Fig. 2A). Mouse TRAMP-C2 cells, however, did not support replication of either Ad.sTβRFc or TAd.sTβRFc (Fig. 2A). To examine virus-induced cytotoxicity, prostate tumor cells were exposed to the various viral vectors for 7 days and cytotoxicity assays were conducted, using sulforhodamine assays. Ad.sTβRFc and TAd.sTβRFc infection produced cytotoxicity in PC-3 and DU-145 cells (Fig. 2B and C). The IC50 values of Ad.sTβRFc and TAd.sTβRFc were about 50- to 100-fold lower than that of the nonreplicating Ad(E1-).sTβRFc, indicating that oncolytic adenovirus-induced replication resulted in cytotoxicity in human prostate tumor cells (Fig. 2B and C). As expected, the oncolytic adenoviruses induced minimal cytotoxicity in mouse TRAMP-C2 cells (Fig. 2D). These results indicate that oncolytic adenoviral vectors can replicate and induce cytotoxicity in human prostate cancer cells, whereas mouse cells are not permissive for viral replication and are relatively resistant to the cytotoxic effects of the oncolytic viral vectors. However, in both the PC-3 and DU-145 cell lines, TAd.sTβRFc was slightly weaker than Ad.sTβRFc in producing cytotoxicity and viral replication.
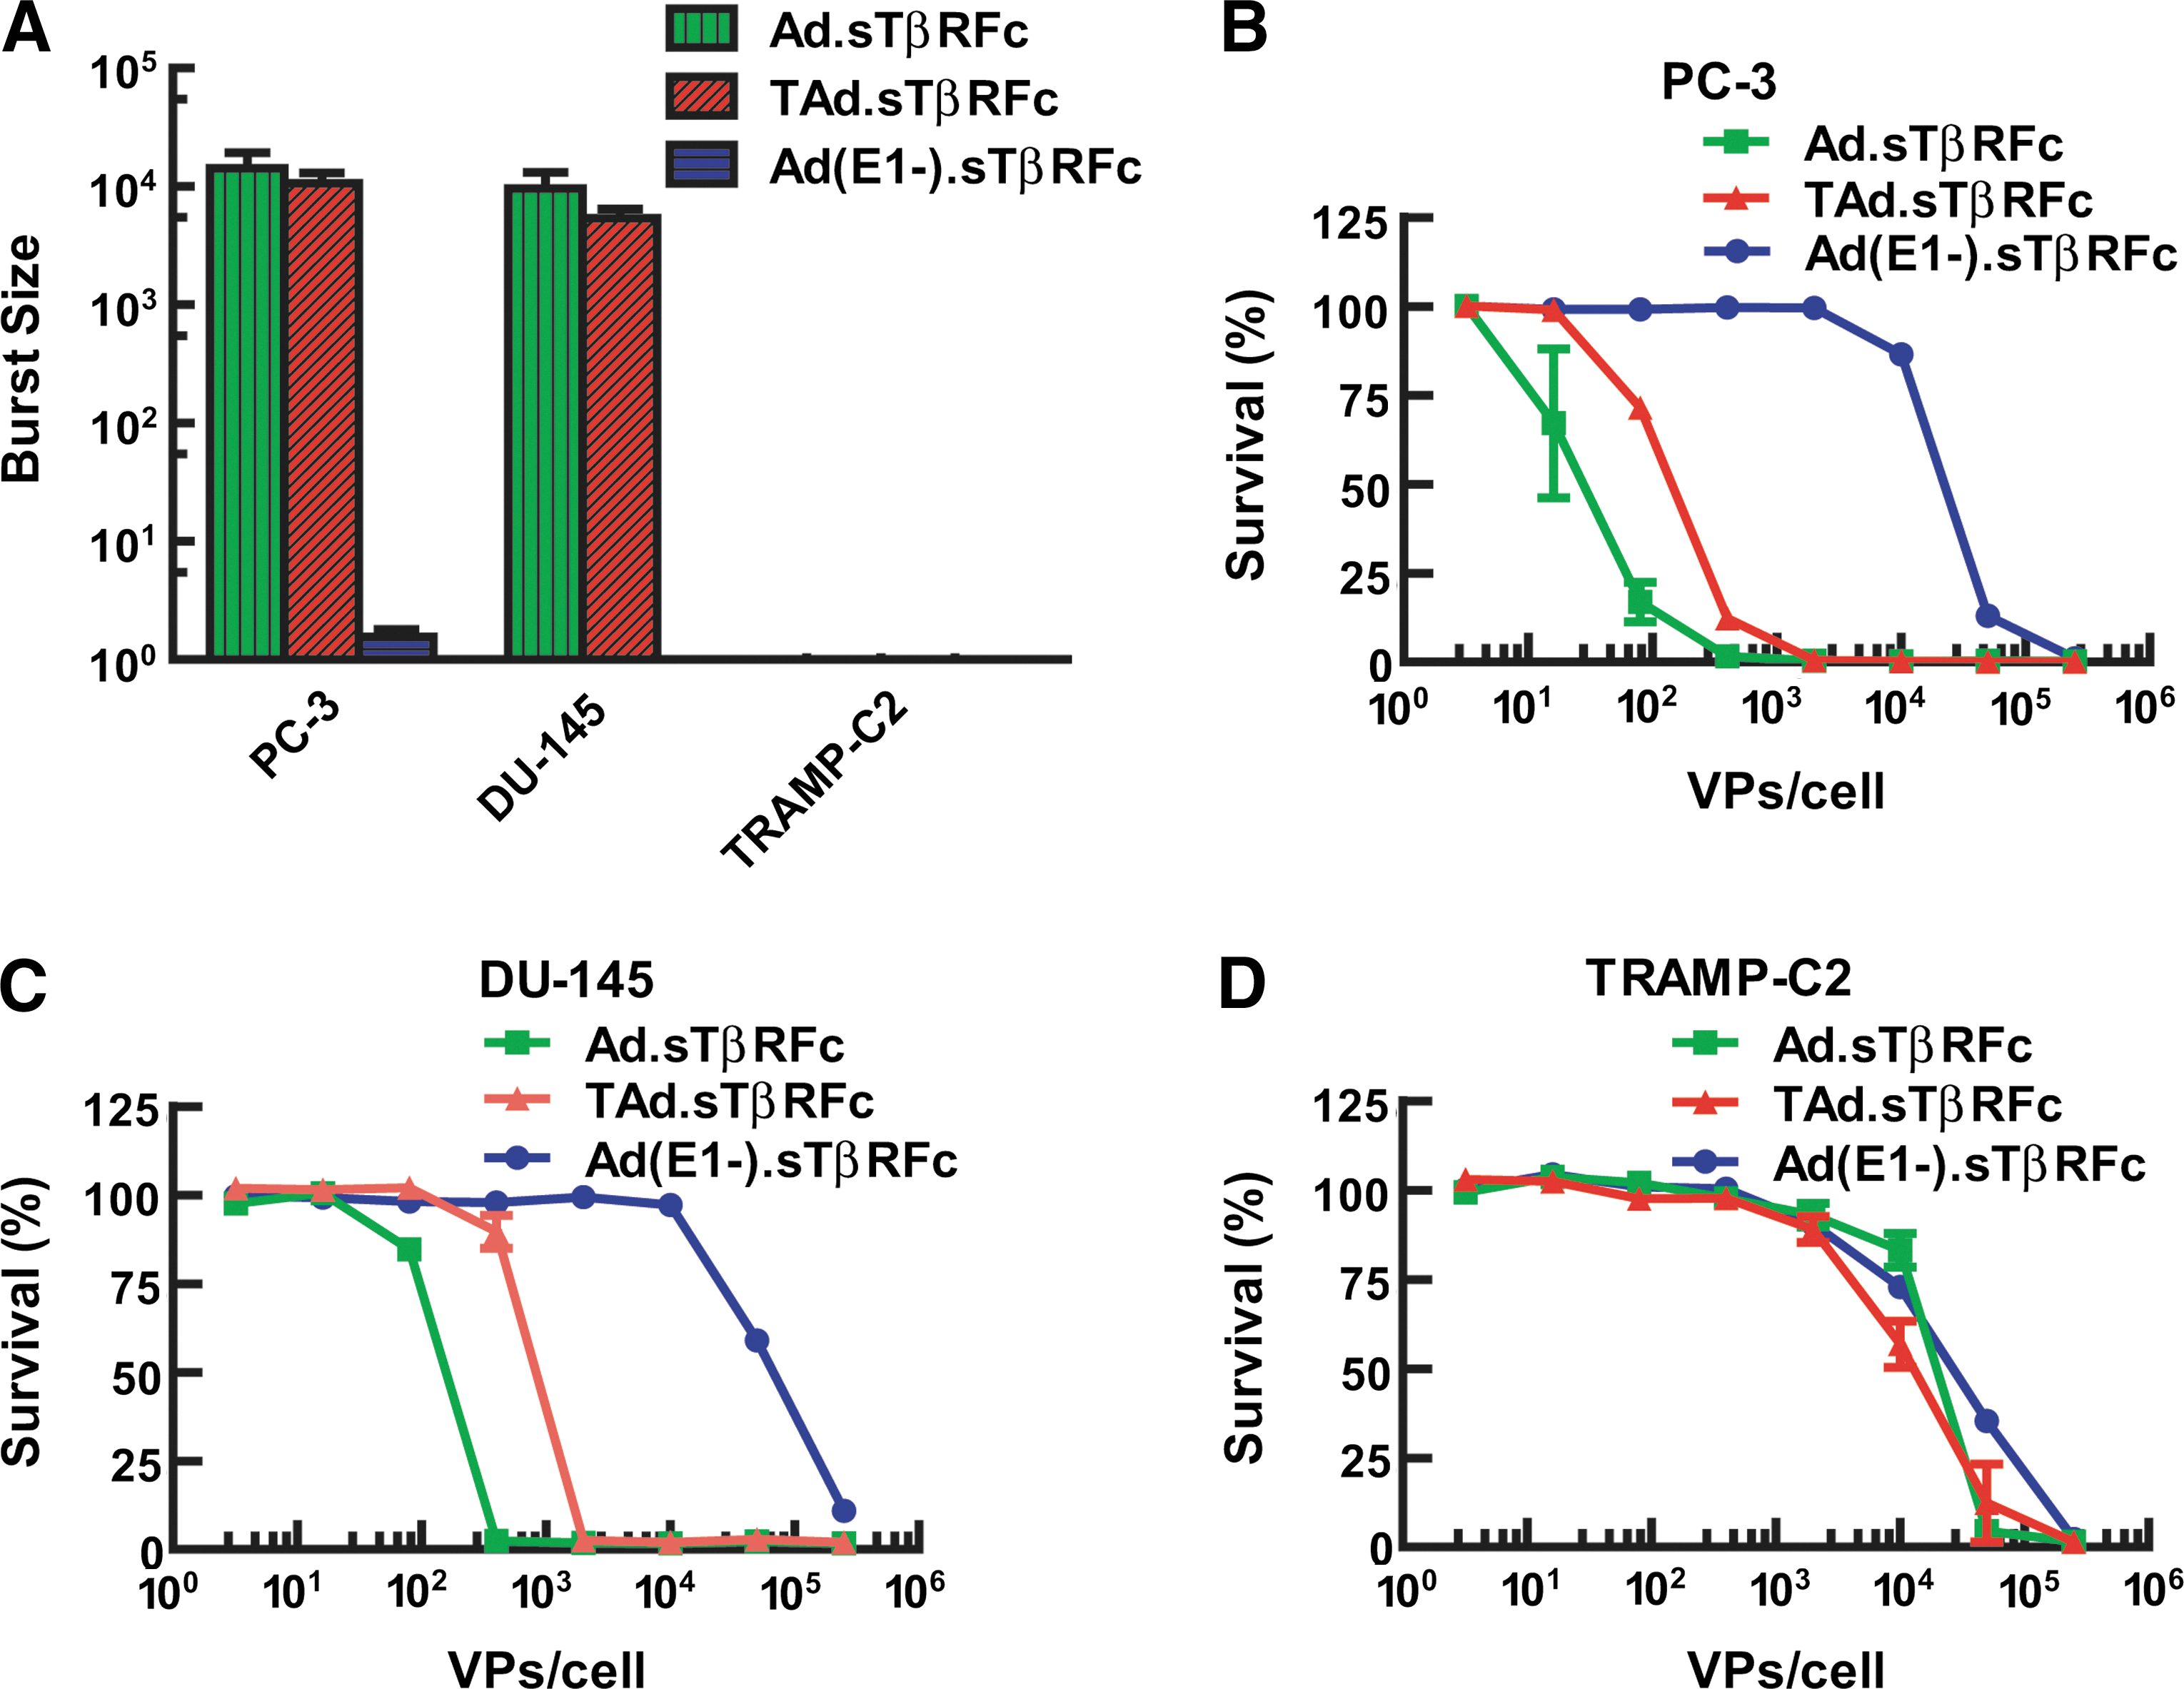
Adenoviral replication and cytotoxicity in prostate tumor cells.
Effect of intravenous injection of adenoviral vectors on prostate cancer bone metastasis: BLI studies
Next, we examined the effect of systemic administration of Ad(E1-).sTβRFc, Ad.sTβRFc, and TAd.sTβRFc on the progression of established prostate cancer bone metastases in a nude mouse model. PC-3-luc cells were injected into the left heart ventricle of male nude mice. After 9 days, mice were subjected to BLI in the dorsal and ventral positions. Mice were distributed into various groups with nearly equal BLI signal in the hind limbs (in the range of 5.11–6.78×10⁵ photons/sec) within each treatment group. On days 10, 13, and 17, mice were injected with buffer or one of the various adenoviral vectors (2.5×10¹⁰ VP per mouse per injection, using 0.1 ml of buffer) via the tail vein. Mice were subjected to whole-body BLI on day 16, and once per week thereafter until day 53. Representative mice (one from each group), imaged in the dorsal and ventral positions on days 9 and 53, are shown in Fig. 3A. BLI signals in the hind limbs (within the red circles indicated in Fig. 3A) were quantified and are shown in Fig. 3B. There was a time-dependent increase in BLI signal reaching 1.38×10¹¹ photons/sec by day 53 in the group of mice that had received buffer alone. During the course of the experiment, there was a significant inhibition of tumor growth in the groups of mice that had received Ad(E1-).sTβRFc (p<0.001), Ad.sTβRFc (p<0.001), and TAd.sTβRFc (p<0.001) (Fig. 3B). The fold increases in BLI signal from day 9 to day 53 were calculated for each of the treatment groups and are shown in Fig. 3C. There was a 117,796±46,380-fold increase in BLI signal from day 9 to day 53 in the buffer-treated group. The fold increases in BLI signal from the groups treated with Ad(E1-).sTβRFc, Ad.sTβRFc, and TAd.sTβRFc were reduced to 13,102±10,070, 6493±5783, and 3887±2567, respectively, which represents significant inhibitions of BLI signal fold increase in the mice treated with Ad(E1-).sTβRFc (p<0.05), Ad.sTβRFc (p<0.05), and TAd.sTβRFc (p<0.05).

Effect of systemic delivery of viral vectors on PC-3-luc bone metastasis: BLI analysis. PC-3-luc cells were injected in male nude mice (NU/NU) on day 0. Initial BLI was performed on day 9; mice with positive hind-limb tumors were administered buffer or viral vectors (via the tail vein) on days 10, 13, and 17. BLIs were conducted in dorsal and ventral positions on various days as shown.
Effect of intravenous injection of adenoviral vectors on prostate cancer bone metastasis: X-ray radiographic analyses
To further examine the effect of Ad(E1-).sTβRFc, Ad.sTβRFc, and TAd.sTβRFc on skeletal metastases, mice were subjected to X-ray radiography once per week, using the Faxitron X-ray system. X-ray images of representative mice in various treatment groups are shown in Fig. 4A; the presence of skeletal tumors is marked by red arrows. In the buffer-treated group osteolytic lesions began to appear by day 16 (Fig. 4A), and the tumor sizes increased over time until day 53 (Fig. 4A and B). There was a significant inhibition of tumor progression in groups treated with Ad(E1-).sTβRFc (p<0.001), Ad.sTβRFc (p<0.001), and TAd.sTβRFc (p<0.001) (Fig. 4B). On day 53, the lesion size in the buffer-treated group was 13.16±2.59 mm2 (Fig. 4C); tumor sizes in groups treated with Ad(E1-).sTβRFc, Ad.sTβRFc, and TAd.sTβRFc were 6.84±1.56, 2.22±1.11, and 4.76±1.47 mm2, respectively (Fig. 4C). These results indicate that Ad(E1-).sTβRFc treatment did not cause a significant reduction in tumor size. However, there was significant inhibition of tumor growth in the Ad.sTβRFc (p<0.001) and TAd.sTβRFc (p<0.05) treatment groups compared with the buffer group (Fig. 4C). On the basis of this we conclude that adenoviruses expressing sTGFβRIIFc are effective in inhibiting the progression of skeletal metastases; however, oncolytic viruses exhibited superior antitumor responses.
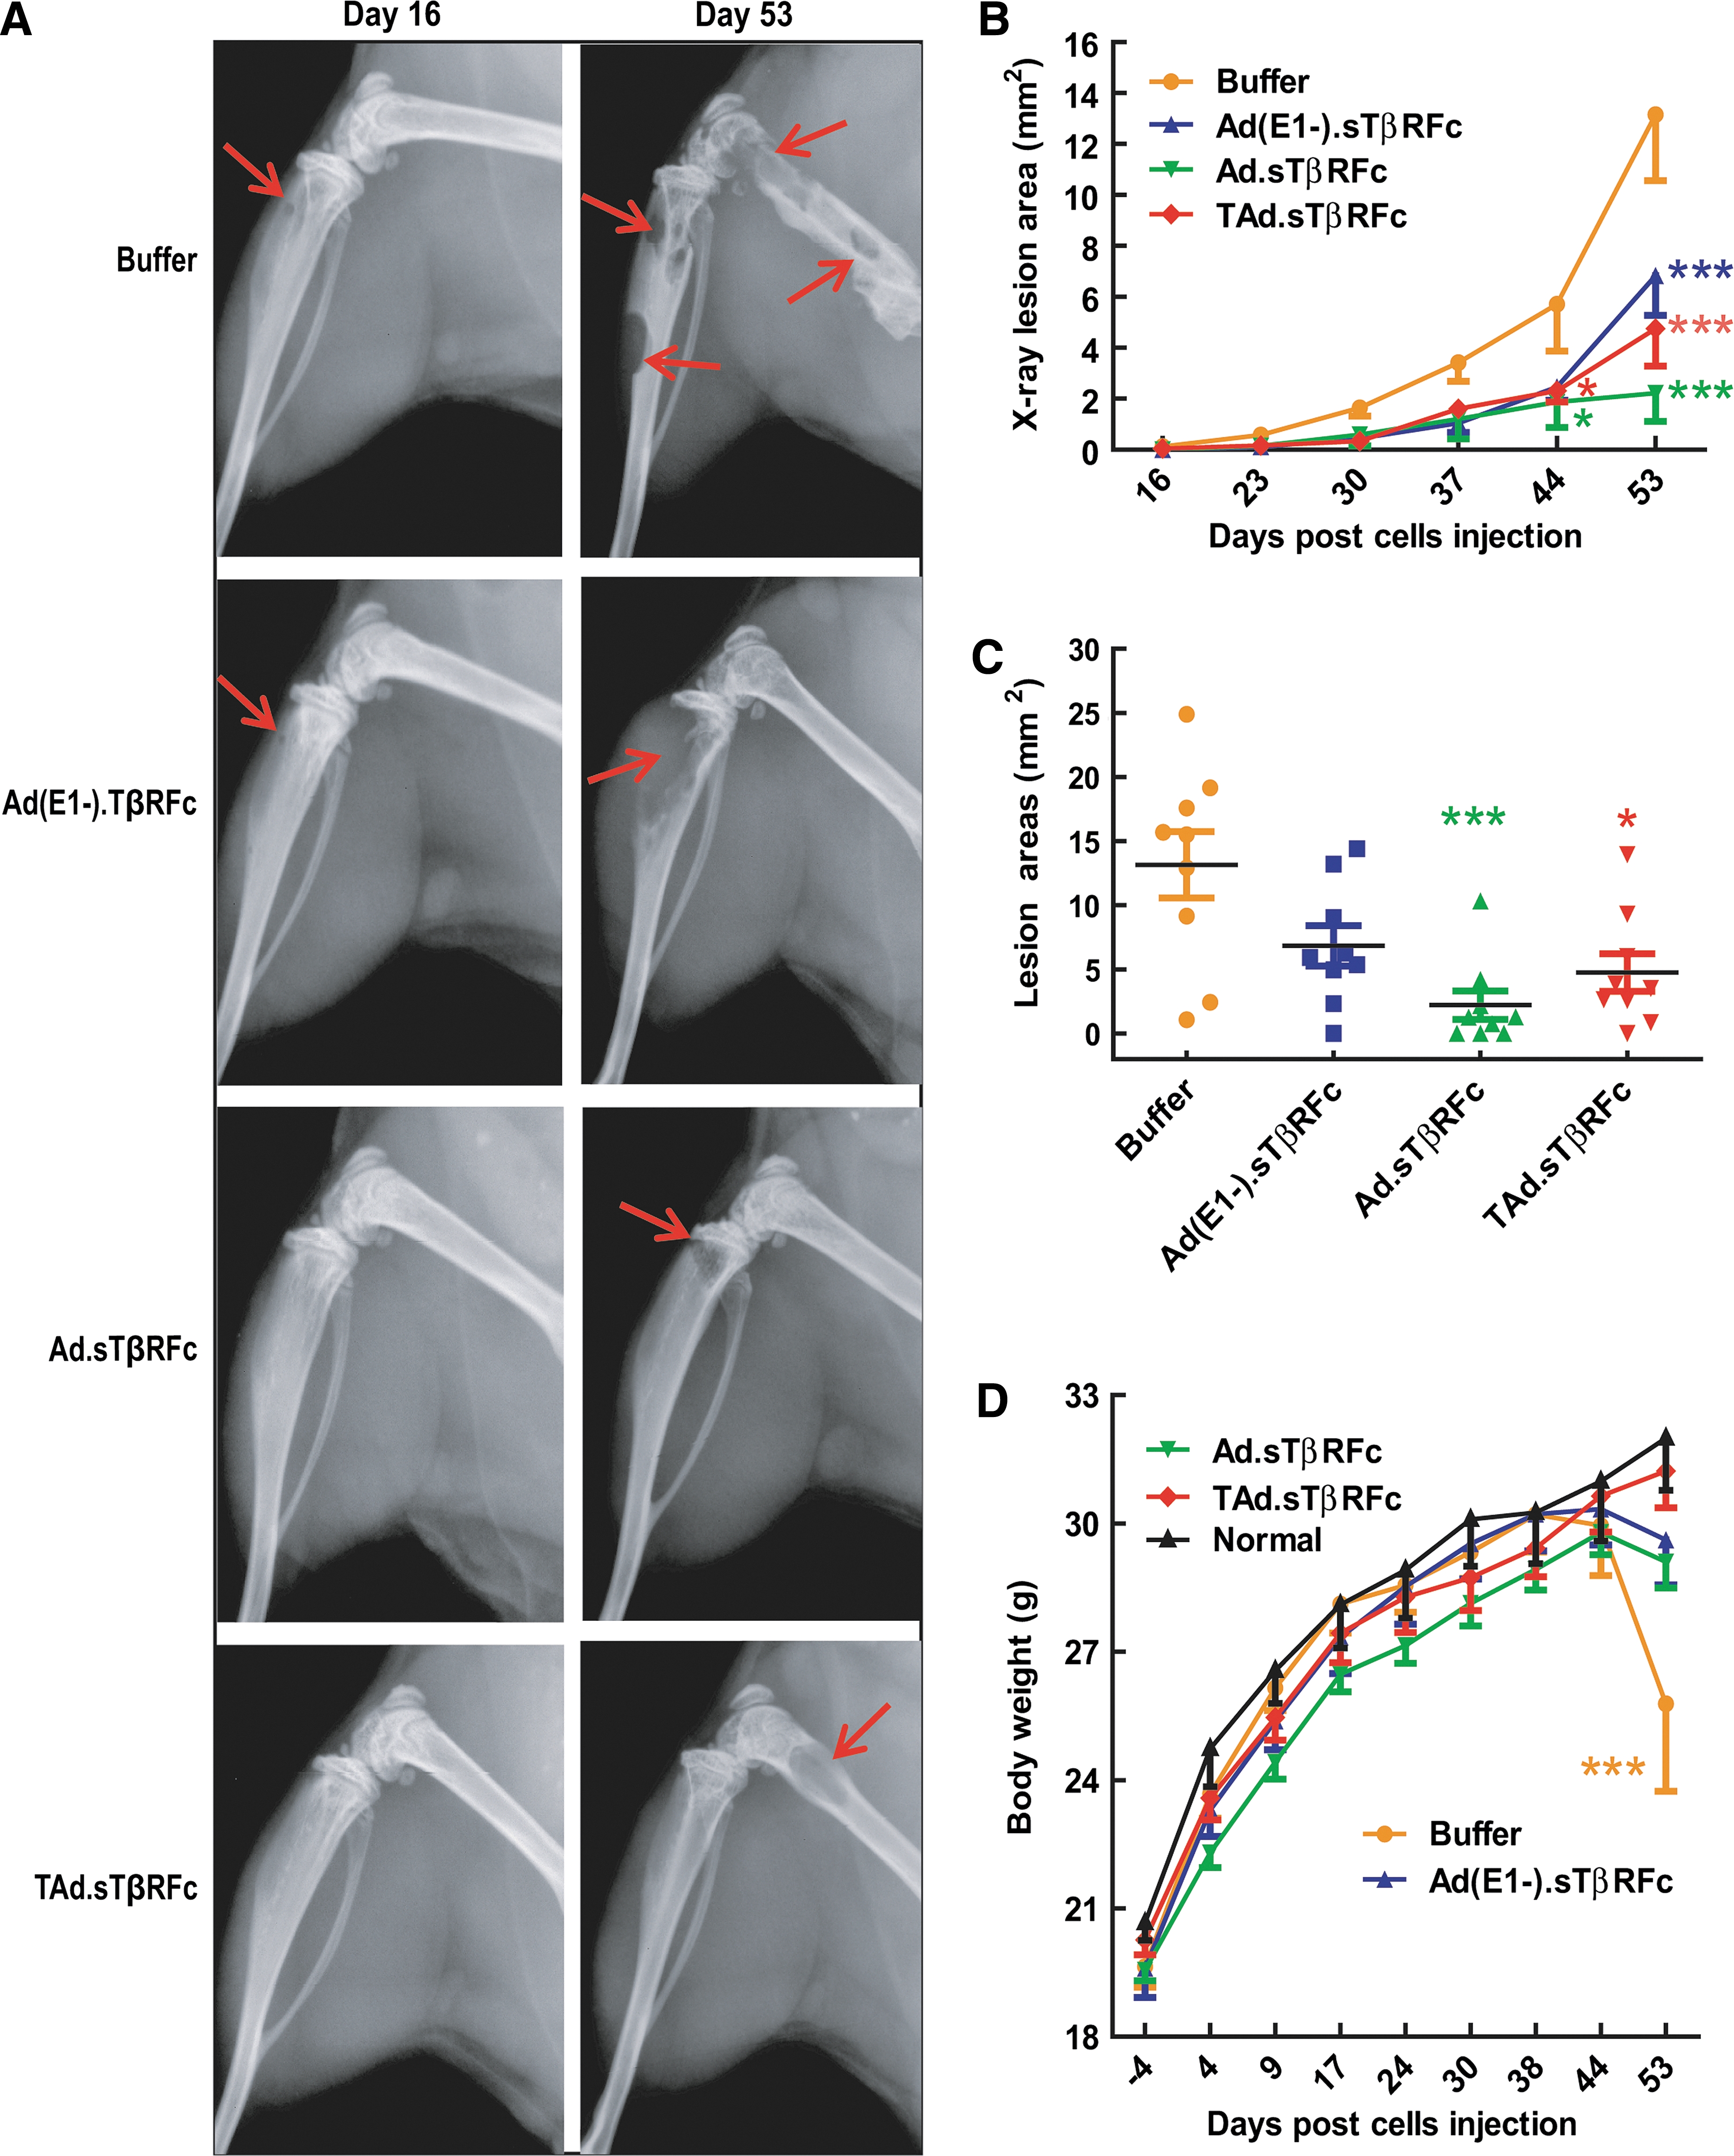
Effect of systemic delivery of viral vectors on PC-3-luc bone metastases: X-ray radiography. Mice from the experiment described in Fig. 3 were subjected to X-ray radiography on various days (n=9 mice per group).
In addition to BLI and X-ray analyses, animal body weights were monitored once per week. There was an increase in body weight in all the treatment groups until day 44. In the buffer-treated group the mice began to lose body weight from day 44 onward; by day 53 there was a significant reduction in body weight in the buffer-treated group compared with normal mice that were not inoculated with tumor cells (p<0.001) (Fig. 4D). Therefore, the experiment was terminated on day 53 and the following ex vivo analyses of hind-limb bones and blood were conducted to further examine the antitumor responses of the viral vectors.
Effect of intravenous injection of adenoviral vectors on tumor burden: Histomorphometric analysis
At the end of the experiment (day 53), hind-limb bones (from left legs) were isolated for histomorphometric analyses. Bones were sectioned, and the median sagittal sections were stained with H&E. Figure 5A shows a representative bone sample from each of the treatment groups. In the buffer-treated group, bone marrow was nearly replaced by tumor cells; eight of nine bones had tumor lesions (Fig. 5A and B). Among the adenoviral vectors, only Ad.sTβRFc treatment resulted in a significant increase in tumor-free bones (six of nine) (p<0.05). Tumor burden in the tibia and femur was measured as described in Materials and Methods. In the buffer-treated group, tumor size was 5.98±1.30 mm2 (Fig. 5C). Tumor sizes in the Ad(E1-).sTβRFc, Ad.sTβRFc, and TAd.sTβRFc groups were 2.05±0.89, 1.54±1.05, and 2.26±1.04, respectively, indicating a significant reduction in tumor burden in the Ad.sTβRFc-treated group (p<0.05), but not in the TAd.sTβRFc and Ad(E1-).sTβRFc groups (Fig. 5C). Thus, on the basis of histomorphometric analyses, Ad.sTβRFc treatment appears to be the most effective.
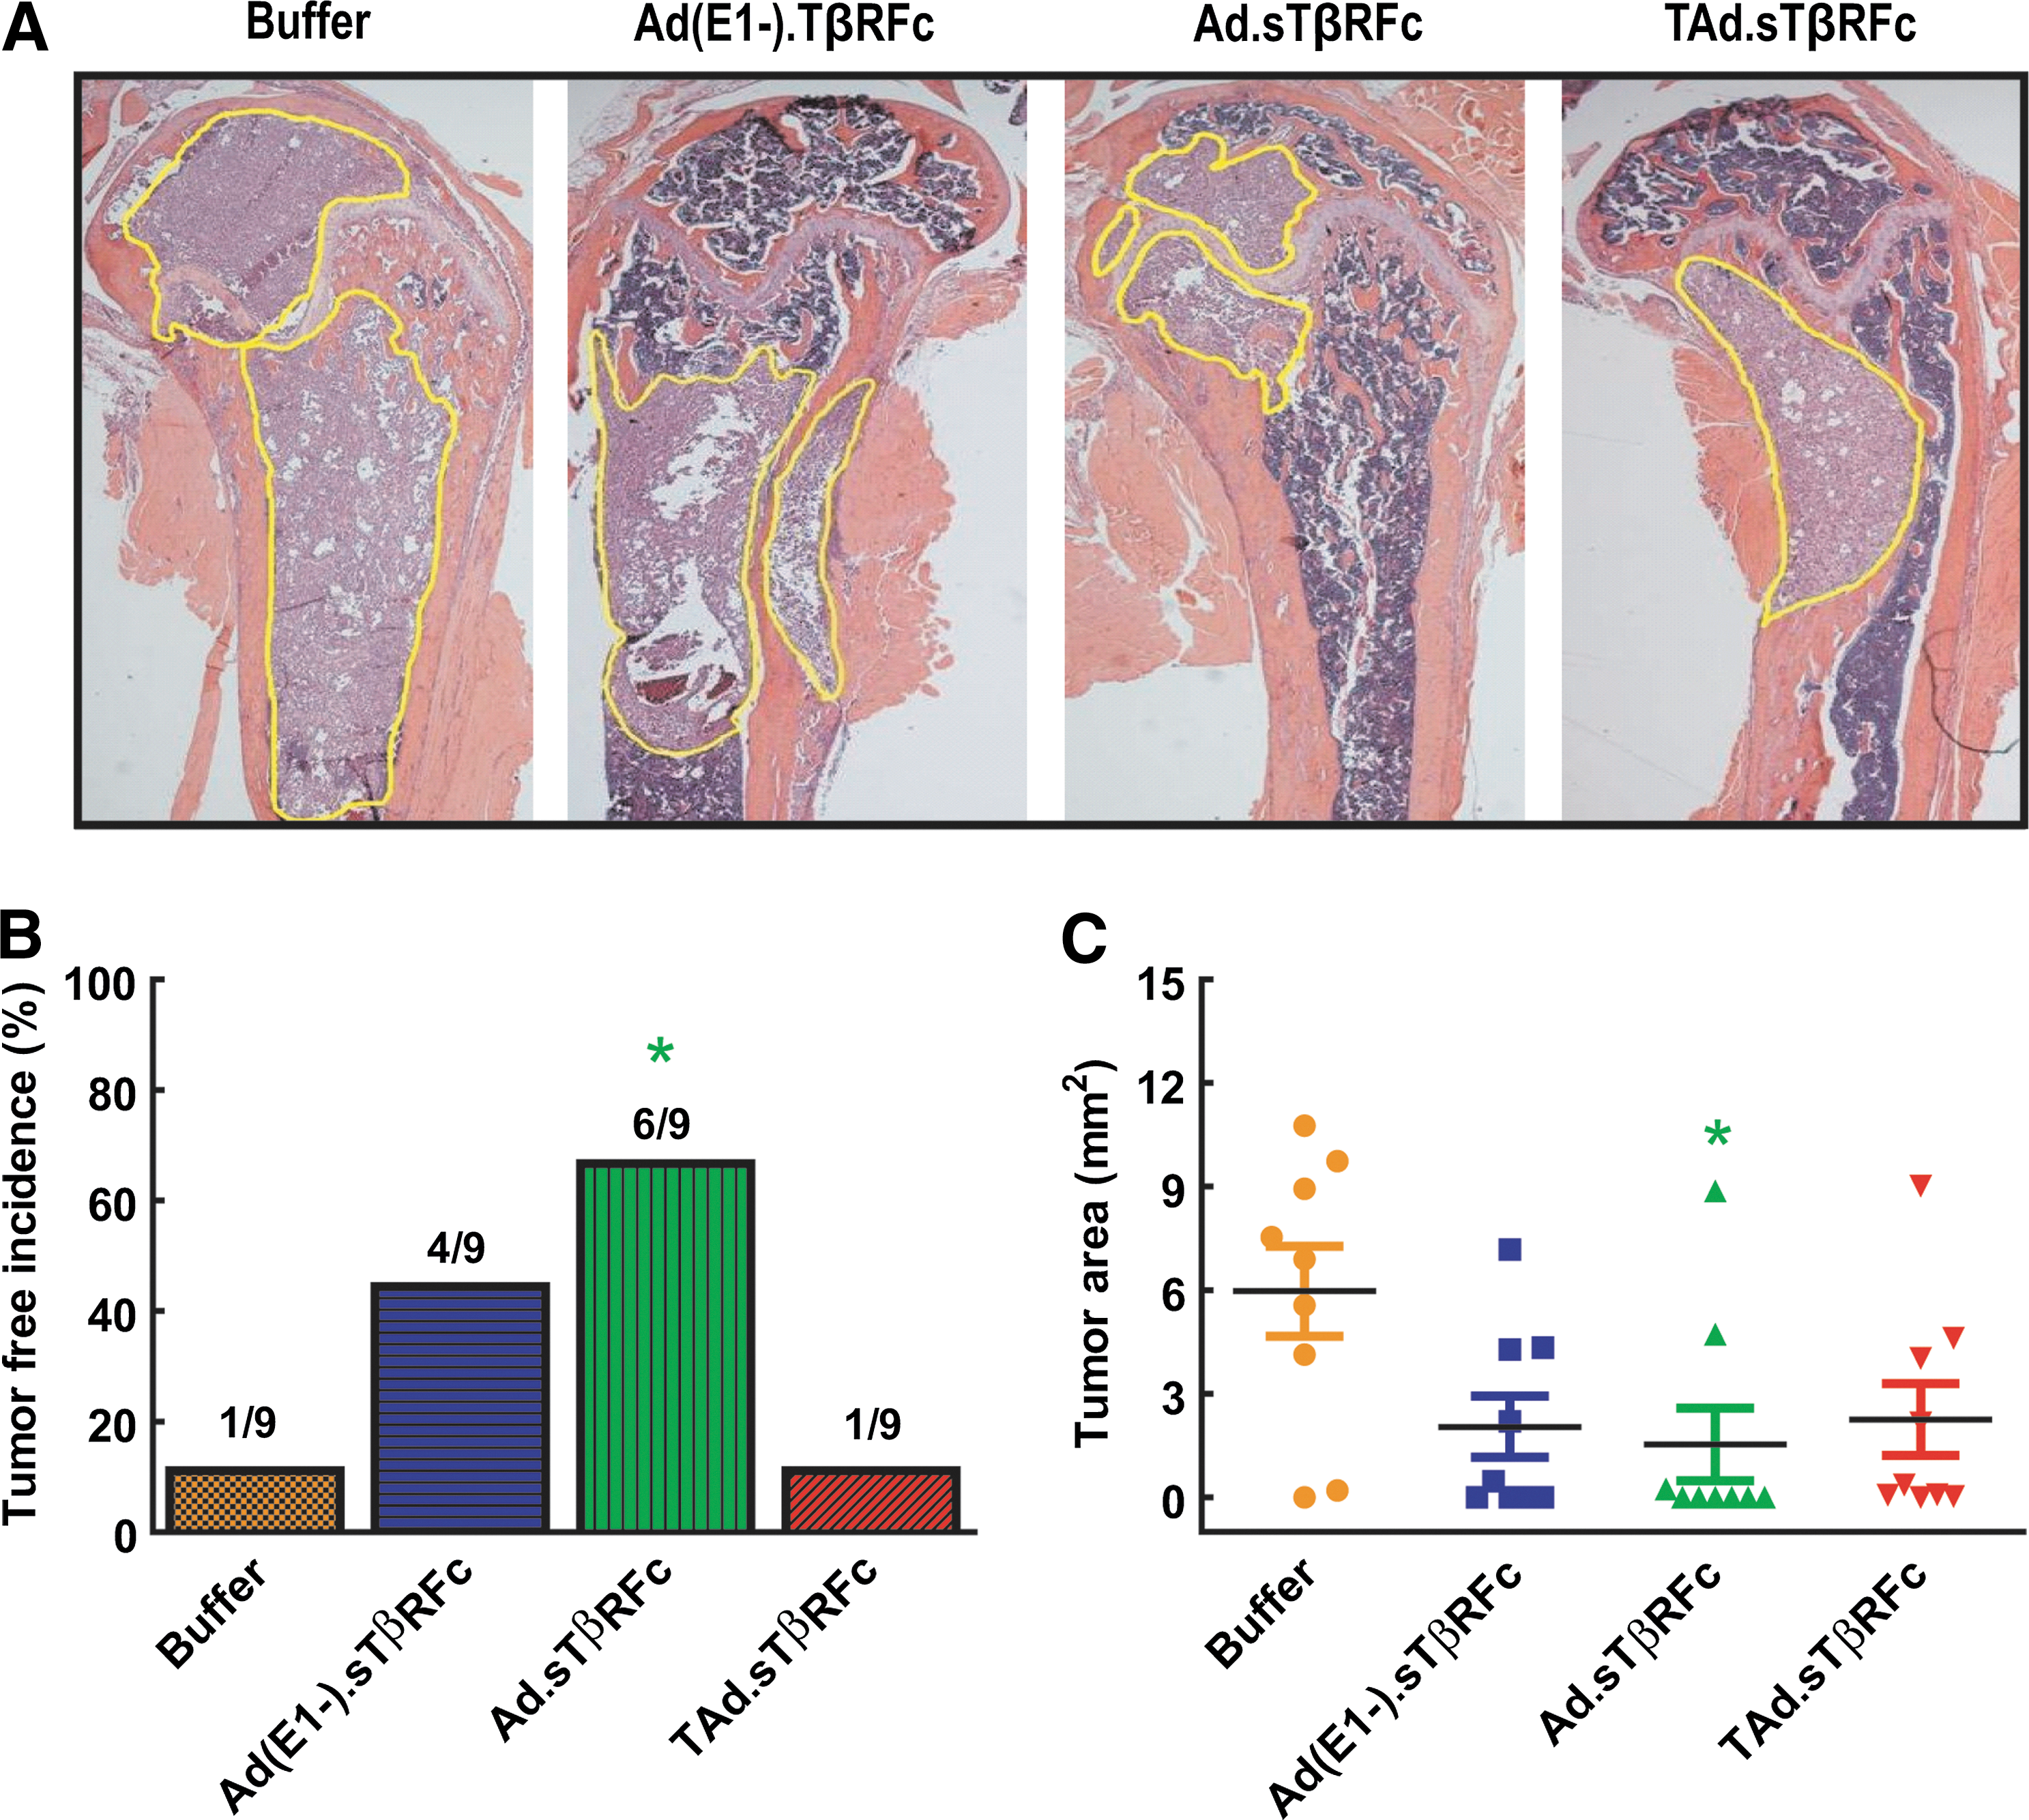
Analysis of tumor burden by histomorphometric analyses. On day 53, bones from hind limbs were isolated, and midsagittal bone sections were subjected to H&E staining. Samples (n=9) were visualized under the microscope and photographed (original magnification, ×20). Tumor outlines are marked with yellow lines.
Effect of intravenous injection of adenoviral vectors on hypercalcemia, osteoclast numbers, and synchrotron microCT of hind-limb bones
Serum samples obtained at the terminal time point (day 53) were analyzed for calcium levels as an indicator of tumor-induced hypercalcemia. The average serum calcium level of the buffer-treated group was 10.41±0.67 mg/dl, which is significantly higher than the average calcium level (7.38±0.31 mg/dl) of age-matched normal mice (p<0.001) (Fig. 6A), indicating that PC-3 tumors induced hypercalcemia. In the Ad(E1-).sTβRFc treatment group, calcium levels were 10.00±0.59 mg/dl, which is also significantly higher than the normal level (p<0.01). There was, however, a decrease in calcium level in Ad.sTβRFc and TAd.sTβRFc treatment groups, that is, to 8.40±0.20 and 8.64±0.31 mg/dl, respectively, showing no significant differences in calcium level compared with the normal level. However, only Ad.sTβRFc treatment resulted in a significant reduction in calcium level compared with the buffer group (p<0.05) (Fig. 6A). To confirm vector-induced sTGFβRIIFc production, blood levels were analyzed by ELISA. Blood samples derived from the buffer group had low levels (3.96±1.05 ng/ml) of sTGFβRIIFc protein (Fig. 6B). Mice treated with Ad(E1-).sTβRFc, Ad.sTβRFc, and TAd.sTβRFc viruses produced, respectively, 1.89±1.05, 84.17±14.53, and 152.70±54.20 mg of sTGFβRIIFc per milliliter in the blood (Fig. 6B). Taken together, these results indicate that a combination of viral replication and sTGFβRIIFc production is effective in inhibiting prostate tumor cell-induced hypercalcemia.

Serum calcium, sTGFβRIIFc levels, and osteoclast numbers at tumor–bone interface and synchrotron microCT analyses.
Because osteoclast cells are responsible for causing bone resorption associated with osteolytic bone destruction, bone samples from various treatment groups were analyzed for the presence of osteoclasts. Multinucleated tartrate-resistant acid phosphatase (TRAP)-positive osteoclasts were observed across the tumor–bone interface in the buffer-treated group (Fig. 6C). The osteoclast numbers per millimeter of tumor–bone interface were measured in each bone and are shown in Fig. 6D. The buffer treatment group had 5.14±1.16 osteoclasts per millimeter. The osteoclast numbers in the Ad(E1-).sTβRFc, Ad.sTβRFc, and TAd.sTβRFc treatment groups were reduced to 1.75±0.62, 1.37±0.72, and 4.35±1.04 per millimeter, respectively. Among the three viral vectors, only Ad.sTβRFc treatment resulted in a significant inhibition of osteoclast numbers compared with the buffer group (p<0.05). These results therefore indicate that Ad.sTβRFc was effective in reducing total osteoclast numbers across the tumor–bone interface.
Tumor-induced bone destruction in hind-limb bones was further examined by synchrotron microCT. This can provide spatial resolution and contrast sensitivity that is superior to that in radiography and X-ray tube-based microCT (Stock, 2008). Areas about 3.0 mm below the growth plate were scanned and used to reconstruct 3-D images, using Amira software. Figure 6E (top) shows the 3-D reconstructions of a representative bone from each treatment group. The tibia derived from the buffer-treated group has large osteolytic lesions in the metaphysis region. In the Ad(E1-).sTβRFc treatment group, the osteolytic lesions were still apparent. Bones derived from mice in the Ad.sTβRFc and TAd.sTβRFc treatment groups appeared relatively normal (Fig. 6E, top). To further examine the nature of bone destruction, skeletal sections near the growth plate (Fig. 6E, middle) and 1.45 mm below the growth plate (Fig. 6E, bottom) were examined. Bones in the buffer- and Ad(E1-).sTβRFc-treated groups demonstrated clear trabecular and cortical destruction (Fig. 6E, top and middle); bones from the Ad.sTβRFc and TAd.sTβRFc groups appeared to have the least trabecular and cortical bone destruction. The sample numbers, however, were too few for detailed statistical analyses of various bone parameters.
Discussion
The main finding in this paper is that intravenous delivery of Ad.sTβRFc, an oncolytic adenovirus expressing sTGFβRIIFc in an animal model of prostate cancer bone metastasis, is effective in treating the established bone metastases, inhibiting hypercalcemia, and resulting in tumor-free mice. Another oncolytic virus, TAd.sTβRFc, expressing sTGFβRIIFc, is also effective in inhibiting bone metastases, and no significant differences were observed between Ad.sTβRFc and TAd.sTβRFc in multiple assays including tumor growth inhibition by BLI analyses, fold induction of BLI increase, tumor growth progression or lesion area on day 53 by X-ray analyses, body weight analyses, tumor burden analyses, serum calcium levels, and TRAP-positive osteoclast numbers. However, TAd.sTβRFc did not produce significant tumor-free incidence. This is not surprising considering that the hTERT promoter, although tumor specific, is weaker than viral promoters such as the E1A promoter (Hu et al., 2010a). Ad(E1-).sTβRFc, a nonreplicating virus expressing sTGFβRIIFc, was effective in inhibiting bone metastases but weaker than Ad.sTβRFc; it did not result in significant tumor-free incidence and failed to inhibit hypercalcemia. These results suggest that the combination of viral replication and sTGFβRIIFc expression is critical for the desired antitumor responses in this prostate cancer bone metastasis model.
Our studies described here suggest that human prostate cancer cells are excellent targets for adenovirus-mediated cancer therapy. We have shown that prostate cancer cells support adenoviral replication and simultaneously produce high levels of transgene expression. It is noteworthy that an important study conducted in McCormick's laboratory showed that expression of the coxsackie–adenovirus receptor (CAR), the primary adenoviral receptor, correlated with the Gleason score of prostate tumors; CAR was highly expressed in tumor specimens derived from prostate cancer patients with metastases (Rauen et al., 2002). Therefore, it is not surprising that adenoviral vectors are effective vectors for targeting the metastatic prostate cancer cellular models described here. In fact, in clinical trials conducted in patients with prostate cancer, adenoviruses have been found to be generally safe and have shown some antitumor efficacy (Kubo et al., 2003; Shirakawa et al., 2007; de Vrij et al., 2010; Adamson et al., 2012).
On the basis of the studies described here, we postulate the following mechanism by which overexpression of sTGFβRIIFc, coupled with viral replication, could inhibit prostate cancer bone metastases, osteoclast activation, and bone resorption. Systemic delivery of Ad.sTβRFc vector would result in its uptake in skeletal tumors, where it will replicate and cause some oncolysis. sTGFβRIIFc, the result of adenovirus-mediated production in the tumors, will be released into the tumor microenvironment, where it will bind with TGF-β, inhibit TGF-β-dependent SMAD2 and SMAD3 phosphorylation, and inhibit other downstream signals in tumor cells and in other cells present in the microenvironment. This will inhibit prometastatic signaling pathways prevalent in the tumor cells, inhibit osteoclastogenesis, and induce osteoblast differentiation. Because bone resorption results in hypercalcemia, as well as the release of several tumor-promoting growth factors such as insulin-like growth factor-1, inhibition of bone resorption will thus inhibit hypercalcemia and reduce the release of various growth factors from bone, resulting in further inhibition of tumor growth. As observed here, this coupled with concurrent viral replication leading to tumor cell death will result in severe inhibition of bone metastases. Although some of these steps have been examined in the current study, understanding the details of the mechanisms outlined here would be an important area of future research.
Although a great percentage of prostate cancer skeletal metastases are osteoblastic in nature, there is also an underlying osteolytic component (Schneider et al., 2005; Sato et al., 2008; Jin et al., 2011; Lee et al., 2011; Sturge et al., 2011). In fact, the drugs bisphosphonates and denosumab, developed for treating human prostate cancer bone metastases, as described here for Ad.sTβRFc, also target the osteolytic component. Bisphosphonates target osteoclasts and can inhibit bone resorption; denosumab is a monoclonal antibody against RANKL and can therefore inhibit RANKL-dependent osteoclastogenesis (Coleman, 2011; Fizazi et al., 2011; Smith et al., 2011). Interestingly, TGF-β1 has been shown to directly induce RANKL expression in a mouse prostate cancer model that predominantly produces osteoblastic lesions (Zhang et al., 2004). It is therefore possible that inhibiting TGF-β activity could result in the inhibition of osteoclast function even in prostate cancers that produce mixed osteoblastic and osteolytic lesions. One potential advantage of using oncolytic adenovirus such as Ad.sTβRFc to treat established prostate cancer metastases is that in addition to inhibiting bone resorption, Ad.sTβRFc is also directly cytotoxic, which can potentially contribute toward significant tumor-free incidence, a desired clinical outcome of cancer therapy.
In summary, our work presented here suggests that oncolytic viruses expressing sTGFβRIIFc can be potentially developed for the treatment of skeletal metastases secondary to prostate cancer. Clearly, additional efficacy, safety, and toxicity studies in animal models would be needed before initiating any clinical trials in patients with prostate cancer. In particular, two in vivo barriers of systemic delivery of oncolytic adenoviruses that need to be addressed are as follows: liver tropism of the adenoviruses and the immune response to adenoviral vectors, both of which limit the use of this approach. To reduce liver sequestration of Ad5-based viruses, we have begun creating Ad5/48 chimeric hexon-containing, liver-detargeted oncolytic adenoviruses, in which seven hypervariable regions of Ad48 hexon are inserted in the Ad5 backbone (Zhang et al., 2011); such liver-detargeted chimeric oncolytic viruses can also be developed to target prostate cancers. Regarding the immune response issue, a large body of research has been done to develop ways to inhibit and/or evade the immune responses to adenoviruses, for example, the use of serotype switching, use of immune-suppressive agents, chemical modifications of adenoviral capsids, microencapsulation of the adenovirus, or the use of other viral and nonviral vectors (Lamfers et al., 2006; Liu and Kirn, 2008; Morille et al., 2008; Seow and Wood, 2009; Stanford et al., 2010; Ahi et al., 2011). Considering the urgent need to develop novel therapies of bone metastases of prostate cancer, we will direct our future effort to obtain such data.
Footnotes
Acknowledgments
This research was funded in part by NIH grant R01CA12738 (P.S.) and by an institutional grant from the NorthShore Foundation (P.S.). Use of the Advanced Photon Source was supported by the U.S. Department of Energy, Office of Science, Office of Basic Energy Sciences, under contract DE-AC02-06CH11357. The authors are thankful to the Kovler Family Foundation, Mr. and Mrs. Richard Hulina, Mr. Jimmie Alford and Ms. Maree Bullock, Maxine and James Farrell, the Carol Gollob Foundation, and an anonymous donor for their generous gifts. The authors are thankful to Janardan Khandekar, Theodore Mazzone, and Bruce Brockstein for continuous support. The authors thank Tamas Jilling for help in p-SMAD quantification, and Rebecca Orr for tissue processing.
Author Disclosure Statement
No competing financial interests exist for any of the authors.