
Abstract
Green fluorescent protein (GFP) is a broadly used live cell reporter for gene transduction although side effects associated with GFP in gene transfer are reported. The present study was designed to systematically examine host responses, including inflammatory and immune responses, induced by persistent overexpression of the GFP gene mediated by adeno-associated viral vector serotype 9 (AAV9), and their effects on GFP gene transduction in rat striatum. Our results show that host responses against AAV9-GFP transduction, and GFP transgene expression in the striatum exhibited a temporal and dose-dependent pattern. Both muscular and striatal delivery of AAV9-GFP increased levels of inflammation and immune reactions against sequential AAV9-GFP transduction in the striatum, leading to reduced levels of GFP expression. We also observed that rat sera from sequential administrations of AAV9-GFP group had significantly higher levels of neutralizing antibody against AAV9 vectors when compared with the age-matched rats. As excessive GFP can trigger vigorous inflammation and intense immune response after GFP gene transduction, the use of GFP as a live cell marker protein should be deliberated, especially in repeated administration studies.
Introduction
G
Adeno-associated virus (AAV) vectors are a powerful tool for gene transfer because of their properties of nonpathogenicity, long-term expression of a packaged gene, ability of infecting nondividing and dividing cells, and relatively low levels of toxicity in transduced regions. 7,8 Among the different serotypes of AAV, AAV serotype 9 (AAV9) is more promising because it has an ability to cross the blood–brain barrier and efficiently infect glia and neurons. 9 –13 AAV has generally been considered possessing a minimum immunogenicity for many years. 7,8 However, numerous studies have shown that gene transfer mediated by AAV can elicit both antibody-associated and cellular immune responses to vectors themselves and encoded proteins. 14 –24 Interestingly, it has been reported that induction of types of immune responses against AAV and encoded proteins depends on the routes of administration. 14,16,25
Although AAV9-associated GFP gene transduction has been shown to elicit inflammatory and immune responses within rat brain, 15,19,26 detailed studies on the characterization of the host responses and the effects of these host responses on GFP transduction in the brain are still lacking. It is imperative to elucidate the host responses induced by GFP gene transduction and toxicity of GFP to transduced cells, as the GFP gene is often used as a marker gene in gene delivery. The present study was designed to systematically examine inflammatory and immune responses induced by persistent overexpression of the GFP gene using AAV9 vectors, and their effects on GFP expression in rat striatum. We first examined time-course and dose-dependent host responses after striatal administration of AAV9-GFP. We then challenged the immune system of rats with striatal or muscular injections of AAV9-GFP, and examined host responses against AAV9-GFP in the striatum after sequential administration. We further investigated effects of inflammation and immune responses on the sequential GFP gene administration in the striatum. Inflammation and immune reactions in rat striatum were studied by assessing the activation of microglia and astrocytes, levels of the major histocompatibility complex (MHC) class I and II antigen expression, and accumulation of cluster of differentiation (CD) 4 and CD8 T lymphocytes. GFP transduction was examined by evaluating the volume of GFP expression in rat striatum.
Materials and Methods
Animals and groups
Adult female Sprague-Dawley rats (n = 76; 225–250 g) were housed under a standard cycle (12-hour light/12-hour dark). Both water and rat chows were freely available for animals. All surgical procedures were approved by the Animal Use and Care Committee of the Capital Medical University, Beijing, China. This study was carried out with the minimum number of animals and all necessary measures were considered to minimize animal suffering.
Groups are listed in Table 1. The rats were assigned into three experiments. Experiment 1 (time-course study, n = 26): rats were injected with either AAV9-GFP (3.4 × 10¹⁰ vg) or AAV9-Empty (7.0 × 10¹⁰ vg) into the right striatum, and sacrificed at 4-day, 3-week, and 6-month time points. Experiment 2 (dose-dependent study, n = 23): rats were injected with AAV9-GFP with serial doses (6.2 × 10⁶, 6.2 × 10⁷, 6.2 × 10⁸, 6.2 × 10⁹, or 6.2 × 10¹⁰ vg) into the right striatum, and sacrificed at 3 weeks. Experiment 3 (re-administration study, n = 27): there were five subgroups in Experiment 3. The second injections were always made into the right striatum. The time interval was 3 weeks between the first and second injections. Group 1 (n = 5, M GFP-Str GFP): rats were first injected with AAV9-GFP (6.2 × 10¹⁰ vg) into the right quadriceps femoris muscle. The second injection was performed with AAV9-GFP (6.2 × 10¹⁰ vg); Group 2 (n = 5, Str GFP-Str GFP): rats were first injected with AAV9-GFP (6.2 × 10¹⁰ vg) into the left striatum. The second injection was performed with AAV9-GFP (6.2 × 10¹⁰ vg); Group 3 (n = 4, M Empty-Str GFP): rats were first injected with AAV9-Empty (6.2 × 10¹⁰ vg) into the right quadriceps femoris muscle. The second injection was performed with AAV9-GFP (6.2 × 10¹⁰ vg); Group 4 (n = 4, Str Empty-Str GFP): rats were first injected with AAV9-Empty (6.2 × 10¹⁰ vg) in the left striatum. The second injection was performed with AAV9-GFP (6.2 × 10¹⁰ vg); Group 5 (n = 5, Str GFP): rats were injected with AAV9-GFP (6.2 × 10¹⁰ vg) into the right striatum. All animals in Experiment 3 were sacrificed 3 weeks after the last viral injections, and peripheral blood samples were collected and prepared for neutralizing antibody assay before sacrifice. All brain tissues were prepared for immunocytochemistry. In addition, a group of age-matched rats without any treatments (n = 4) in Experiment 3 was used to collect peripheral blood samples for neutralizing antibody assay.
Summary of AAV9-GFP and AAV9-Empty vector administration
AAV9, adeno-associated virus serotype 9; GFP, green fluorescent protein; L, left; M, muscle; QF, quadriceps femoris; R, right; Str, striatum; vg, vector genome; vg/ml, vector genome per milliliter.
Virus production
AAV9-GFP viruses were prepared as previously described. 27 The expression cassette consists of the GFP gene and AAV2 terminal repeats on both sides, and was packaged into AAV9 capsid. The GFP gene expression is controlled by hybrid cytomegalovirus immediate early enhancer/chicken β-actin promoter. HEK293T cells were co-transduced with the GFP plasmid and two packaging plasmids. Vector titer was determined by dot blotting. The titer for AAV9-GFP was either 1.7 × 10¹³ vg/ml or 3.1 × 10¹³ vg/ml, and the titer of AAV9-Empty was 3.5 × 10¹³ vg/ml. Virus purity was examined by sodium dodecyl sulfate–polyacrylamide gel electrophoresis. A total of 10 μg virus stock was separated by a 12% gel and dyed with Coomassie Brilliant Blue dye.
Viral injections into the striatum and quadriceps femoris muscle
The rats were injected under equithesin anesthesia (3 ml/kg, i.p.) with a stereotaxic apparatus. Two microliters of AAV9-GFP or AAV9-Empty vectors was injected into the striatum with a 10 μl Hamilton microsyringe. The stereotaxic coordinates for microinjection were as follows: AP, +1.0; ML, −3.0; DV, −4.5; tooth bar, 0. The stereotaxic injections were done at 0.2 μl/min with a pump, and the Hamilton microsyringes were left for another 5 min before retraction. For muscular injections, the equithesin-anesthetized rats received 200 μl of AAV9-GFP at a titer of 3.1 × 10¹¹ vg/ml (6.2 × 10¹⁰ vg per injection site) into the right quadriceps femoris muscle with 1 ml sterile syringes.
Immunocytochemistry
Rat brain sections were prepared and immunostained using avidin–biotin complex immunoperoxidase technique as previously described. 28 Mouse antiglial fibrillary acidic protein (GFAP; Sigma, St. Louis, MO), mouse anticomplement receptor 3 (CR3; Serotec, Oxford, UK), mouse anti-MHC class I (Serotec), mouse anti-class II (Serotec), mouse anti-CD4 (Serotec), and mouse anti-CD8 (Serotec) were used as primary antibodies. The biotinylated goat antimouse IgG was used as a secondary antibody (Vector Laboratories, Burlingame, CA). The Vectastain ABC Elite and DAB kits (Vector Laboratories) were used to visualize immunoreactivity.
Volumetric analyses
The volume (mm3) of AAV9-GFP transduction was determined as previously described. 15 Briefly, complete serial striatal sections were visualized and collected with a 1× objective lens under a Nikon eclipse TE2000-s fluorescence microscope. For each section, the area with GFP-positive cells was delineated and assessed on the screen using NIH image software (ImageJ 1.49; NIH, Bethesda, MD) in a blind manner. The value of pixels was calculated into the area (mm2). The total volume (mm3) of AAV9-GFP transduction was determined by the average area with GFP-positive cells in each striatal section, section thickness, and frequency.
Semiquantitative analyses
The immunostaining for CR3, GFAP, MHC class I, MHC class II, CD4, and CD8 in the right striatal sections containing needle tracks was semiquantitatively evaluated in a blind manner as previously described. 28 Immunostained brain sections were examined by two examiners based on the following scores: 0, no immunostaining; 1, several single immunostained cells; 2, several clusters of immunostained cells; 3, numerous immunostained cells or dense immunostaining; 4, a very large amount of immunostained cells, very dense immunostaining, or necrosis. In general, the two raters gave very similar rating scores. If the raters had different scores for an immunostained brain section, the average of two raters' scores was taken. After two to three immunostained brain sections from each rat were rated, the highest score among 2–3 scores was chosen to represent the final score for the immunostaining in the rat. CR3 and GFAP immunostaining in the uninjected striatum were used as an internal control of immunostaining. The antibodies (anti-CR3 for microglial cells and anti-GFAP for astrocytes) were immunoreactive in both resting and activated cells, but resting cells were less intensely immunostained and smaller (a ramified state of microglial cells) than activated microglial cells (a more amoeboid morphology). Only activated microglial cells/macrophages and astrocytes were taken into account for the semiquantitative analyses.
Neutralizing antibody assay
The titer of neutralizing antibodies against AAV9 vectors in rat serum was performed as previously described. 29 Briefly, HEK293T cells (3.0 × 10⁴ cells/well) were cultured with DMEM-supplemented 5% FBS in 24-well plates. The cells at 70% confluence were used in the following experiment. An amount of 10 μl of serial dilutions of serum was first incubated with 10 μl of AAV9-GFP (3.1 × 10¹² vg/ml) for 1 hr at 37°C. Then the mixed solution was added to HEK293T cells for transduction. After transduction for 48 hr, HEK293T cells were visualized for GFP expression. The neutralizing antibody titer was presented as the serum dilution at which the transduction of HEK293T cells was inhibited 50%.
Statistical analysis
The data for GFP-positive cell volume and the titer of neutralizing antibody against AAV9 were analyzed by the unpaired Student t-test and the one-factor analysis of variance (ANOVA) followed by the Fisher's post hoc test among groups. The data for arbitrary rating scores among groups were analyzed by the Kruskal–Wallis test followed by the Mann–Whitney U-test. Statistical significance was defined at p < 0.05.
Results
Coomassie Brilliant Blue staining of polyacrylamide gels showed clear AAV capsid proteins (VP1, VP2, VP3), suggesting the purity of AAV vectors (Supplementary Fig. S1; Supplementary Data are available online at
The temporal profile of inflammation and immune response after single AAV9 vector delivery into the striatum
AAV9-GFP vector delivery into the striatum
For rats receiving a single injection of AAV9-GFP (3.4 × 10¹⁰ virus genome, vg per injection site), numerous activated microglia and astrocytes were primarily observed in the injected striatum at 4 days (Fig. 1A1, B1, G; mean for CR3: 2.80 ± 0.20, and for GFAP: 3.00 ± 0), 3 weeks (Fig. 1A2, B2, G; also see Supplementary Fig. S2A, B; CR3: 2.75 ± 0.25, GFAP: 3.00 ± 0), and 6 months (Fig. 1A3, B3, G, and Supplementary Fig. S3A, B; CR3: 3.40 ± 0.40, GFAP: 3.20 ± 0.20). At 6 months, microglial reaction in the striatum became more intense (Fig. 1A3, G, and Supplementary Fig. S3A).
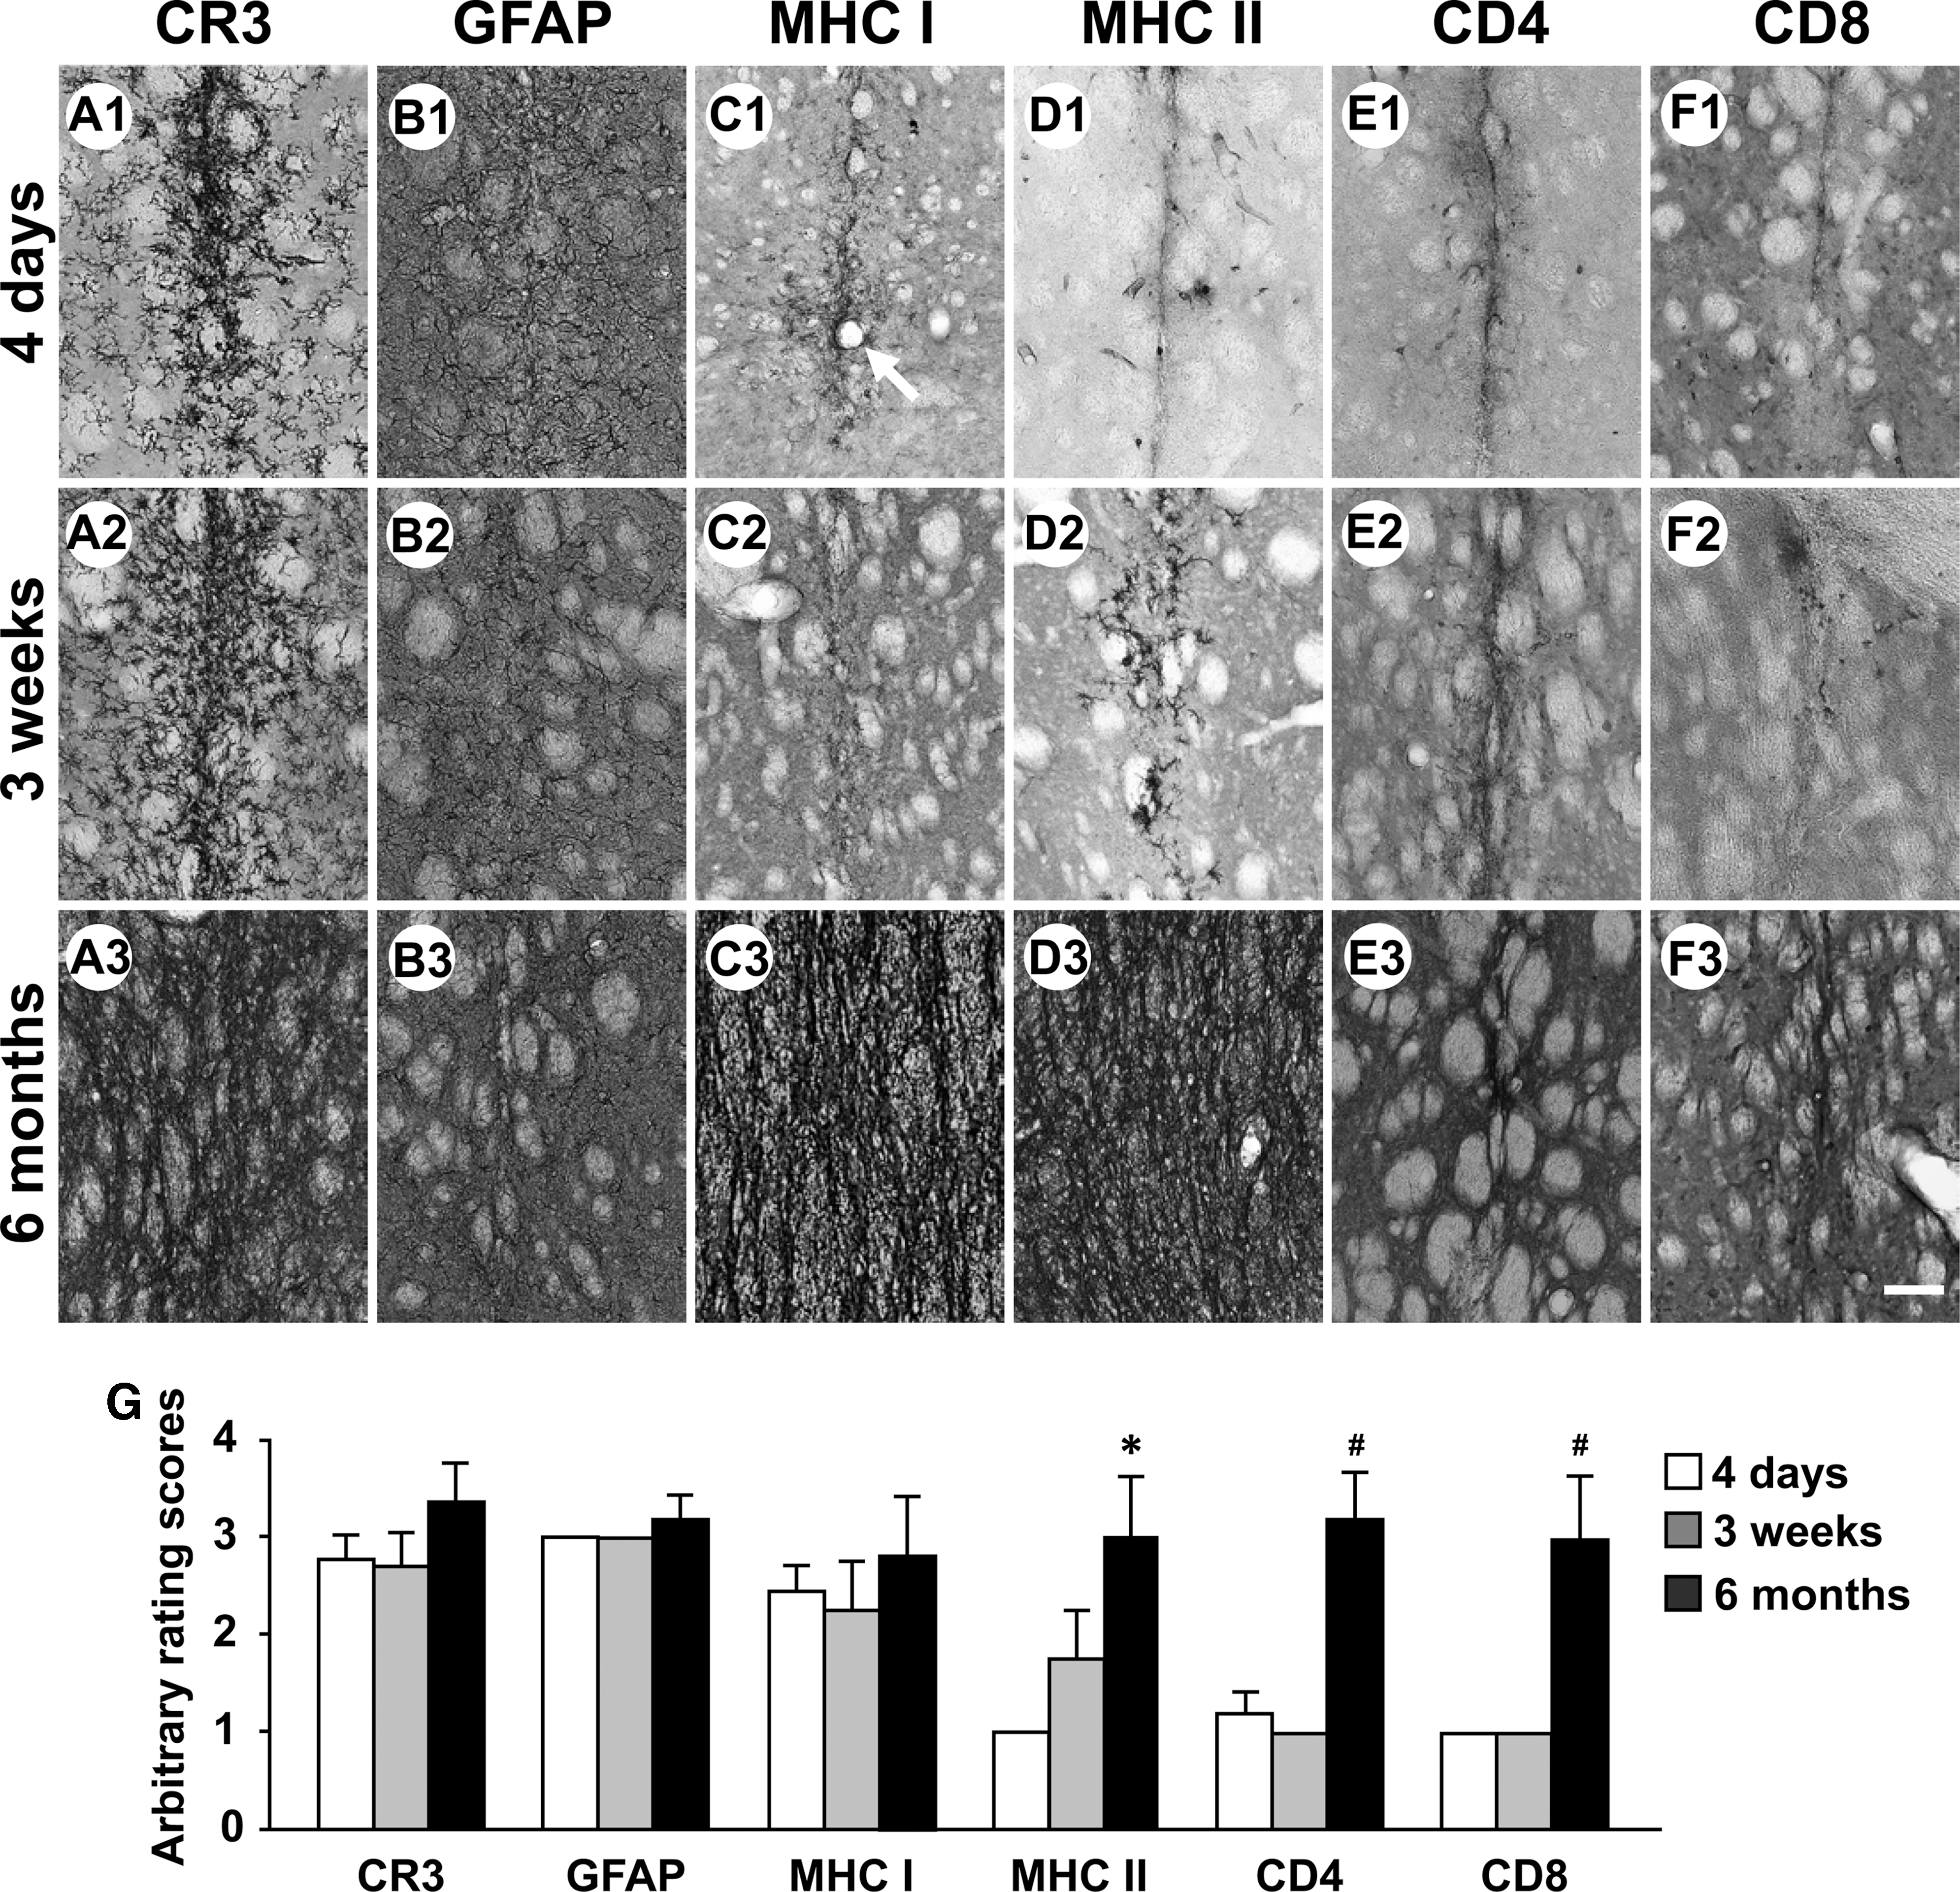
Time course of inflammatory and immune responses in the right striatum of rats receiving intrastriatal injections of AAV9-GFP viruses. Immunostained striatal sections from representative rats 4 days after viral injections (n = 5)
There were various levels of MHC class I antigen expression in the striatum at 4 days (Fig. 1C1; 2.40 ± 0.25), 3 weeks (Fig. 1C2 and Supplementary Fig. S2C; 2.25 ± 0.48), and 6 months (Fig. 1C3 and Supplementary Fig. S3C; 2.80 ± 0.58) (Fig. 1G). Perivascular cuffs with MHC class I-IR cells were occasionally present around blood vessels (Fig. 1C1). There was different temporal pattern for MHC class II-IR cells (Fig. 1G). At 4 days, several single MHC class II-IR cells were distributed in needle track areas (Fig. 1D1, G; 1.00 ± 0). The levels of MHC class II antigen expression appeared to increase at 3 weeks (Fig. 1D2, G, and Supplementary Fig. S2D; 1.75 ± 0.48). However, it did not reach statistical significance. The numbers of MHC class II-IR cells were greatly increased at 6 months (Fig. 1D3, G, and Supplementary Fig. S3D; 3.00 ± 0.63; *p < 0.05).
CD4-IR and CD8-IR T-cells were barely found in the needle track areas at 4 days (Fig. 1E1, F1; 1.20 ± 0.20) and 3 weeks (Fig. 1E2, F2, G, and Supplementary Fig. S3E, F; 1.00 ± 0). In contrast, the levels of both CD4- and CD8-immunostaining were significantly increased at 6 months (Fig. 1E3, F3, G, and Supplementary Fig. S3E, F; CD4: 3.20 ± 0.49, CD8: 3.00 ± 0.63; # p < 0.05 vs. 4 days and 3 weeks, respectively).
AAV9-empty vector delivery into the right striatum
There was a temporal reduction for the numbers of activated microglial cells/macrophages, and activated astrocytes in the striatum (Fig. 2A1–3, B1–3, G). At 6 months, the numbers of activated microglial cells/macrophages, and activated astrocytes were significantly reduced (CR3: 1.00 ± 0, GFAP: 1.00 ± 0) when compared with 4-day (CR3: 2.75 ± 0.25, GFAP: 3.00 ± 0) and 3-week (CR3: 2.50 ± 0.29, GFAP: 2.50 ± 0.29) time points (Fig. 2G) (*p < 0.05 vs. 4-day and 3-week time points). There were reduced levels of MHC class I antigen expression 6 months after viral injections (1.00 ± 0, # p < 0.05 vs. 4-day time point, 3.00 ± 0) (Fig. 2C1–3, G). The number of MHC class II-IR cells was generally low in the injected striatum (Fig. 2D1–3, G; 1.00 ± 0). In general, CD4- and CD8-IR T-cells were barely found in the striatum 4 days (CD4: 1.00 ± 0, CD8: 1.00 ± 0), 3 weeks (CD4: 0.50 ± 0.29, CD8: 0.50 ± 0.29), and 6 months (CD4: 0.50 ± 029, CD8: 0.75 ± 0.25) after viral injections (Fig. 2E1–3, F1–3, G).
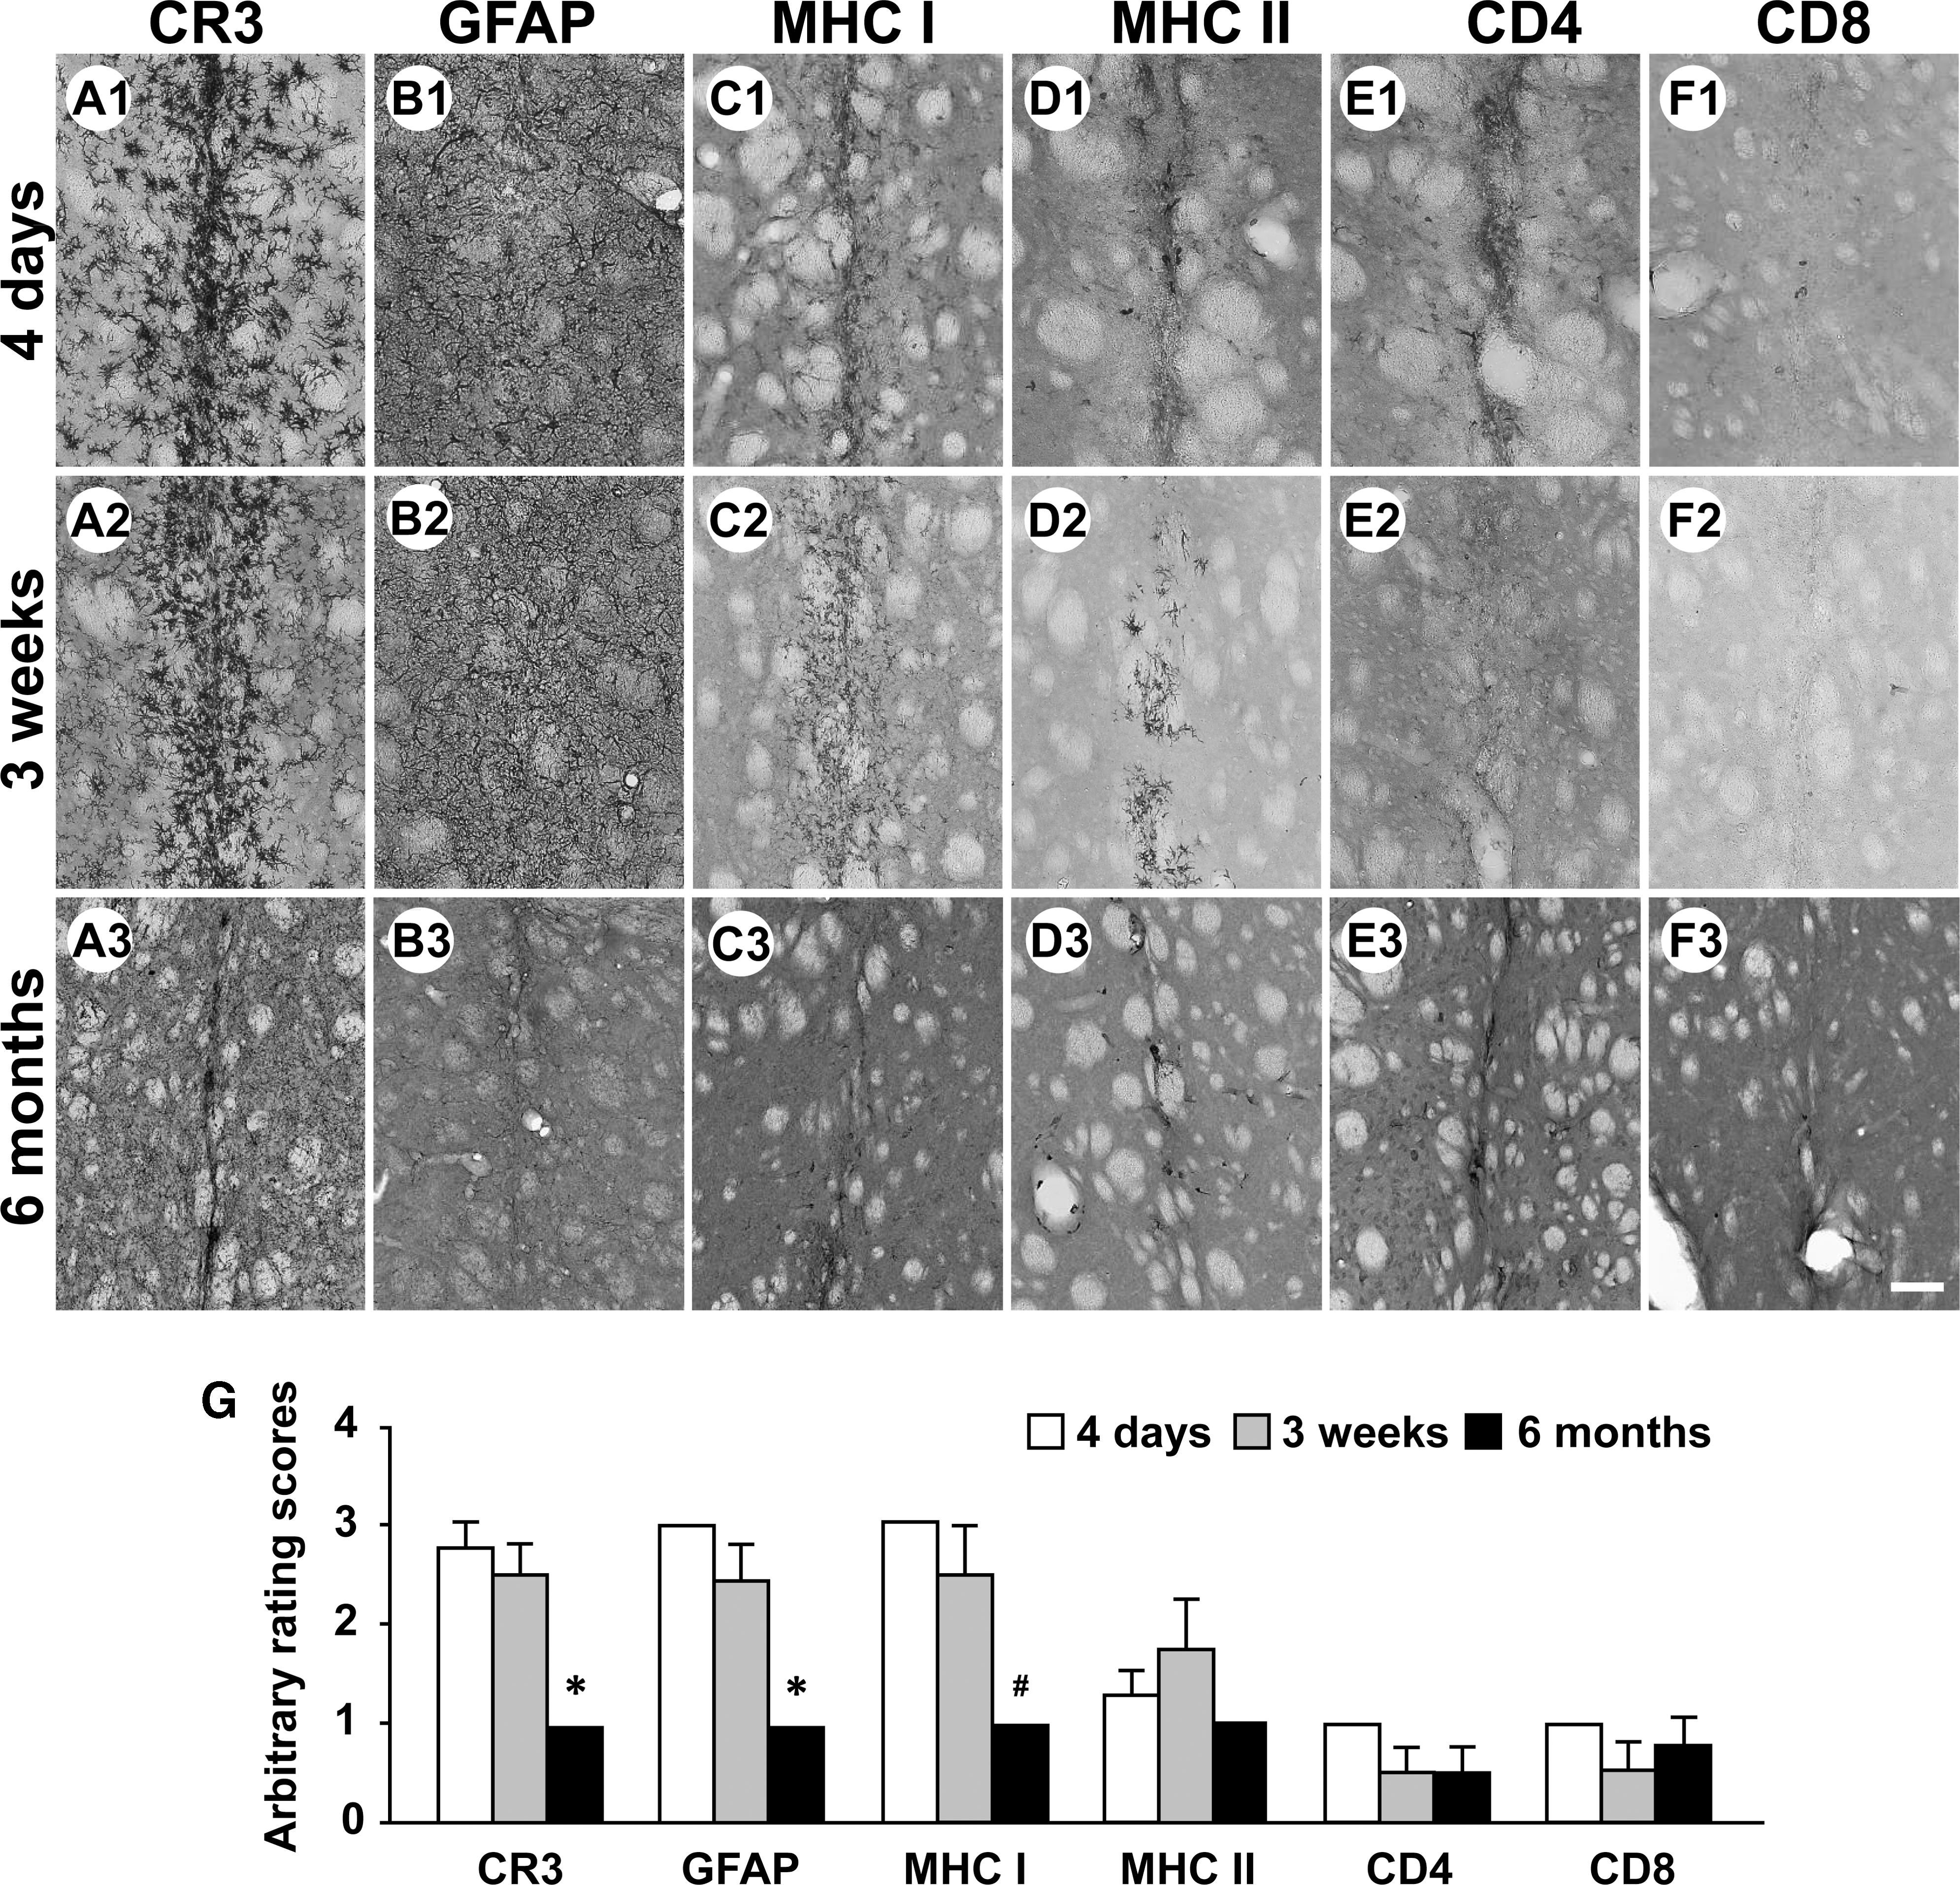
Time course of inflammatory and immune responses in the right striatum of rats receiving intrastriatal injections of AAV9-Empty viruses. Immunostained striatal sections prepared from representative rats 4 days after viral injection (n = 4)
Dose-dependent inflammation and immune reactions in the right striatum after single AAV9-GFP gene delivery
Intrastriatal injections of AAV9-GFP vectors at doses ranging from 6.2 × 10⁷, 6.2 × 10⁸, 6.2 × 10⁹, to 6.2 × 10¹⁰ vg per injection site led to a large number of activated microglial cells/macrophages (Fig. 3A2–5, G; 6.2 × 10⁷: 3.00 ± 0, 6.2 × 10⁸: 2.80 ± 0.20, 6.2 × 10⁹: 3.00 ± 0, 6.2 × 10¹⁰: 3.20 ± 0.20), and activated astrocytes (Fig. 3B2–5, G; 6.2 × 10⁷: 2.50 ± 0.29, 6.2 × 10⁸: 3.20 ± 0.20, 6.2 × 10⁹: 3.00 ± 0, 6.2 × 10¹⁰: 3.20 ± 0.20), accumulating in the injected striatum 3 weeks after viral injections. In contrast, AAV9-GFP vectors at a dose of 6.2 × 10⁶ vg per injection site resulted in a lower level of accumulation of activated microglial cells/macrophages, and activated astrocyte (Fig. 3A1, B1, G; CR3: 1.75 ± 0.25, GFAP: 2.00 ± 0; # p < 0.05 vs. 6.2 × 10⁷, 6.2 × 10⁸, 6.2 × 10⁹, and 6.2 × 10¹⁰ vg groups, respectively, ¶ p < 0.05 vs. 6.2 × 10⁸, 6.2 × 10⁹, and 6.2 × 10¹⁰ vg groups, respectively). The levels of MHC class I and class II immunostains appeared to be dose dependent. Significant levels of MHC class I and class II antigen expression were observed in the injected striatum of rats that received higher doses of AAV9-GFP (ranging from 6.2 × 10⁸ to 6.2 × 10¹⁰ vg) (Fig. 3C2–5, D2–5; MHC class I, 6.2 × 10⁸: 2.80 ± 0.2, 6.2 × 10⁹: 3.00 ± 0, 6.2 × 10¹⁰: 3.20 ± 0.2; MHC class II, 6.2 × 10⁸: 2.60 ± 0.4, 6.2 × 10⁹: 2.80 ± 0.2, 6.2 × 10¹⁰: 3.20 ± 0.2). The levels of MHC class I immunostains at the doses of 6.2 × 10⁶ vg and 6.2 × 10⁷ vg were significantly lower than the higher doses of 6.2 × 10⁸ to 6.2 × 10¹⁰ vg (¶ p < 0.05 vs. 6.2 × 10⁸, 6.2 × 10⁹, and 6.2 × 10¹⁰ vg groups, respectively; *p < 0.05 vs. 6.2 × 10⁹ and 6.2 × 10¹⁰ vg groups, respectively) (Fig. 3C1, D1, G). Although the levels of MHC class II immunostains at a dose of 6.2 × 10⁶ vg and 6.2 × 10⁷ vg appeared to be lower than that in other higher doses, the results of rating scores failed to show significant differences among the groups. The levels of both CD4 and CD8 immunostains were generally low in the striatum for various doses of viruses at 3 weeks (Fig. 3E1–5, F1–5; CD4: 6.2 × 10⁶: 1.25 ± 0.25, 6.2 × 10⁷: 1.25 ± 0.25, 6.2 × 10⁸: 1.00 ± 0.20, 6.2 × 10⁹: 1.00 ± 0, 6.2 × 10¹⁰: 1.60 ± 0.60; CD8: 6.2 × 10⁶: 1.00 ± 0, 6.2 × 10⁷: 1.00 ± 0, 6.2 × 10⁸: 1.00 ± 0, 6.2 × 10⁹: 1.00 ± 0, 6.2 × 10¹⁰: 1.40 ± 0.68).

Dose-dependent accumulations of complement receptor 3 (CR3)–immunoreactive (IR) activated microglia and macrophages, glial fibrillary acidic protein (GFAP)–IR activated astrocytes, expression of the major histocompatibility complex (MHC) class I and class II antigens, and infiltration of cluster of differentiation (CD) 4- and CD8-IR T-lymphocytes in the right striatum of rats receiving intrastriatal injections of AAV9-GFP viruses at 3 weeks. Immunostained striatal sections from representative rats receiving AAV9-GFP at a dose of 6.2 × 10⁶ vg (n = 4)
Inflammation and immune reactions in the right striatum after sequential application of AAV9-GFP
During these studies, two rats in Experiment 3 died during the surgery in the Str GFP and Str GFP-Str GFP groups, and they were not included in data analysis. There was very dense CR3 immunoreactivity in rat striatum in the M GFP-Str GFP and Str GFP-Str GFP groups (Fig. 4A–D). The rating scores of CR3 immunostains were significantly increased in rat striatum in both the M GFP-Str GFP (4.00 ± 0) and Str GFP-Str GFP (4.00 ± 0) groups when compared with the Str GFP (2.75 ± 0.25), M Empty-Str GFP (3.00 ± 0) and Str Empty-Str GFP (2.75 ± 0.25) (Fig. 4E–G, M; *p < 0.05). The rating scores for GFAP-immunostaining were significantly greater in the M GFP-Str GFP (3.60 ± 0.25), Str GFP-Str GFP (3.75 ± 0.25), and M Empty-Str GFP (4.00 ± 0) groups when compared with the Str GFP (3.00 ± 0) and Str Empty-Str GFP (3.00 ± 0) groups (Fig. 4H–L, N; *p < 0.05).
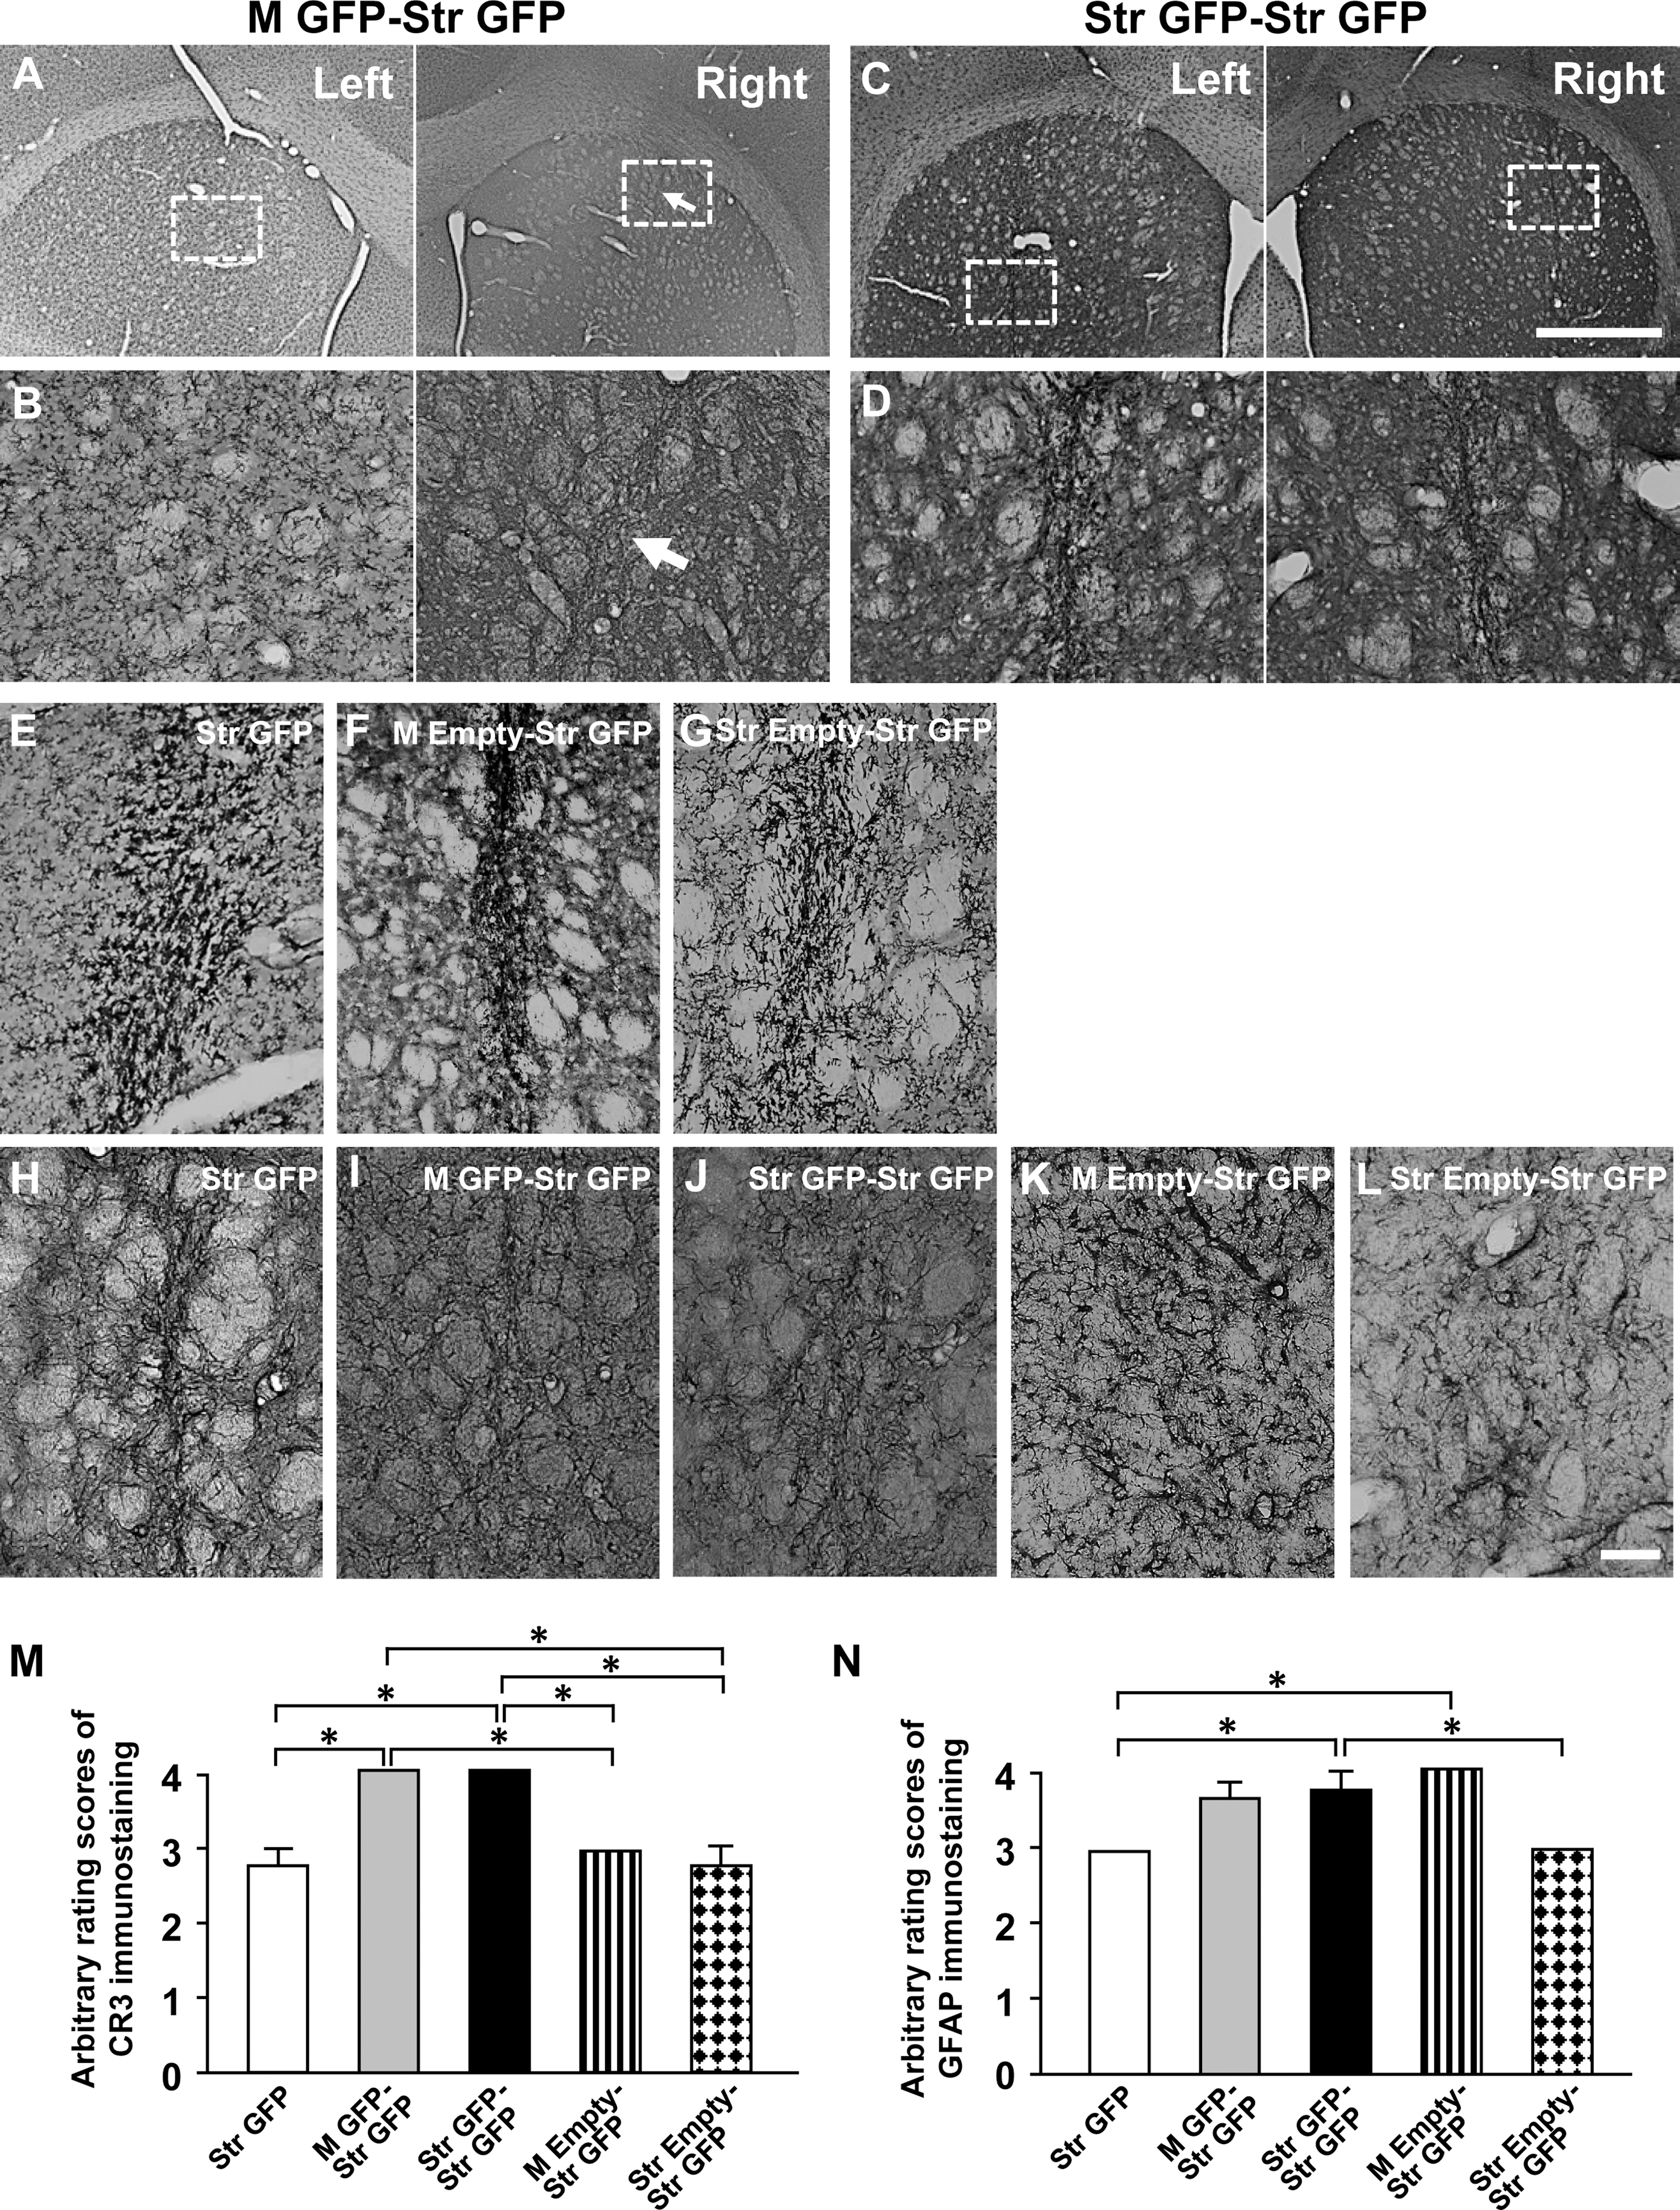
Complement receptor 3 (CR3)
The immunostaining of MHC class I (Fig. 5A–E) and II (Fig. 5F–J) antigens was prominent after sequential application of AAV9-GFP vectors. Perivascular cuffs (Fig. 5B, G) and necrosis (Fig. 5H) were often seen in the right (injected) striatum after sequential application of AAV9-GFP vectors. Three weeks after second viral injections, there were generally high rating scores for both MHC class I and class II immunostains in rat striatum in the Str GFP (MHC class I: 2.50 ± 0.50, MHC class II: 3.00 ± 0), M GFP-Str GFP (MHC class I: 2.80 ± 0.20, MHC class II: 3.40 ± 0.25), Str GFP-Str GFP (MHC class I: 3.25 ± 0.48, MHC class II: 3.00 ± 0.41), M Empty-Str GFP (MHC class I: 3.25 ± 0.25, MHC class II: 3.50 ± 0.29), and Str Empty-Str GFP (MHC class I: 2.50 ± 0.29, MHC class II: 2.50 ± 0.29) groups (Fig. 5K, L). There were low levels of infiltrated CD4-IR T-cells in rat striatum in the Str-GFP (Fig. 6A, 1.00 ± 0), M Empty-Str GFP (Fig. 6D, 1.25 ± 0.25), and Str Empty-Str GFP (Fig. 6E, 1.25 ± 0.25) groups. In contrast, the levels of CD4 immunostains were significantly increased in rat striatum in both the M GFP-Str GFP (Fig. 6B, 2.60 ± 0.40) and Str GFP-Str GFP (Fig. 6C, 3.25 ± 0.48) groups, when compared with the Str GFP, M Empty-Str GFP, and Str Empty-Str GFP groups (Fig. 6K; *p < 0.05). For CD8 immunostaining, the numbers of infiltrated CD8-IR T-cells were low in rat striatum in the Str-GFP (Fig. 6F, 1.00 ± 0), M Empty-Str GFP (Fig. 6I, 1.50 ± 0.29), and Str Empty-Str GFP (Fig. 6J, 1.50 ± 0.29). In contrast, the levels of CD8 immunostaining were significantly increased in rat striatum from both the M GFP-Str GFP (Fig. 6G, 2.40 ± 0.25) and Str GFP-Str GFP (Fig. 6H, 3.25 ± 0.48) groups, when compared with the Str GFP, M Empty-Str GFP, and Str Empty-Str GFP groups (Fig. 6L; *p < 0.05).
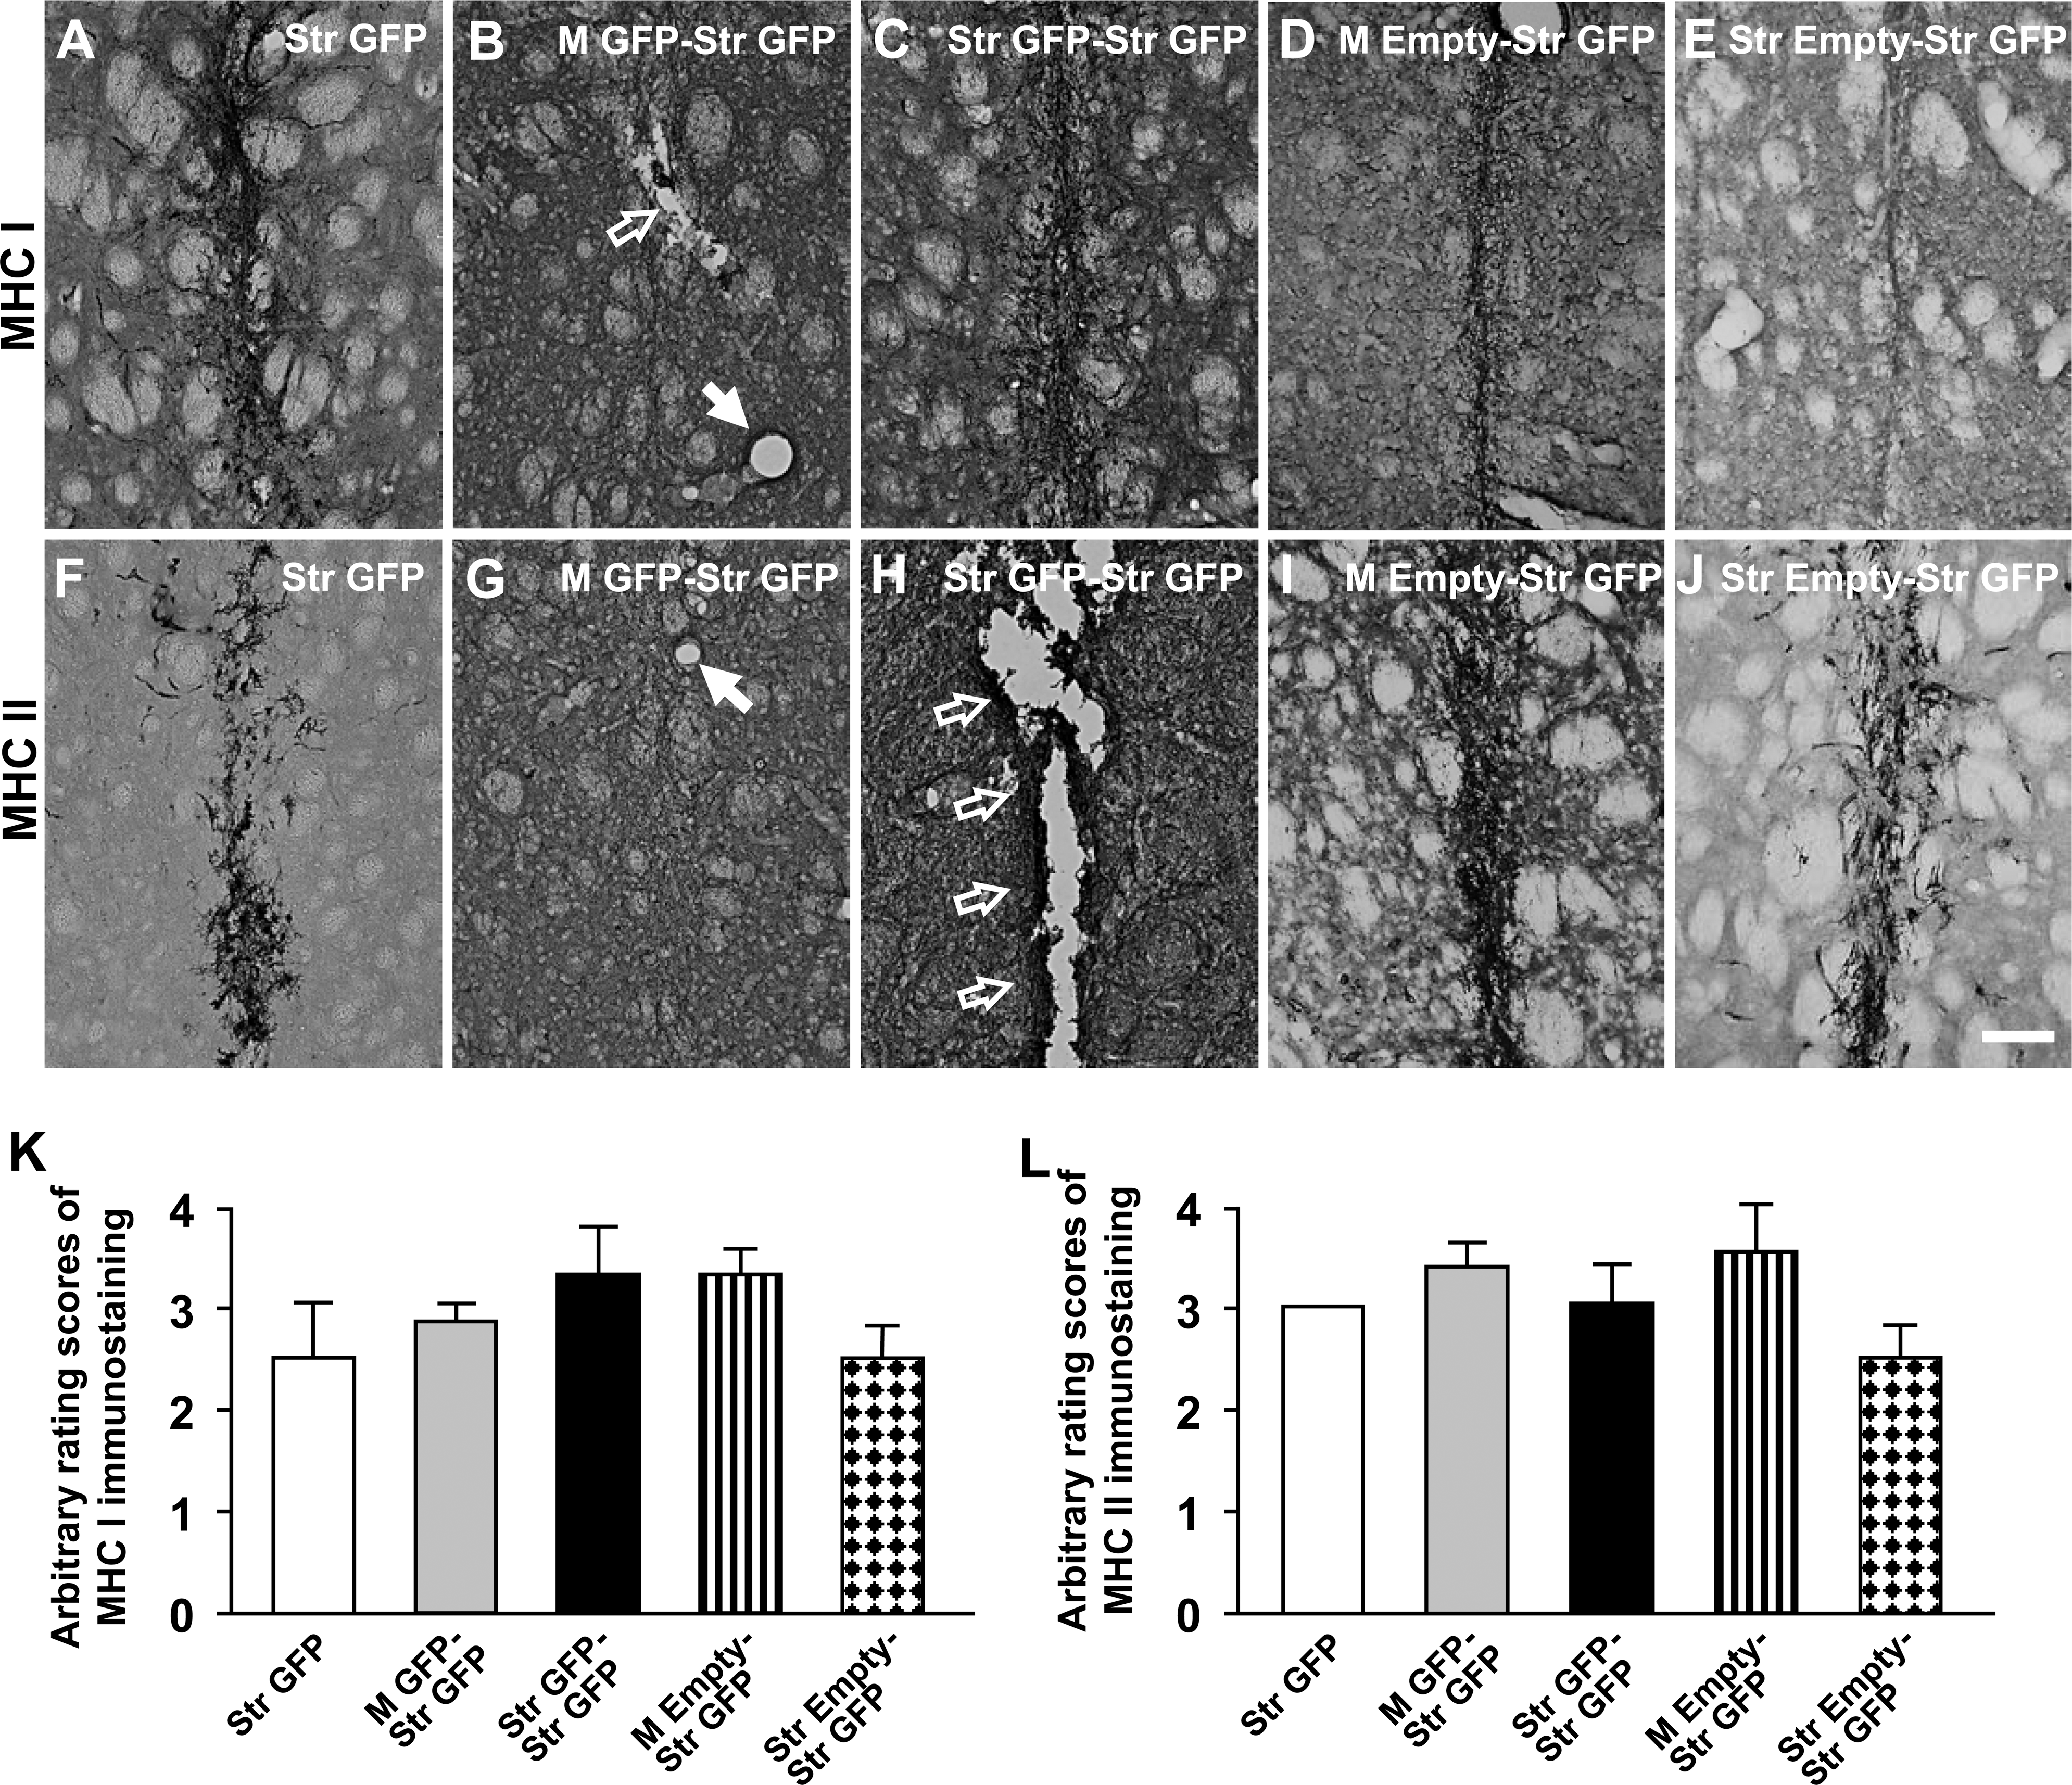
Expression of the major histocompatibility complex (MHC) class I and class II antigens in the right injected striatum. Photomicrographs were prepared from coronal sections through the striatum processed for MHC class I

Infiltration of cluster of differentiation 4 (CD4)-immunoreactive (IR) and CD8-IR T-cells in the right injected striatum. Photomicrographs were prepared from coronal sections through the striatum processed for CD4
The titer of neutralizing antibody against AAV9 vectors in rat sera
To assess the titer of preexisting neutralizing antibody against AAV9 vectors in rat serum, AAV9-GFP vectors were first incubated with the serial diluted serum before transducing HEK293T cells. Rat sera from the M GFP-Str GFP group that were diluted more than 1:1024 were able to inhibit GFP transduction of HEK293T cells by 50% (Fig. 7). In contrast, rat sera from the age-matched group that were diluted ranged from 1:2 to 1:4 were able to inhibit transduction by 50%. The titer of neutralizing antibody against AAV9 virus vectors in the serum was significantly greater in the Str GFP (ranging from 1: 64 to 1:256), M GFP-Str GFP (1:1024 to 1:2048), M Empty-Str GFP (1:256 to 1:512), Str Empty-Str GFP (1:128 to 1:256), and Str GFP-Str GFP (1:128 to 1:512) groups than in the age-matched group, and rat serum in the M GFP-Str GFP group had the highest titer of neutralizing antibody against AAV9 virus vectors among the groups (Fig. 7; F (5, 12) = 46.2, *,# p < 0.05).
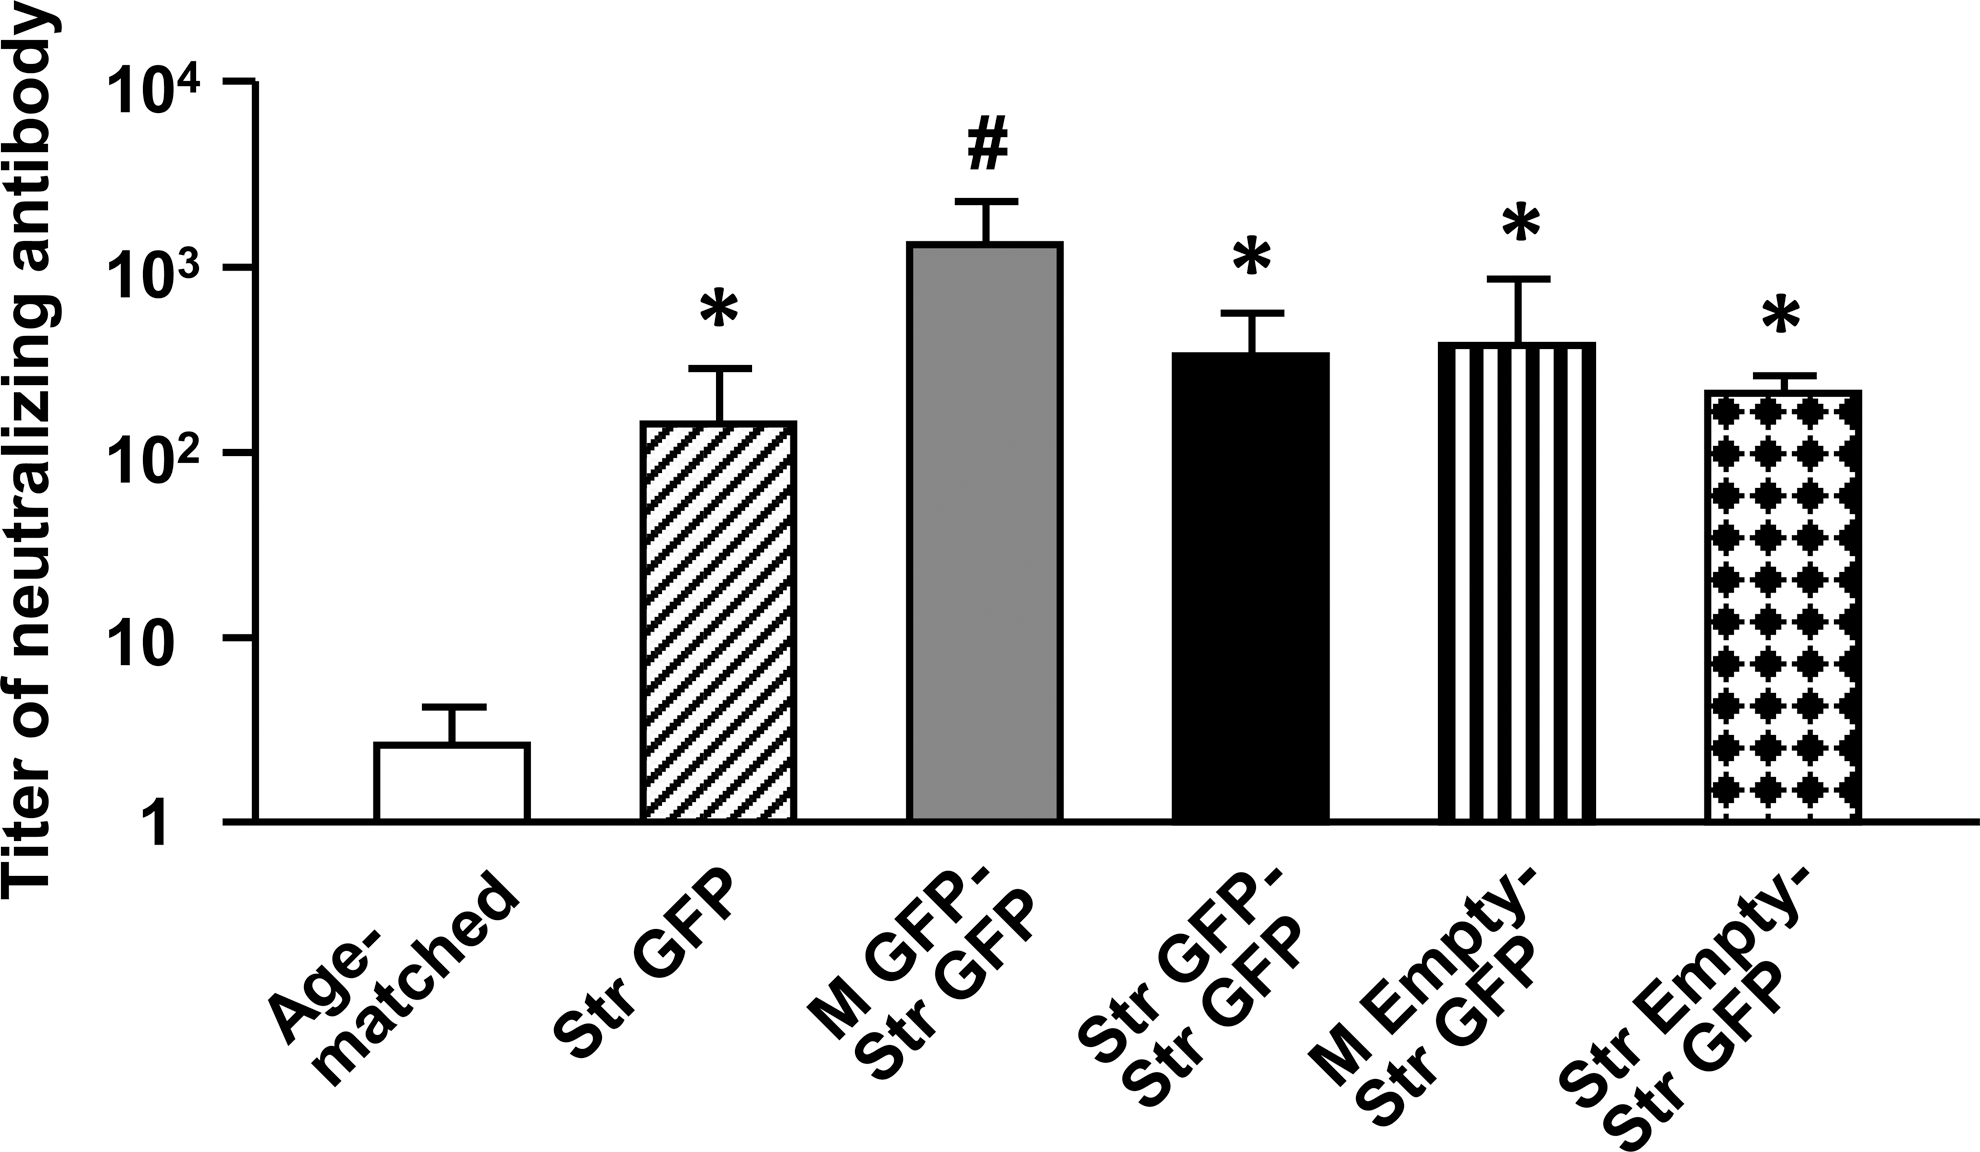
The titer of neutralizing antibody against AAV9 virus vectors in sera of rats from the Str GFP (oblique striped bar, n = 4), M GFP-Str GFP (gray bar, n = 5), Str GFP-Str GFP (black bar, n = 4), M Empty-Str GFP (vertical striped bar, n = 4), and Str Empty and Str GFP (doted bar, n = 4) groups. Age-matched rats (open bar, n = 5) were also used as controls. The data are presented as mean values ± standard error of the mean (SEM) of the serum dilution showing a 50% decrease in the transduction of HEK293T cells. A one-factor analysis of variance (ANOVA) followed by Fisher's post hoc test was applied to make group comparisons. *,# p < 0.05 versus the other groups. M, muscular; Str, striatal.
GFP gene expression in rat striatum after AAV9-GFP virus injections
The time-course study of GFP expression in rat striatum
Four days after a single injection of AAV9-GFP vectors into the right striatum, there were barely visible GFP-positive cells in low-magnification images of the striatum, and the border of GFP-positive cell area was not clearly seen. As the volume of GFP expression was used to evaluate the levels of GFP transduction in the present study, these data (4 days) for GFP transgene expression were not collected and included. At 3 weeks, there were increased levels of AAV9-GFP gene expression in rat striatum (Fig. 8A). At 6 months, GFP transduction showed a similar pattern to that at 3 weeks. GFP transduction was more intense in the striatum (Fig. 8B). The volume of AAV9-GFP transduction in the striatum was 15.79 ± 2.30 mm3 at 3 weeks and 16.83 ± 6.41 mm3 at 6 months, respectively (Fig. 8C), and there was no difference in the volume of AAV9-GFP transduction between 3-week and 6-month time points (p > 0.05, unpaired Student t-test).
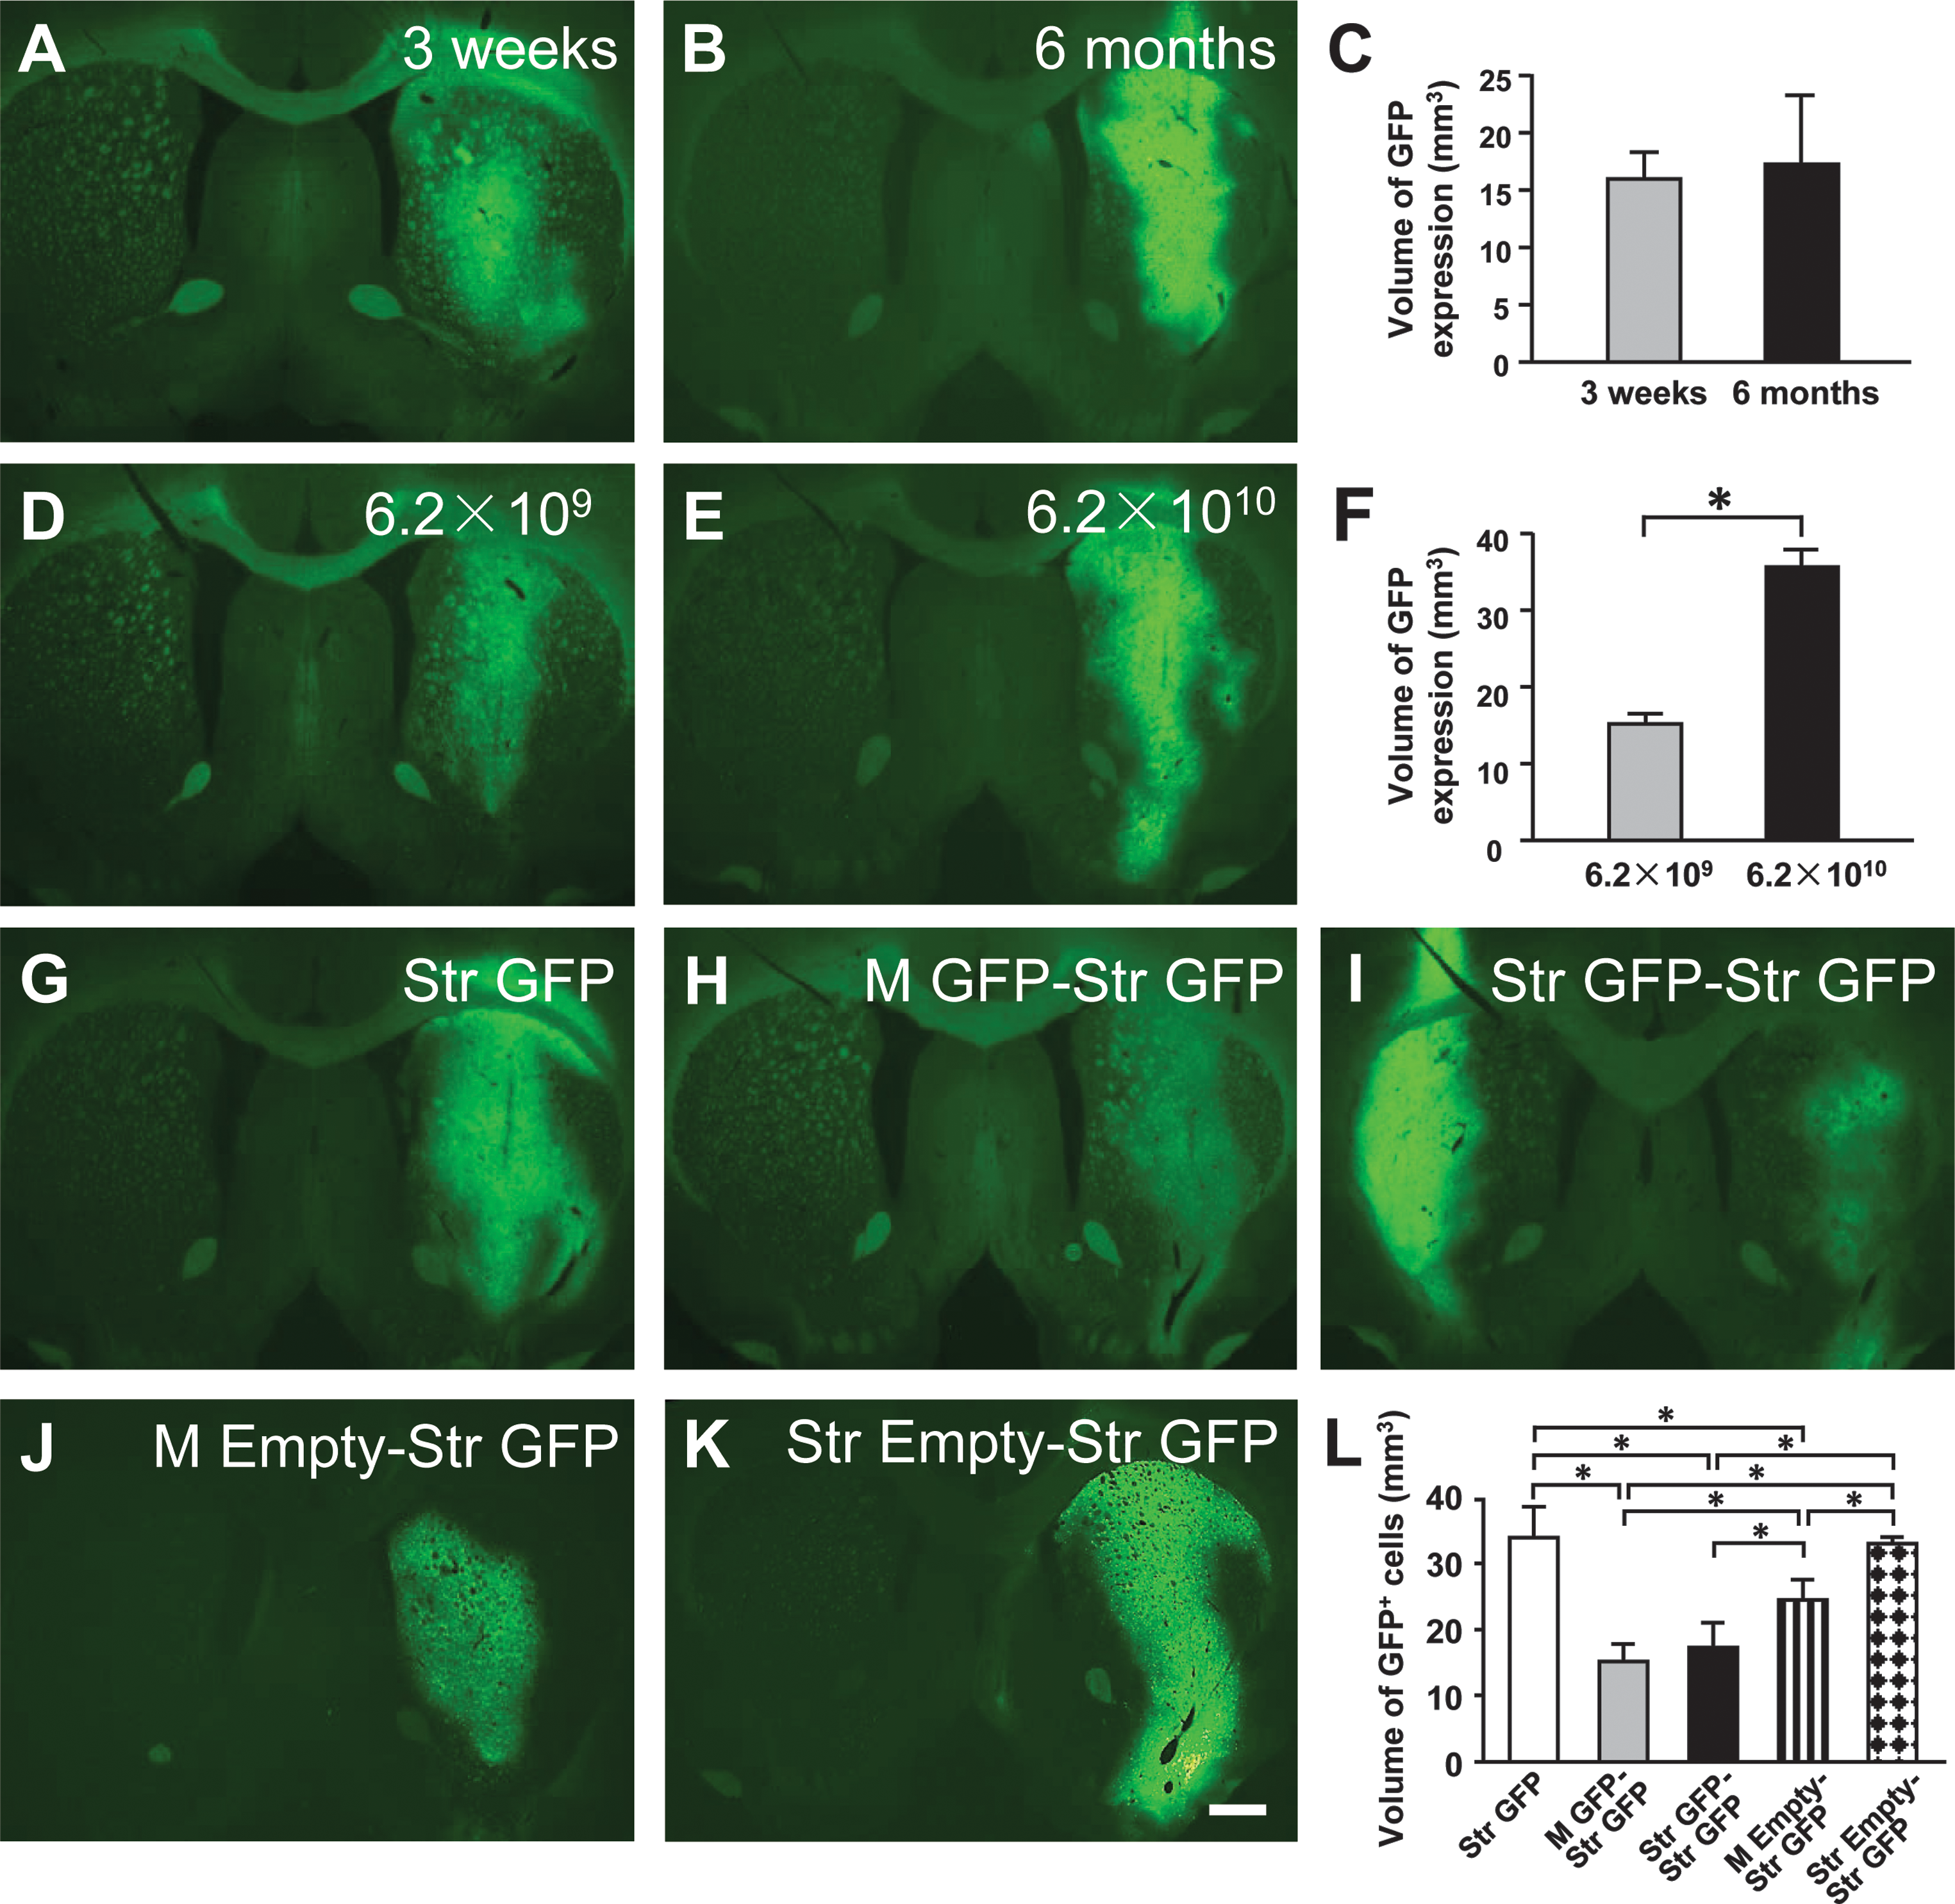
Green fluorescent protein (GFP) gene expression in the rat striatum after intrastriatal injections of adeno-associated virus serotype 9-GFP (AAV9-GFP) from Experiment 1 (time-course study,
Dose-dependent study of GFP expression in rat striatum
Doses at 6.2 × 10⁶, 6.2 × 10⁷, or 6.2 × 10⁸ vg led to low levels of GFP expression 3 weeks after viral injections, and GFP-positive cells were barely detected, which were similar to that seen in the time-course study (see Supplementary Fig. S4A–C). The data for GFP expression were therefore not collected and included for the rats receiving low doses of AAV9-GFP. A dose of AAV9-GFP (6.2 × 10⁹ vg) led to higher levels of GFP expression in rat striatum (Fig. 8D). A higher dose of AAV9-GFP (6.2 × 10¹⁰ vg) resulted in further higher levels of GFP transduction with more intense GFP expression and large numbers of GFP-positive cells (Fig. 8E). The volume of GFP expression in rat striatum for the 6.2 × 10¹⁰ vg group (35.48 ± 2.72 mm3) was significantly greater than that for the 6.2 × 10⁹ vg group (14.91 ± 0.99 mm3) (Fig. 8F; *p < 0.05).
GFP transduction in the right striatum after AAV9-GFP re-administration
GFP expression was widespread and prominent in the striatum 3 weeks after single AAV9-GFP viral injections in the Str GFP group (Fig. 8G). In contrast, the volume of GFP-positive cells was decreased in rat striatum in the M GFP-Str GFP (15.45 ± 1.11 mm3), Str GFP-Str GFP (17.05 ± 2.14 mm3), and M Empty-Str GFP (23.69 ± 1.53 mm3) groups when compared with the Str GFP (33.63 ± 2.56 mm3) and Str Empty-Str GFP (32.97 ± 0.626 mm3) groups (Fig. 8H–L; *p < 0.05, F (4,16) = 26.20). It was also noted that the volume of GFP transduction in the M Empty-Str GFP group was larger when compared with that in M GFP-Str GFP and Str GFP-Str GFP groups, respectively (Fig. 8L; *p < 0.05, F (4,16) = 26.20).
GFP expression was widespread in quadriceps femoris muscle after single AAV9-GFP viral injections in the M GFP-Str GFP group (see Supplementary Fig. S4D), suggesting the achievement of GFP transduction.
Discussion
The present study shows that long-term overexpression of the GFP gene mediated by AAV9 causes massive inflammation and intense immune response in the infected striatum. These adverse effects exhibit a temporal and dose-dependent manifestation. Both muscular and striatal injections of high doses of AAV9-GFP result in increased levels of inflammation and immune reactions against readministration of AAV9-GFP in the striatum, and reduce levels of GFP transduction, suggesting that AAV9-GFP administration through either route can efficiently immunize recipient rats and adversely affect the sequential gene transduction with the same virus vectors. Muscular but not striatal injections of high doses of AAV9-Empty result in increased levels of inflammation and immune response against re-administration of AAV9-GFP in the striatum, and reduce levels of GFP transduction, suggesting that immune privilege of the brain minimizes the efficiency of immunization by AAV9-GFP. In addition, rat sera from the rats received muscular or striatal administrations of AAV9-GFP vectors contain higher titers of neutralizing antibodies against AAV9 virus vectors than the age-matched group.
In contrast to our previous study and other studies in which AAV-mediated gene transduction only induced transient inflammation and immune responses in rat striatum, 25,26 our current study showed that long-term overexpression of the GFP gene mediated by high-dose AAV9 vectors resulted in severe inflammation and intense immune responses in rat striatum with necrosis and patchy tissue loss. Lowering the vector load reduced these host responses. These data suggest that strong GFP transgene expression often accompanies with robust inflammatory and immune responses. In agreement with previous studies, 15,19,23,25,30 our results showed that administration of AAV9-GFP into the striatum initiated both humoral and cellular immunity. GFP is stable and does not require any substrates or cofactors. 31 Accumulating evidence has shown that GFP can affect more cellular functions than initially thought. In an in vitro study, a variety of cells expressing the GFP gene were found to undergo apoptosis, and GFP expression-induced free radicals were shown to be an contributing factor. 32 Baens et al. demonstrated that GFP inhibited polyubiquitination that controls several cellular processes, for example, the nuclear factor-kappa B and Janus kinase (JNK) signaling pathways. 2,33 In addition, GFP expression caused the generation of oxidative stress and reactive oxygen species, 3,4 which could contribute to apoptosis. The accumulation of GFP in neurons often induces toxicity to cells. 6 It was reported that the transduction of humanized Renilla reniformis GFP led to more severe time-course and dose-dependent toxicity in mouse muscles when compared with the transduction of another derivative, enhanced GFP. 34
It has been demonstrated that toxicity of gene transduction and transgene-encoded products in rodent brain depends on the properties of transgenes. A study showed that striatal injections of AAV9 carrying the human aromatic L-amino acid decarboxylase (hAADC) gene led to a decreased number of neurons, generation of antibodies against hAADC, and transduction of antigen-presenting cells to elicit the immune response. 15 In contrast, we recently showed that injections of AAV9-hEPO at a high dose (1.2 × 10¹¹ vg per injection site) into rat striatum were largely well tolerated. 13,25 Accumulating evidence has shown that EPO can reduce inflammation, 35,36 apoptosis, 37,38 and reactive oxygen species formation. 39 In addition, EPO is also found to activate Akt/protein kinase B via the phosphoinositide 3-kinase pathway, 37 and JNK2 and nuclear factor-kappa B signaling pathways. 40 These properties of EPO may favor EPO existence in the striatum.
Activated microglial cells and astrocytes are considered to play key roles in the innate immune response. In normal conditions, microglial cells remain a ramified state. When microglial cells are activated in an inflammatory environment, these cells become more amoeboid morphology. Similar morphological changes occur to astrocytic cells. In the present study, evidence of increased levels of MHC class I and II antigen expression, and accumulation of T lymphocytes in the injected striatum also suggested that single and repeated administrations of AAV9-GFP into the brain initiated cellular immune response. Another striking finding was that re-administration of AAV9-GFP into the striatum led to dense CD4 and CD8 immunoreactivity in the GFP transduction areas. In addition, single administration of AAV9-GFP into the striatum at 6 months also caused intense CD4 and CD8 immunoreactivity in the GFP transduction areas. These data suggest that cell-mediated immunity may contribute to the reduced level of striatal GFP expression in the present model. Numerous studies have shown that cellular immunity with CD4 and CD8 T-lymphocytes plays a critical role in AAV-mediated gene transduction. 17,23,30,41 –43 For example, depletion of CD4 T-lymphocytes or immunosuppression enables successful transgene expression after re-administration of AAV vectors. 30,41 In contrast, several contradictory reports have shown that AAV2 capsid-elicited cellular immunity does not eliminate transduced cells in vivo. 19,44,45 The types of transgenes, different serotypes of AAV, and routes of AAV administration may contribute to these discrepancies. Besides innate and cell-mediated immunity, the humoral immunity induced by AAV vectors may also inhibit AAV-associated gene delivery. In agreement with our previous study, 25 muscular or striatal applications of AAV9-GFP increased levels of antibodies against AAV9 virus vectors, suggesting that a humoral immune response is also involved in AAV9-mediated GFP transduction. 18,20,21,23
In the present study, the levels of inflammation and immune responses to sequential GFP transduction in rat striatum were increased and the transduction of the GFP gene was reduced in the rats immunized by first striatal injections of AAV9-GFP vectors. These observations are contrary to our previous study showing that striatal administrations of AAV9-hEPO did not reduce hEPO expression in readministration. 25 The results suggest that GFP expression in rat striatum is more immunogenic. In addition, both muscular and striatal injections of AAV9-GFP led to massive inflammatory and immune responses as evidenced by perivascular cuffs and necrosis in sequential GFP transduction areas in the current study. When compared with the administration of AAV9-GFP, only muscular but not striatal microinjections of high doses of AAV9-Empty lead to increased levels of inflammation and immune reactions against re-administration of AAV9-GFP in the striatum and reduced levels of GFP transduction, suggesting that AAV9 capsids are less immunogenic than GFP. Effects of AAV9 capsids should not interfere with the proper interpretation of GFP adverse effects on the sequential transduction with AAV9 vectors in the current study. Peden et al. also demonstrated that AAV2-GFP expression was significantly reduced at the secondary injected sites. 19 In addition, another study showed that the AAV-mediated the firefly luciferase gene was also reduced in the second injected sites. 46 Taken together, these data provide further supportive evidence that there is a threshold level of immune privilege for the brain.
It is noted that we examined GFP transduction in the striatum by measuring the volume of GFP expression in the current study. This examination method was also used in a recent study. 15 The pattern of GFP expression in the striatum in the present study is consistent with our recent report that AAV9-hEPO transgene expression obtained a maximum level at 3-week time point. 25 By using GFP immunostaining, another study showed that AAV-GFP transduction resulted in maximum GFP-positive cell estimates in the striatum at 4-day time point, suggesting that GFP immunostaining was a more sensitive method to visualize GFP-transduced cells. 26
Although we attempted to systematically study host responses to AAV9-GFP transduction in the striatum, there are several weaknesses in our study. It has been reported that several factors, including the capsid proteins of AAV, types of virus vectors, promoters, and transgenes carried by virus vectors, can affect host inflammatory and immune responses against viral transduction and transgene expression in rat brain. 11,15,19,26,46 It is therefore necessary to set up a series of controlled experiments to compare our AAV9-GFP gene delivery system, and to verify the nature of GFP to initiate host inflammation and immunity. In the present study, the semiquantitative rating method was used to evaluate the levels of host inflammation and immune reactions. This method is mainly performed based on the presence of inflammatory and immune cells in the immunostained brain sections. If host inflammatory and immune responses are vigorous and immunostaining is very intense, individual inflammatory and immune cells can be hardly detected. There is therefore a need to explore a more quantitative analysis method.
In conclusion, our results suggest that GFP transduction in the brain is more immunogenic and toxic than previously thought. The adverse effects associated with GFP transduction must be considered when GFP is used as a marker gene in gene transfer experiments. Sequential GFP transduction in rat striatum is reduced in rats immunized by either striatal or muscular administration of AAV9-GFP, suggesting that immune privilege of the brain is only relative.
Footnotes
Acknowledgments
This study was supported in part by grants from National Key Basic Research Program of China (2011CB504100, WMD), Beijing Natural Science Foundation (KZ201110025022, WMD; 7112011, WMD) Beijing Institute for Brain Disorders (BIBD-PXM2013-014226-07-000084, WMD) and Capital Medical University Natural Science Foundation (2016ZR08, CY).
Author Disclosure
No competing financial interests exist.
References
Supplementary Material
Please find the following supplemental material available below.
For Open Access articles published under a Creative Commons License, all supplemental material carries the same license as the article it is associated with.
For non-Open Access articles published, all supplemental material carries a non-exclusive license, and permission requests for re-use of supplemental material or any part of supplemental material shall be sent directly to the copyright owner as specified in the copyright notice associated with the article.