
Abstract
The epiblast (foremost embryonic epithelium) generates all three germ layers and therefore has crucial roles in the formation of all mammalian body cells. However, regulation of epiblast gene expression is poorly understood because of the difficulty of manipulating epiblast tissues in vivo. In the present study, using the self-organizing properties of mouse embryonic stem cell (ESC), we generated and characterized epiblast-like tissue in three-dimensional culture. We identified significant genome-wide gene expression changes in this epiblast-like tissue by transcriptomic analysis. In addition, we identified the particular significance of the Erk/Mapk and integrin-linked kinase pathways, and genes related to ectoderm/epithelial formation, using the bioinformatics resources IPA and DAVID. Here, we focused on Fgf5, which ranked in the top 10 among the discovered genes. To develop a functional analysis of Fgf5, we created an efficient method combining CRISPR/Cas9-mediated genome engineering and RNA interference (RNAi). Notably, we show one-step generation of various Fgf5 reporter lines including heterozygous and homozygous knockins (the GET method). For time- and dose-dependent depletion of fgf5 over the course of development, we generated an ESC line harboring Tol2 transposon-mediated integration of an inducible short hairpin RNA interference system (pdiRNAi). Our findings raised the possibility that Fgf/Erk signaling and apicobasal epithelial integrity are important factors in epiblast development. In addition, our methods provide a framework for a broad array of applications in the areas of mammalian genetics and molecular biology to understand development and to improve future therapeutics.
Introduction
A
Indeed, epiblast development is crucial for body generation because defects of epiblast tissue lead to failed body axis formation. 6 In addition, mislocalized apical junction and extracellular matrix proteins, meaning loss of apicobasal polarity of epiblast cells, result in early embryonic lethality. 7 Despite the importance of epiblast development, little is known about the early processes that drive epiblast fate, including tissue-intrinsic gene expression, because of the difficulty in collecting sufficient amounts of epiblast tissue from mammalian embryos.
Previously, using an in vitro counterpart of the epiblast, called EpiSCs (epiblast stem cells derived from postimplantation epiblast tissue 8 ), transcriptional regulation in EpiSCs was revealed by comparing them with their derivatives, neural plate cells, 9 indicating that an in vitro culture system in the absence of extrinsic signals combined with transcriptomic analysis represented a useful tool for understanding the intrinsic mechanisms of early development. However, the question of how epiblast fate is acquired and more specifically, how tissue-intrinsic gene expression is triggered in the transition from inner cell mass (ICM) to epiblast as the embryonic epithelium, remained unanswered.
Advances in three-dimensional (3-D) differentiation culture from embryonic stem cell (ESC, counterpart of ICM in vitro 8 ) show that in vivo developmental processes can be accurately recapitulated in vitro. 10 –14 These advances have opened up new avenues for investigating the tissue-intrinsic mechanisms that regulate tissue and organ development, including understanding early tissue development such as of the epiblast.
Furthermore, ESC-derived 3-D brain organoids can recapitulate not only development but also disease pathogenesis in vitro by using patient-derived pluripotent stem cells. 15 Alternatively, 3-D-developed intestinal organoid systems have been combined with genome-editing technologies to generate a 3-D model of colorectal cancer. 16
Genome-editing technologies are progressively improving, and are used widely to facilitate genetic manipulations in a variety of cell types and organisms. CRISPR (clustered regularly interspaced short palindromic repeat) is one of the most useful systems for model organisms, using an RNA-directed adaptive immunity system in bacteria and archaea. 17 –19 In this system, RNA guides endonuclease Cas9 to generate targeted DNA double-strand breaks (DSBs). The DSBs subsequently activate two cellular DNA damage repair pathways. The first is error-prone nonhomologous end joining (NHEJ), leading to the introduction of small insertions or deletions at the target site and resulting in disruption of gene functions via frame-shift mutations. The second, homology-directed repair (HDR), is a template-dependent pathway inserting the donor molecule at the targeted locus. 20 HDR works efficiently via genome-editing-mediated DSB to establish genetic alterations/modifications. 20
Genome editing has been applied in pluripotent stem cells, including human ESCs. Whereas there are reports on applications for disease models, 21 those on applications for developmental models are comparatively few, especially in early differentiation of 3-D ESC culture systems.
In this study, we used a 3-D culture method to characterize mouse epiblast-like tissue, to analyze its whole transcriptome, and to manipulate its genes by genome editing and inducible RNA interference (RNAi). Interestingly, comparative transcriptomic data show that in the epiblast-like tissues, significant change-signaling pathways and genes are involved in ectoderm and epithelial polarity formation. Our findings provide useful tools for analyzing large transcriptomic data (genome-wide data of pathways and genes in epiblast-like tissues) and for efficiently generating mouse ESCs that can be manipulated to reveal gene functions during mammalian development.
Materials and Methods
ESC culture
Mouse ESCs (EB5 derivatives, Rax::GFP and Sox1::GFP) were maintained and SFEBq (serum-free floating culture of embryoid body-like aggregates with quick reaggregation) was performed as described previously. 22 In brief, for investigating intrinsic mechanisms of tissues, we seeded dissociated mouse ESCs (3000 cells per well) in a growth factor-free chemically defined medium (gfCDM) placed in a 96-well, low-cell-adhesion plate. To monitor tissue development under live conditions, we used a BZ-9000 microscope (KEYENCE, Osaka, Japan) to acquire transillumination and fluorescence images. Acquired images were processed with BZ2 image analysis software (KEYENCE).
Immunohistochemistry
Immunohistochemistry was performed on cryosectioned sample slides and on ESC colonies in 8-well chamber slides as previously described. 23,24 F-actin was visualized with Alexa Fluor® 546 phalloidin (Thermo Fisher Scientific, Waltham, MA). Images were acquired with an LSM 710 or 780 confocal microscope (Carl Zeiss, Oberkochen, Germany). Antibodies used in this study were as follows: E-cadherin (rat, diluted 1:100, M108; TaKaRa Bio, Otsu, Japan), laminin (rat, diluted 1:1000, MAB1905; Chemicon, Temecula, CA), Oct3/4 (mouse, diluted 1:200, 611202; BD Biosciences, San Jose, CA), Otx2 (rabbit, diluted 1:1000, ab21990-100; Abcam, Cambridge, UK), pT202/Y204 Erk1/2 (called dpErk) (rabbit, diluted 1:200, 4370; Cell Signaling Technology, Danvers, MA), Tfe3 (rabbit, diluted 1:500, HPA023881; Atlas Antibodies, Stockholm, Sweden), platelet/endothelial cell adhesion molecule 1 (PECAM-1) (rat, diluted 1:250, 550274; BD Biosciences), and Fgf5 (rabbit, diluted 1:100, 18171-1-AP; Proteintech, Chicago, IL).
RNA extraction, cDNA synthesis, and RT-qPCR
RNA was extracted with QIAcube (Qiagen, Hilden, Germany) according to the manufacturer's protocol. As previously reported, 25 350 μl of buffer RLT was added to dissociated ESC pellets and spun through QIAshredder (Qiagen) before RNA extraction. The cDNA samples for RT-qPCRs were generated with SuperScript II (18064-014; Thermo Fisher Scientific). The qPCRs were performed with an Applied Biosystems 7500 fast real-time PCR system (Thermo Fisher Scientific). Standard curves were estimated, using a series of dilutions of cDNA purified from mouse ESCs and day 3 tissues. Primer sets for qPCR were as follows: gapdh, forward 5′-tgaccacagtccatgccatc-3′, reverse 5′-gacggacacattgggggtag-3′; oct3/4, forward 5′-gttggagaaggtggaaccaa-3′, reverse 5′-ctccttctgcagggctttc-3′; rex1, forward 5′-gcggtgtgtactgtggtgtc-3′, reverse 5′-gacaagcatgtgcttcctca-3′; fgf5, forward 5′-gcgatccacagaactgaaaa-3′, reverse 5′-actgcttgaacctgggtagg-3′. The expression level of each mRNA was estimated according to standard curve and normalized to that of gapdh. Data were displayed as the arbitrary units or as the relative values to each control.
FACS analysis of immunostained cells and cell isolation
Fluorescence-activated cell-sorting (FACS) analysis of immunostained cells was performed as previously described. 26 In brief, cells were dissociated to single cells, using TrypLE Express (Thermo Fisher Scientific) treatment, and filtered through a cell strainer (BD Biosciences) to remove debris. Cells were fixed and permeated with CytoFix fixation buffer (554655; BD Biosciences) and Perm/Wash buffer (557885; BD Biosciences), respectively. Perm/Wash buffer was used as both the antibody diluent and wash buffer. Cells were then incubated with the dpErk primary antibody (same dilution as above) at room temperature for 30 min. Next after removing primary antibody and washing cells, we added secondary antibody conjugated with the fluorescent probes, Cy3 (1:200, Jackson ImmunoResearch; West Grove, PA) at room temperature for 30 min. Subsequently, stained cells were analyzed with FACSDiva software (BD Biosciences) to identify positive populations. For cell isolation, the TagBFP- and tdKeima- (or mRFP1-) positive populations were detected by V450-A and YG-PE-A, respectively. The cells emitting strong fluorescent signal were sorted and collected in ice-cold ES medium. Sorted cells were reanalyzed to verify the quality of sorting. Data were analyzed with FlowJo software (FlowJo, Ashland, OR). All processes were performed according to the manufacturers' instructions.
Microarray, volcano plot, heat map, and DAVID website analysis
The total RNA on day 0 (ESC) and day 3 (epiblast-like tissue) was prepared from the pooled samples in biological duplicates from one 10-cm dish of ESCs and 100 epiblast-like tissue samples in each experiment. cDNA synthesis and cRNA labeling reactions were performed as previously described.
27
Affymetrix high-density oligonucleotide arrays for Mus musculus (GeneChip mouse genome 430 2.0) were hybridized, stained, and washed according to the GeneChip Expression Analysis Technical Manual (Affymetrix, Santa Clara, CA).
28
The expression values were summarized by the robust multiarray average (RMA) method.
28
The resulting expression values were used in all the subsequent analyses. All data are MIAME (Minimum Information about a Microarray Experiment) compliant and the GEO (Gene Expression Omnibus) accession number for the microarray data deposited and reported in this paper is GSE74236. MARGN_5 and MARGN _7 indicate samples 1 and 3 (ESC). MARGN_6 and MARGN_8 indicate samples 2 and 4 (epiblast-like tissue). Significantly changed genes (false discovery rate [FDR] ≤0.05) were used to draw the volcano plot and heat map. Ingenuity pathway analysis (IPA) was used to identify gene networks according to biological functions and/or diseases in the Ingenuity Pathways Knowledge Base (Ingenuity Systems, Redwood City, CA). The significantly changed genes served as input to the Ingenuity Pathways Analysis Knowledge Base version 4.0. Lists of the top pathways associated with genes displaying significant changes in expression were generated with corresponding Benjamini–Hochberg p values. Expression data were overlaid on canonical pathways associated with altered gene expression. To identify specifically upregulated and downregulated genes in epiblast-like tissue/EpiSCs against ESC and neural plate cells (NPCs), we reanalyzed the published data (see Iwafuchi-Doi et al.
9
; NCBI GEO, GSE38085). Genes satisfying FDR ≤0.05 in both EpiSCs versus NPC1 and EpiSCs versus NPC2 were identified as significantly changed genes between the EpiSCs and NPCs. After combining two data sets of significantly changed genes in ESC versus epiblast-like tissue and in EpiSCs versus NPCs, we selected genes that were significantly and specifically upregulated in epiblast-like tissue/EpiSCs. These gene sets were applied to DAVID (Database for Annotation, Visualization and Integrated Discovery;
Construction of targeting vector
Fgf5 homology arms were prepared from a bacterial artificial chromosome (BAC) clone (bMQ436i06 for Fgf5; 129/J mouse) by PCR amplification using the following primer sets: forward 5′-ggggacaactttgtatagaaaagttgcaactgggcagtcctggtgttcag-3′, reverse 5′- ggggactgcttttttgtacaaacttgccatggtggctcttccggccgcgg-3′ for the 5′ homology arm; and forward 5′-ggggacagctttcttgtacaaagtgggagccctagcgtctgggactctgc-3′, reverse 5′-ggggacaactttgtataataaagttgtgagccctgctggaaacccgacct-3′ for the 3′ arm. Arms and reporter cassettes were recombined to generate a destination vector as described previously. 29
Designing CRISPR guide RNAs, cleavage detections, and sequencing alleles
To design guide RNAs (gRNAs), we used one of three web-based tools for each gRNA: ZiFiT-CRISPR/Cas Nucleases (Zinc Finger Consortium, ZiFiT Targeter; see
Alkaline phosphatase assay
We performed an alkaline phosphatase assay as described previously, 24 using a leukocyte alkaline phosphatase kit (Sigma-Aldrich, St. Louis, MO).
Construction of pdiRNAi vector
For pdiRNAi plasmid construction, four separate vectors (p1, p2, p3, and p4) were recombined on the basis of a previous report 31 : p1, pPGK::puror (puromycin resistance gene driven by the phosphoglycerate kinase [PGK] promoter for selection of transgenic cells) and pPGK::neor (neomycin resistance gene driven by the PGK promoter for selection of transgenic cells); p2, pENTR4-H1tetOx1 (H1 promoter with tet operator sequence for short hairpin RNA [shRNA] transcription [SENSE-loop-ANTISENSE]), lacZ 5′-GACTACACAAATCAGCGATTT-ttcaagaga-AAATCGCTGATTTGTGTAGTC-3′ (against coding region), and fgf5 (against noncoding untranslated region) 5′-TCAGATCACCGAGGATATAAA-ttcaagaga-TTTATATCCTCGGTGATCTGA-3′; p3, pCAG::TetR-2A-TagBFP (Tet repressor gene [TetR] is fused with self-cleaving peptide [2A] and TagBFP in a sequential manner by chimeric PCR using CS-RfA-ETR and pTagBFP-N), pCAG::TetR-2A-mRFP1-NES (TetR is fused with 2A, mRFP1 and nuclear export signal [NES] in a sequential manner by chimeric PCR using CS-RfA-ETR), and pCAG::TetR-2A-tdKeima-myc-NLS (TetR is fused with 2A, tdKeima, myc epitope, and nuclear localization signal [NLS] in a sequential manner by chimeric PCR using CS-RfA-ETR and pRSETb). pCAG is a cytomegalovirus enhancer fused to the chicken β-actin promoter for constitutive expression in all lineages. 32 TagBFP, mRFP1-NES and tdKeima-myc-NLS proteins can be detected by tRFP, RFP, and Myc antibodies, respectively; p4, I-SceI SAR-CH4 Tol2 (backbone plasmid with Tol2 elements). SAR-CH4 is a human interferon β-scaffold attachment region and chicken β-globin DNase I hypersensitive site 4 (to protect integrated transgenes from positional effects 33 –35 ). We recombined four separate vectors to obtain pdiRNAi vectors harboring shRNA against lacZ or fgf5. pENTR4-H1tetOx1 and CS-RfA-ETR 25 were gifts from H. Miyoshi (Keio University School of Medicine, Japan), pRSETb was a gift from A. Miyawaki (Brain Science Institute, RIKEN, Japan), and I-SceI SAR-CH4 Tol2 was a gift from N. Love (Center for Developmental Biology, RIKEN, Japan). To generate a stable line, we carried out the following pdiRNAi system induction: on day 0, pdiRNAi plasmid was introduced with pCAG::Tol2 (a gift from N. Love) into parental ESCs, using the Amaxa Nucleofector (Lonza). Two days later (day 2), we added puromycin (2 μg/ml) to the medium for selection and then, on day 7, we sorted the top 3% of cells (expressing strong fluorescent signals) to establish a stable polyclonal population of transgenic cells with fluorescent signals from TagBFP, mRFP1, and tdKeima. In this system, fluorescence intensity was quantitatively correlated with the expression level of induced shRNA (meaning strong fluorescence-expressing cells should be strong shRNA-expressing cells). Hereafter, we denote these sorted ESC populations as “tet-[Target]-[reporter]” (in this case, tet-lacZ-TagBFP, tet-lacZ-mRFP1, and tet-fgf5-tdKeima). To silence gene expression in the developing tissue, the H1 promoter was relieved from TetR by doxycycline supplementation, which leads to the induction of shRNA transcription. We added doxycycline at 0.01, 0.1, or 1 μg/ml for 24 hr from day 2, collected samples on day 3, and then conducted RT-qPCR analysis.
Time-lapse imaging
Live imaging was performed with an incubator-combined confocal optic system (Olympus, Melville, NY) as previously described. 11 We used a thin plastic-bottom dish (μ-Dish, 35 mm, low, cat. no. 80136; ibidi, Martinsried, Germany), supplied penicillin–streptomycin, and then recorded with an LCV110 equipped with 445-nm (for TagBFP), 488-nm (for tdKeima), and 561-nm (for mRFP1) excitation lasers. GFP/Venus and tdKeima can be excited with the 488-nm laser alone and signals can be detected simultaneously (data not shown). We edited acquired images with MetaMorph software (Molecular Devices, Sunnyvale, CA) and free ImageJ software.
Statistical analysis
Statistical analyses were performed with Prism (GraphPad Software, San Diego, CA). Data sets were first checked for standard error of the mean to generate error bars. 36 The appropriate tests for comparison were performed: t tests (two samples) and Tukey's test (all samples) were used to generate p values.
Results and Discussion
Apicobasal polarized day 3 tissue possesses epiblast characteristics
Because it is difficult to obtain sufficient quantities of in vivo epiblast cells for large-scale analysis and gene manipulation, we used SFEBq, a method for generating 3-D tissues in vitro from ESCs (see Materials and Methods). To understand the intrinsic mechanisms of epiblast formation, we used a strict chemically defined medium (CDM) to induce epiblast-like tissue, which emerged on culture day 3. 22,26 When cultured in SFEBq/CDM, the ESCs aggregated into a spherical shape (Fig. 1A). Spherical aggregates exhibited ubiquitous E-cadherin distribution on the cell surface in day 1 aggregates, similar to those observed in ESC colonies (Fig. 1B).

Apicobasal polarized day 3 tissue possesses epiblast characteristics.
In general, ICM-derived epiblast cells possess an epithelial structure that is enclosed by extraembryonic tissue, called visceral endoderm, in the egg cylinder stage (Fig. 1C). 37 This epithelial formation is the first morphological sign of body generation as embryonic epithelium (not seen in ICM). To determine whether day 3 aggregates possess epiblast characteristics, we performed immunostaining to analyze apical–basal polarity, which is one characteristic of epithelium, 38 by comparing them with in vivo epiblast tissue (Fig. 1C). We found that E-cadherin, which is known to be expressed on the apical side of epithelium, 39,40 was expressed on the inner region of day 3 aggregates (Fig. 1D and E). Apically polarized E-cadherin distribution is seen in epiblast tissue on embryonic day 6.5 (E6.5) (Fig. 1D and E). Regarding basal polarity, laminin is known to be a major component of the extracellular matrix assembled on the basal side of epithelial cells to produce epithelial polarity. 41 –43 We found that laminin was expressed on the outer region of day 3 aggregates, as seen in the in vivo E6.5 embryo (Fig. 1F). 44 Whereas the in vivo E6.5 embryo has a visceral endoderm layer, there were few cells outside of the laminin-expressing area in the day 3 aggregates (Fig. 1F). These lines of evidence thus suggest that day 3 aggregates indeed possess a polarized epithelial structure reminiscent of in vivo E6.5 epiblast tissue at the egg cylinder stage. 44 Notably, this aggregate culture could minimize the extrinsic signals from extraembryonic-like cells.
To further characterize day 3 tissues, we performed immunostaining for pluripotent marker Oct3/4, 9 which is expressed in the epiblast, and found that it was expressed in most cells of the ESC colony and of day 3 tissues (Fig. 1G). Expression of oct3/4 in day 3 tissues was also comparable to that seen in ESCs, suggesting that day 3 tissues maintained pluripotency (Fig. 1H). In addition, in day 3 tissues, we detected Otx2, which is known to be expressed in E6.5 epiblast 45 (Fig. 1I).
A previous report suggested that the Fgf/Erk pathway primes cells to enter a transitional stage, analogous to an egg cylinder epiblast. 46 Therefore, we speculated that Erk, a downstream mediator of Fgf signaling, might be active in day 3 tissues if they acquired an epiblast-like state in vitro. We detected double-phosphorylated Erk (dpErk) signals, which reflect the active state, 47 in day 3 tissues (Fig. 1J). These signals were also detected in day 3 tissues via FACS analysis, after immunostaining (Fig. 1K).
According to one report, the basic helix–loop–helix transcription factor Tfe3 is redistributed in the cell during the transition from ICM to epiblast cells. 48 Namely, Tfe3 is localized in the nucleus in the ICM and is localized in the cytoplasm in epiblast cells. 48 Consistent with this, we found Tfe3 localization in nucleus and cytoplasm of ESCs and day 3 tissue, respectively (Fig. 1L and M).
To test whether residual ESCs are present in day 3 tissues, we performed immunostaining of PECAM-1, which is known to be expressed in ICM and ESCs. 49,50 Signals positive for PECAM-1 were detected in the partial population of the inside of day 3 tissues, suggesting that some PECAM-1+ cells sustained the ESC-like identity (Fig. 1N).
Thus our findings demonstrate that day 3 tissues acquired typical epiblast characteristics regarding epithelial structure, pluripotent gene oct3/4 expression, Otx2 expression, Erk activity, and Tfe3 localization, recapitulating epiblast formation in vivo (Fig. 1O and Supplementary Fig. S1; supplementary data are available online at
Genome-wide analysis of ESC and day 3 epiblast-like tissue
We next sought to determine the potential genes that characterize epiblast cells, which would show changes in expression between ESCs and day 3 tissues. We therefore examined gene expression of ESCs and day 3 tissues in a genome-wide fashion, using microarray analysis (Fig. 2A).
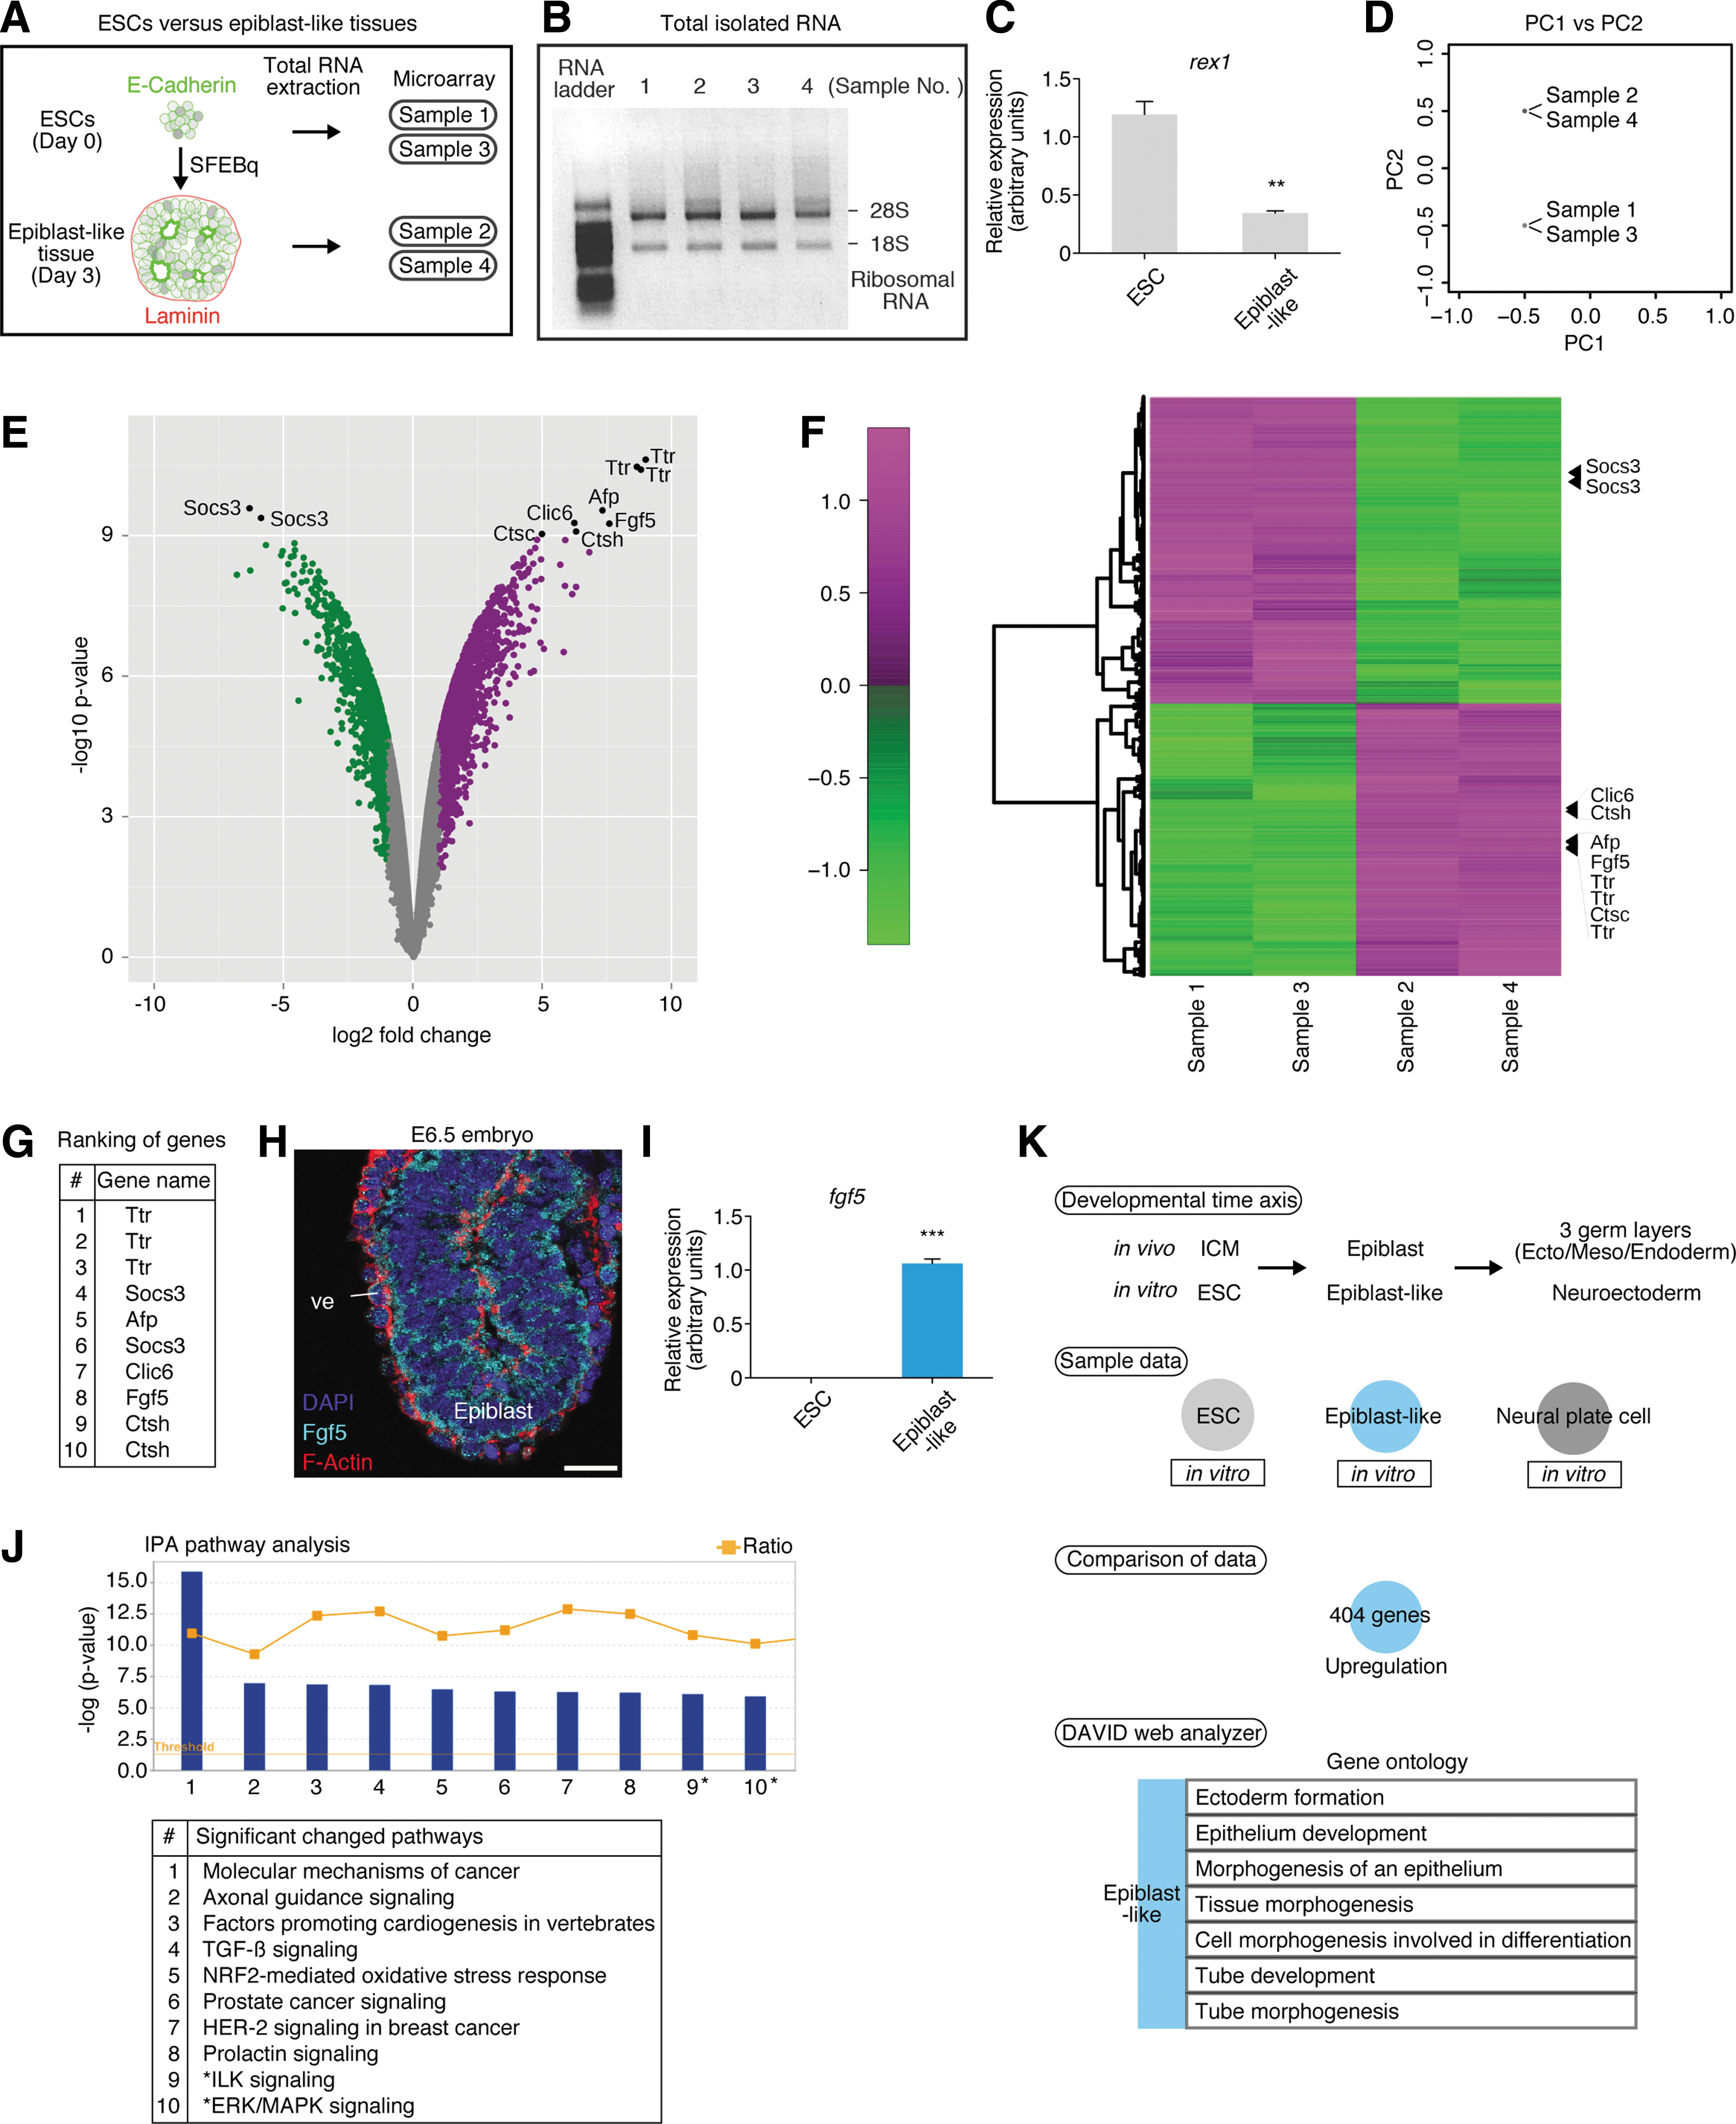
Genome-wide analysis of embryonic stem cells (ESCs) and day 3 epiblast-like tissues.
For this, we extracted total RNA from ESCs and day 3 tissues and analyzed them in biological duplicates. Before performing microarray analysis, we confirmed the quality of our samples by gel electrophoresis and RT-qPCR, detecting the ideal quality of total RNA and the expected differences in rex1 (another pluripotent marker of ESCs 52 ) expression between the samples (ESCs and epiblast-like tissues) (Fig. 2B and C).
Microarray analysis for a broader range of genes was carried out, and we found that each sample was clearly divided by principal components analysis (PCA) (Fig. 2D). In total, 12,019 genes showed significantly changes in expression between the ESC and day 3 tissue samples as indicated by volcano plot and heat map analysis (Fig. 2E and F). Among the significantly changed genes, we listed 10 genes in high order (Fig. 2G; see volcano plot and heat map data). Notably, Fgf5 was specifically expressed in epiblast tissue but not in extraembryonic lineage in vivo (Fig. 2H). 52 This preferential expression of fgf5 was confirmed by RT-qPCR (Fig. 2I). In addition, IPA pathway analysis showed that Erk/Mapk signaling, a downstream mediator of Fgf, was significantly changed (Fig. 2J and Supplementary Fig. S2). Indeed, many Fgf-related genes 53 were identified as significantly changed genes, further suggesting that Fgf signaling was involved in epiblast-like tissue formation (Supplementary Table S1).
Interestingly, we also found that integrin-linked kinase (ILK) signaling ranked in the top 10 pathways via IPA analysis (Fig. 2J and Supplementary Fig. S2). ILK plays important roles in maintaining the basal integrity of epithelial polarity through integrin activity, when cells respond to extracellular matrix proteins, such as laminin and collagen. 54 Alternatively, ILK is also involved in epithelial sheet morphogenesis by regulating E-cadherin localization, leading to cell–cell adhesion. 55 In fact, 20 cadherin-related genes were found to be among the significantly changed genes (Supplementary Table S1). A previous report showed that E-cadherin helped to incorporate epiblast stem cells into in vivo embryonic tissues, indicating the importance of the cadherin system. 56 Thus, interactions between ILK and cadherin pathways may be generating the apicobasal polarity in the epiblast epithelial structure during normal development. Unless otherwise specified in the apicobasal polarity, epithelial integrity and homeostasis might collapse, leading to developmental defects. 57
To better understand the characteristics of ESCs and epiblast-like tissues in detail, we compared our microarray results with a previous report showing EpiSCs (a cell line that resembles epiblast cells 58 ) and its earliest derivatives, neural plate cells, in vitro. 9 Although in our SFEBq/CDM culture, day 3 epiblast-like tissue differentiates into anterior neural plate tissue within days, we explored the genes that are preferentially upregulated in epiblast-like tissues, and compared them with gene profiles in ESCs and neural plate cells as references (Fig. 2K; see Materials and Methods for how to compare these gene lists). We found 404 genes that were preferentially upregulated in the epiblast-like tissues (Supplementary Table S2) and analyzed these significantly changed genes, using bioinformatics resources. We used the DAVID web analyzer to perform systematic and integrative analysis. 59 Using gene ontology analysis, we found that certain genes related to ectoderm formation and epithelial polarity were markedly upregulated in epiblast-like tissues when compared with ESC and neural plate lineages, suggesting that ectoderm/epithelial formation-related genes were primarily involved in epiblast formation (Fig. 2K and Supplementary Table S2).
These results raised the possibility that epiblast cells are primed to commit to primary germ layer formation through the formation of ectoderm epithelial polarity.
CRISPR/Cas9 cleaves Fgf5 target sequences in ESC genome
On the basis of the results showing the potential roles of the Fgf/Erk pathway and of Fgf5 as a ligand in the epiblast, we decided to focus our investigation on fgf5 as a model for functional gene analysis.
Therefore, we performed genome editing to disrupt Fgf5 at the genome level, using the CRISPR/Cas9 system. We first designed Fgf5 gRNA sequences (see Materials and Methods) and constructed Fgf5 CRISPR/Cas9 vectors (hereafter referred to as gRNA1, gRNA2, and gRNA3) (Fig. 3A). Electrophoresis of enzymatically digested PCR products via cleavage detection assays showed that all CRISPRs had noticeable DSB-inducing activity (Fig. 3B). Importantly, we found differences in activity among the three designed CRISPRs (Fig. 3C).

CRISPR/Cas9 cleaved Fgf5 target sequences in ESC genome.
An efficient method (GET method) for generation of CRISPR-mediated mutant and knockin lines
Next, we explored possible methods for generating mutant and knockin (KI) lines. Because HDR occurs efficiently by introducing a targeting vector harboring homology arms, we speculated that introducing CRISPR/Cas9 and targeting vectors would facilitate the generation of KIs and mutants (as coproducts).
We generated a targeting vector with short homology arms that have a Turquoise2 reporter and neomycin resistance gene (Fig. 4B). These genes were expected to allow us to select KI cells efficiently and to help observe the gene expression dynamics as fluorescent signals under live conditions. We then introduced a targeting vector with each CRISPR/Cas9 vector (Fig. 4A). First, using pooled day 2 genomic DNA as templates, we checked the HDR efficiency and found that expected size of PCR products were detected in the CRISPR/Cas9 introduction conditions (g1, g2, g3) via PCR for 5′ arm check. On the other hand, we could not detect expected size of PCR products in control conditions (TE and TV) (Fig. 4B and C). To analyze colony formation ability, we performed alkaline phosphatase (AP) staining and found that colony formation was indistinguishable regardless of CRISPR condition (Fig. 4D). Thus, these results indicate that each CRISPR/Cas9 design has similar HDR-promoting activity.
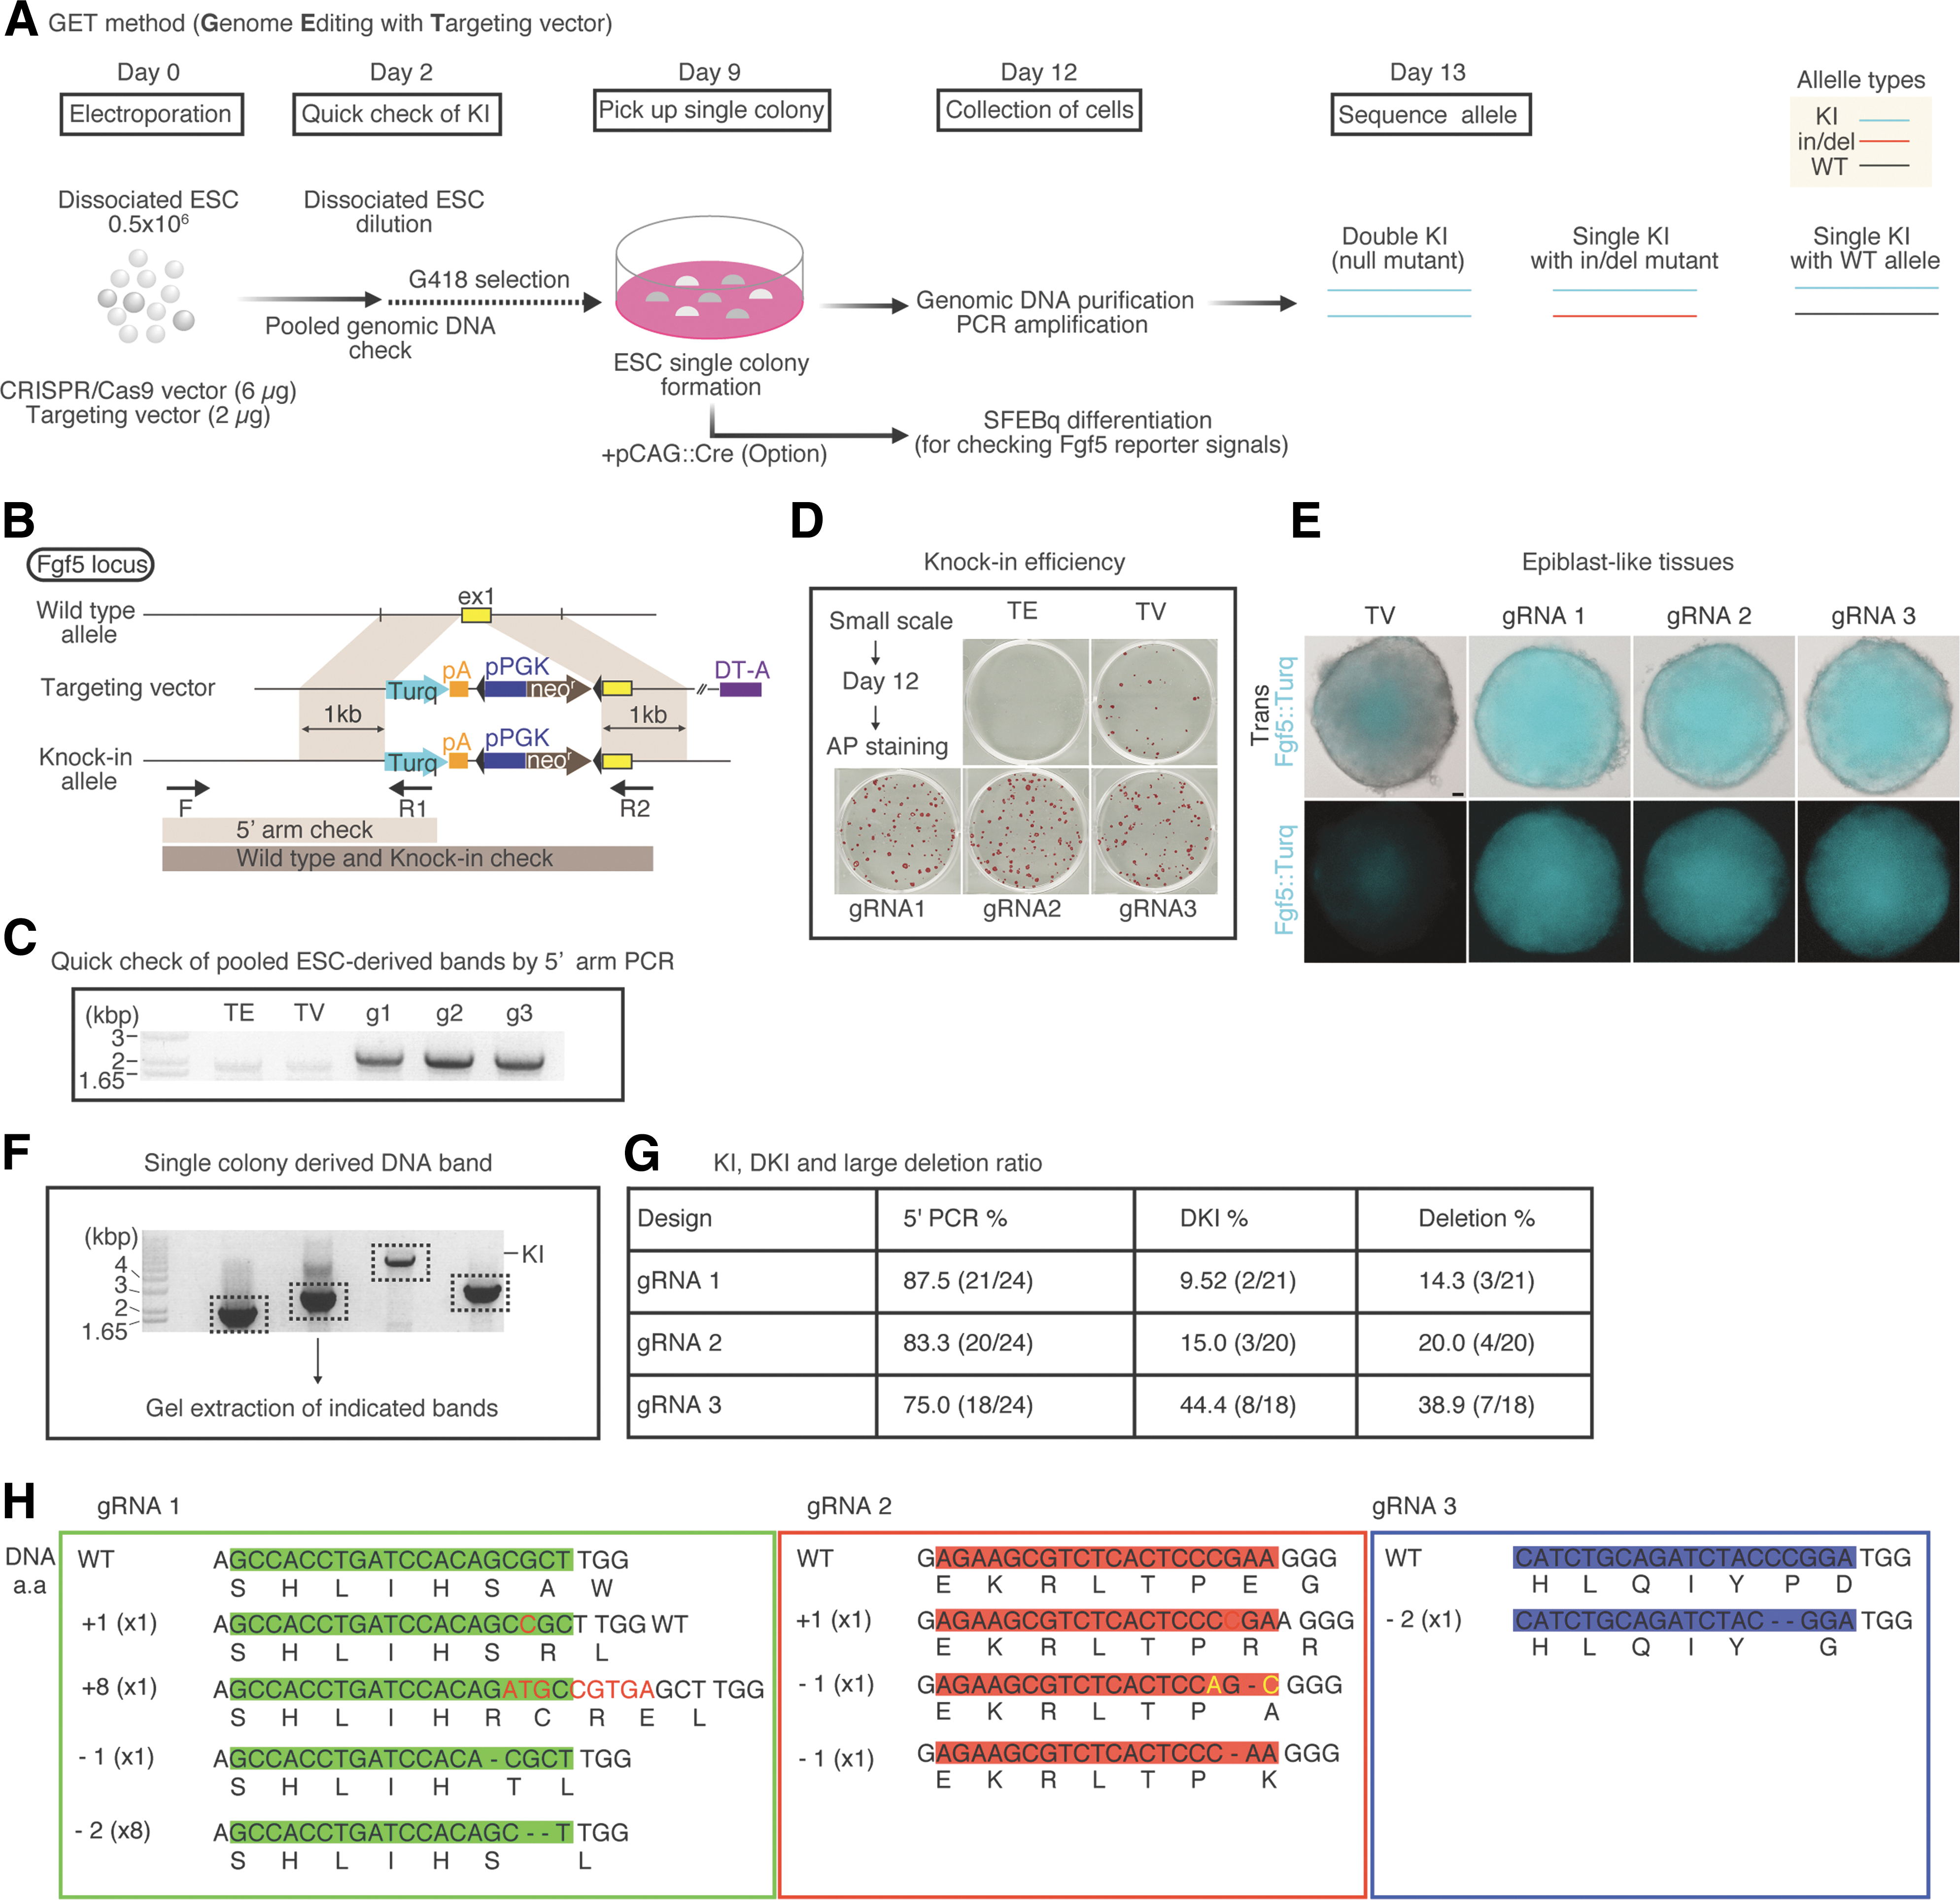
Efficient methods for generating CRISPR-mediated mutant and knockin lines.
We also performed SFEBq, using pooled ESCs to observe Fgf5::mTurquoise2 (Fgf5::Turq) signals after antibiotic selection and introduction of pCAG::Cre for the removal of the antibiotic selection cassette. Day 3 epiblast-like tissues in each condition exhibited Fgf5::Turq signals, reminiscent of E6.5 embryos (Fig. 4E and Fig. 2H). This result may reflect the expression of reporter signals from the CRISPR/Cas9-engineered locus of Fgf5.
Next, we wondered whether cleavage activity differences in each CRISPR design could be observed at the genomic sequence level. To test this, we performed PCR to detect allele-specific bands and analyzed the sequences of single colony-derived genomic DNA (Fig. 4F). Surprisingly, we found that gRNA3 exhibited a single KI band at a high rate and that the rate for each CRISPR design was well correlated with cleavage activity (Fig. 4G; see Fig. 3C for cleavage activity comparison); strong cleavage activity led to double knockins and relatively large deletions. For this reason, when establishing the heterozygous KI line with an intact allele, a weak activity design of CRISPR/Cas9 is preferable.
Next, we extracted bands of PCR products for sequence analysis and found several kinds of mutations, such as insertions and deletions (Fig. 4H). Importantly, we also confirmed that these mutations occurred centrally in each CRISPR target, indicating that each CRISPR/Cas9 targeted each locus specifically. Notably, gRNA3 CRISPR/Cas9 showed relatively larger deletions than the others, indicating that cleavage results closely reflect the activity of CRISPR/Cas9 against specific loci.
Thus, we have successfully established an efficient method, called the GET (Genome Editing with Targeting vector) method, for generating double KIs (null mutants) and single KIs with the wild-type allele or in/del mutants in one experiment.
pdiRNAi mediates depletion of fgf5 in a time- and dose-dependent manner
The elucidation of complex gene expression dynamics, as seen in developing tissue, is not achievable simply by genome-level disruptions. And complete suppression of genes for longer periods via knockout (KO) may result in nonphysiological responses and phenotypes. Indeed, knockout of a gene responsible for early development often leads to a severe defect or lethal phenotype, which prevents us from understanding later functions of the gene. 60 Molecular functions also depend largely on an appropriate concentration, especially regarding growth factors. 61 –63
These issues can be resolved by using an inducible RNAi system, in which tetracycline transcriptional elements are used to induce small RNA (corresponding to the target gene) to disrupt a gene of interest at the mRNA level at a specified time and dose. 64 –67 For this reason, an inducible RNAi system is a powerful tool for investigating gene functions over developmental processes.
A previous report emphasizes the usefulness of nonviral oligonucleotide delivery to organisms because of limitations associated with viral vectors (i.e., broad tropism, limited DNA packaging capacity, and difficulty of virus production). 68 Therefore, in the present study, we designed a new, non-virus-mediated drug inducible RNAi system, called “pdiRNAi.” This system contains four elements: p1, a drug-selectable marker; p2, an shRNA cassette; p3, TetR with a reporter cassette; and p4, Tol2 elements that facilitate transgene–genome integration (Fig. 5A; see Materials and Methods for a description of how these four elements are linked). We established pdiRNAi ESCs in which shRNAs against fgf5 and Escherichia coli lacZ (as a control) were expressed after doxycycline exposure (Fig. 5B–D; see Materials and Methods for details on the purification of the pdiRNAi ESC line). These ESC lines express TagBFP (tet-lacZ-TagBFP), mRFP1 (tet-lacZ-mRFP1), and tdKeima (tet-fgf5-tdKeima), which, when excited by 445-, 561-, and 488-nm lasers, produce detectable fluorescent signals under live conditions (Fig. 5E). In addition, tdKeima is beneficial for dual-color imaging as green fluorescent protein/yellow fluorescent protein (GFP/YFP) can be excited with a 488-nm laser at the same time. 69
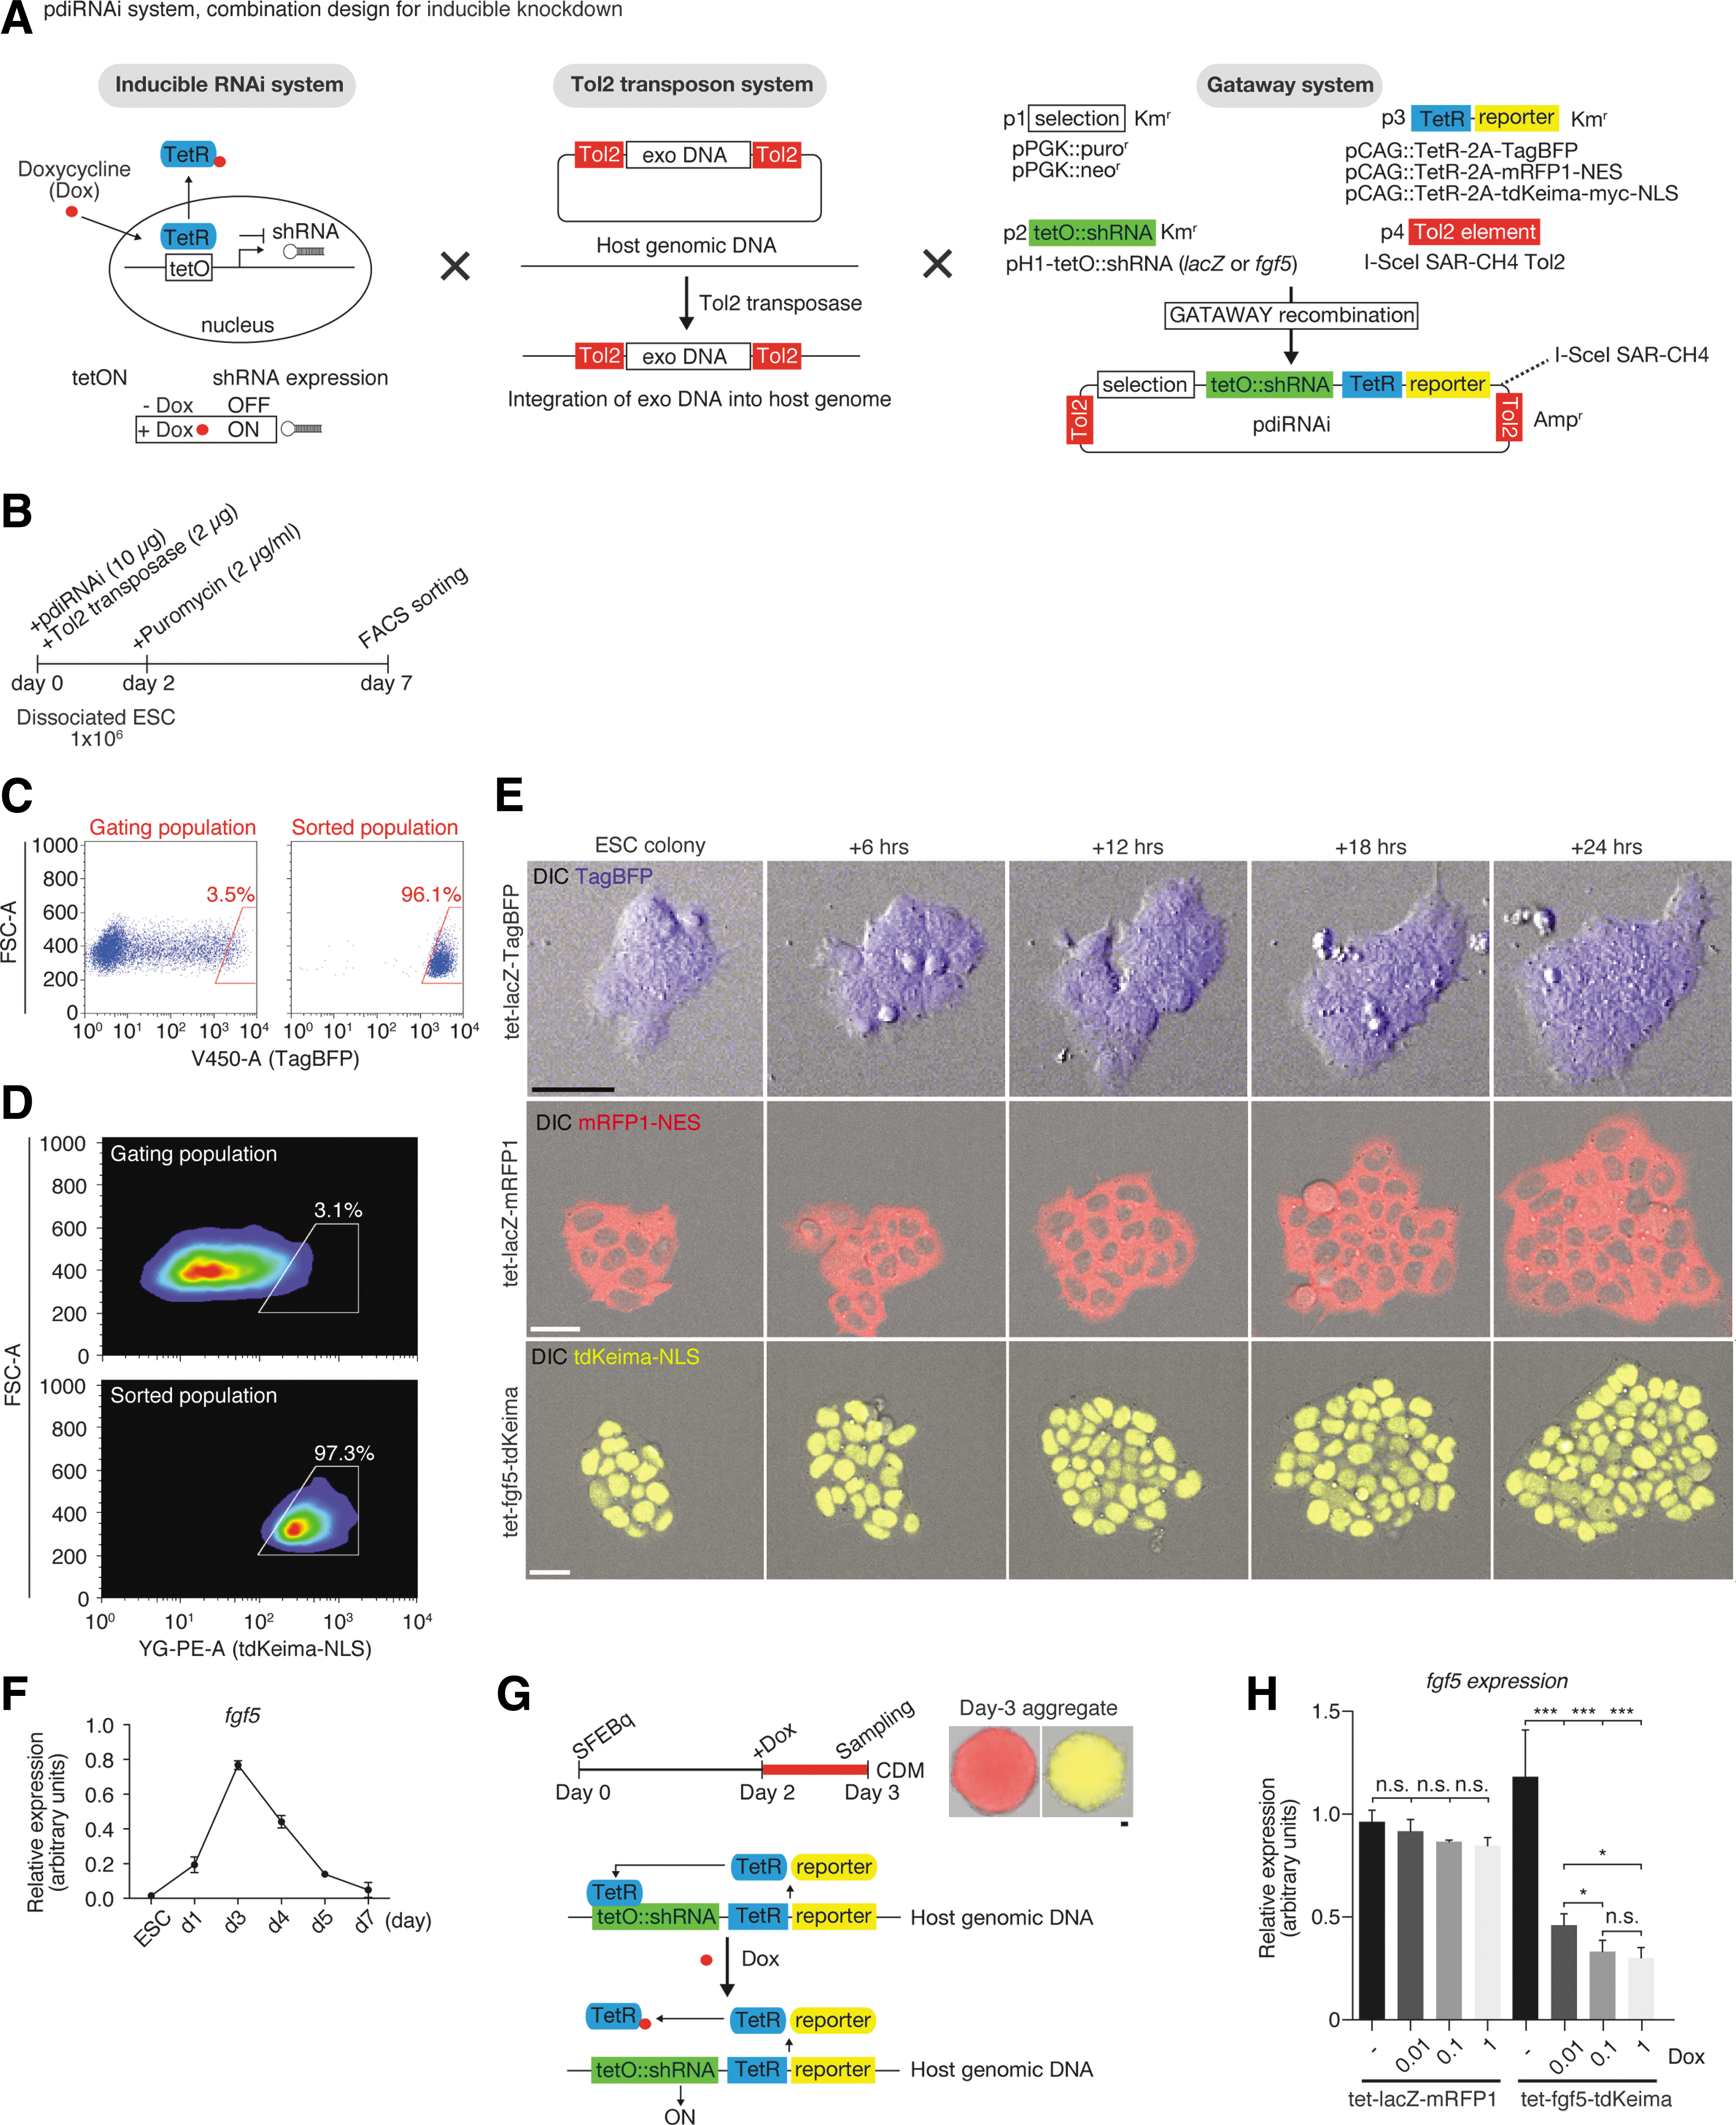
pdiRNAi-mediated depletion of fgf5 gene in a time- and dose-dependent manner.
Before performing RNAi experiments, we endeavored to identify the best time to manipulate fgf5. Time course analysis via RT-qPCR showed that fgf5 expression begins to increase from day 1 and then decreases from day 3 (Fig. 5F), suggesting that this dynamic pattern of fgf5 expression may be involved in regulation of tissue development. We next tested treatment with various concentrations of doxycycline on day 2 for 24 hr and collected samples on day 3 for RT-qPCR analysis (Fig. 5G). The addition of doxycycline was found to specifically and significantly deplete fgf5 expression in a concentration-dependent manner (Fig. 5H). In contrast, no significant impact was observed on fgf5 gene expression in lacZ control cells (Fig. 5H).
In summary, to understand tissue and organ development, observation and manipulation of 3-D tissue formation are quite important. 57 Thus, we generated 3-D epiblast-like tissue in vitro, which is reminiscent of in vivo epiblast, and based on microarray analysis, examined its characteristics from aspects such as apicobasal polarity and gene profiles. Furthermore, from self-organizing epiblast tissues, we revealed novel pathways, such as Erk/Mapk and ILK signaling, and gene groups involved in ectoderm/epithelial formation, shedding light on the foremost epithelial formation. Although it is necessary to further analyze the roles of Fgf5 in epiblast development by comparing it with discovered gene sets, these candidate data sets indicate the importance of analyzing biological properties of pluripotent epiblast tissues during early development (Fig. 6).
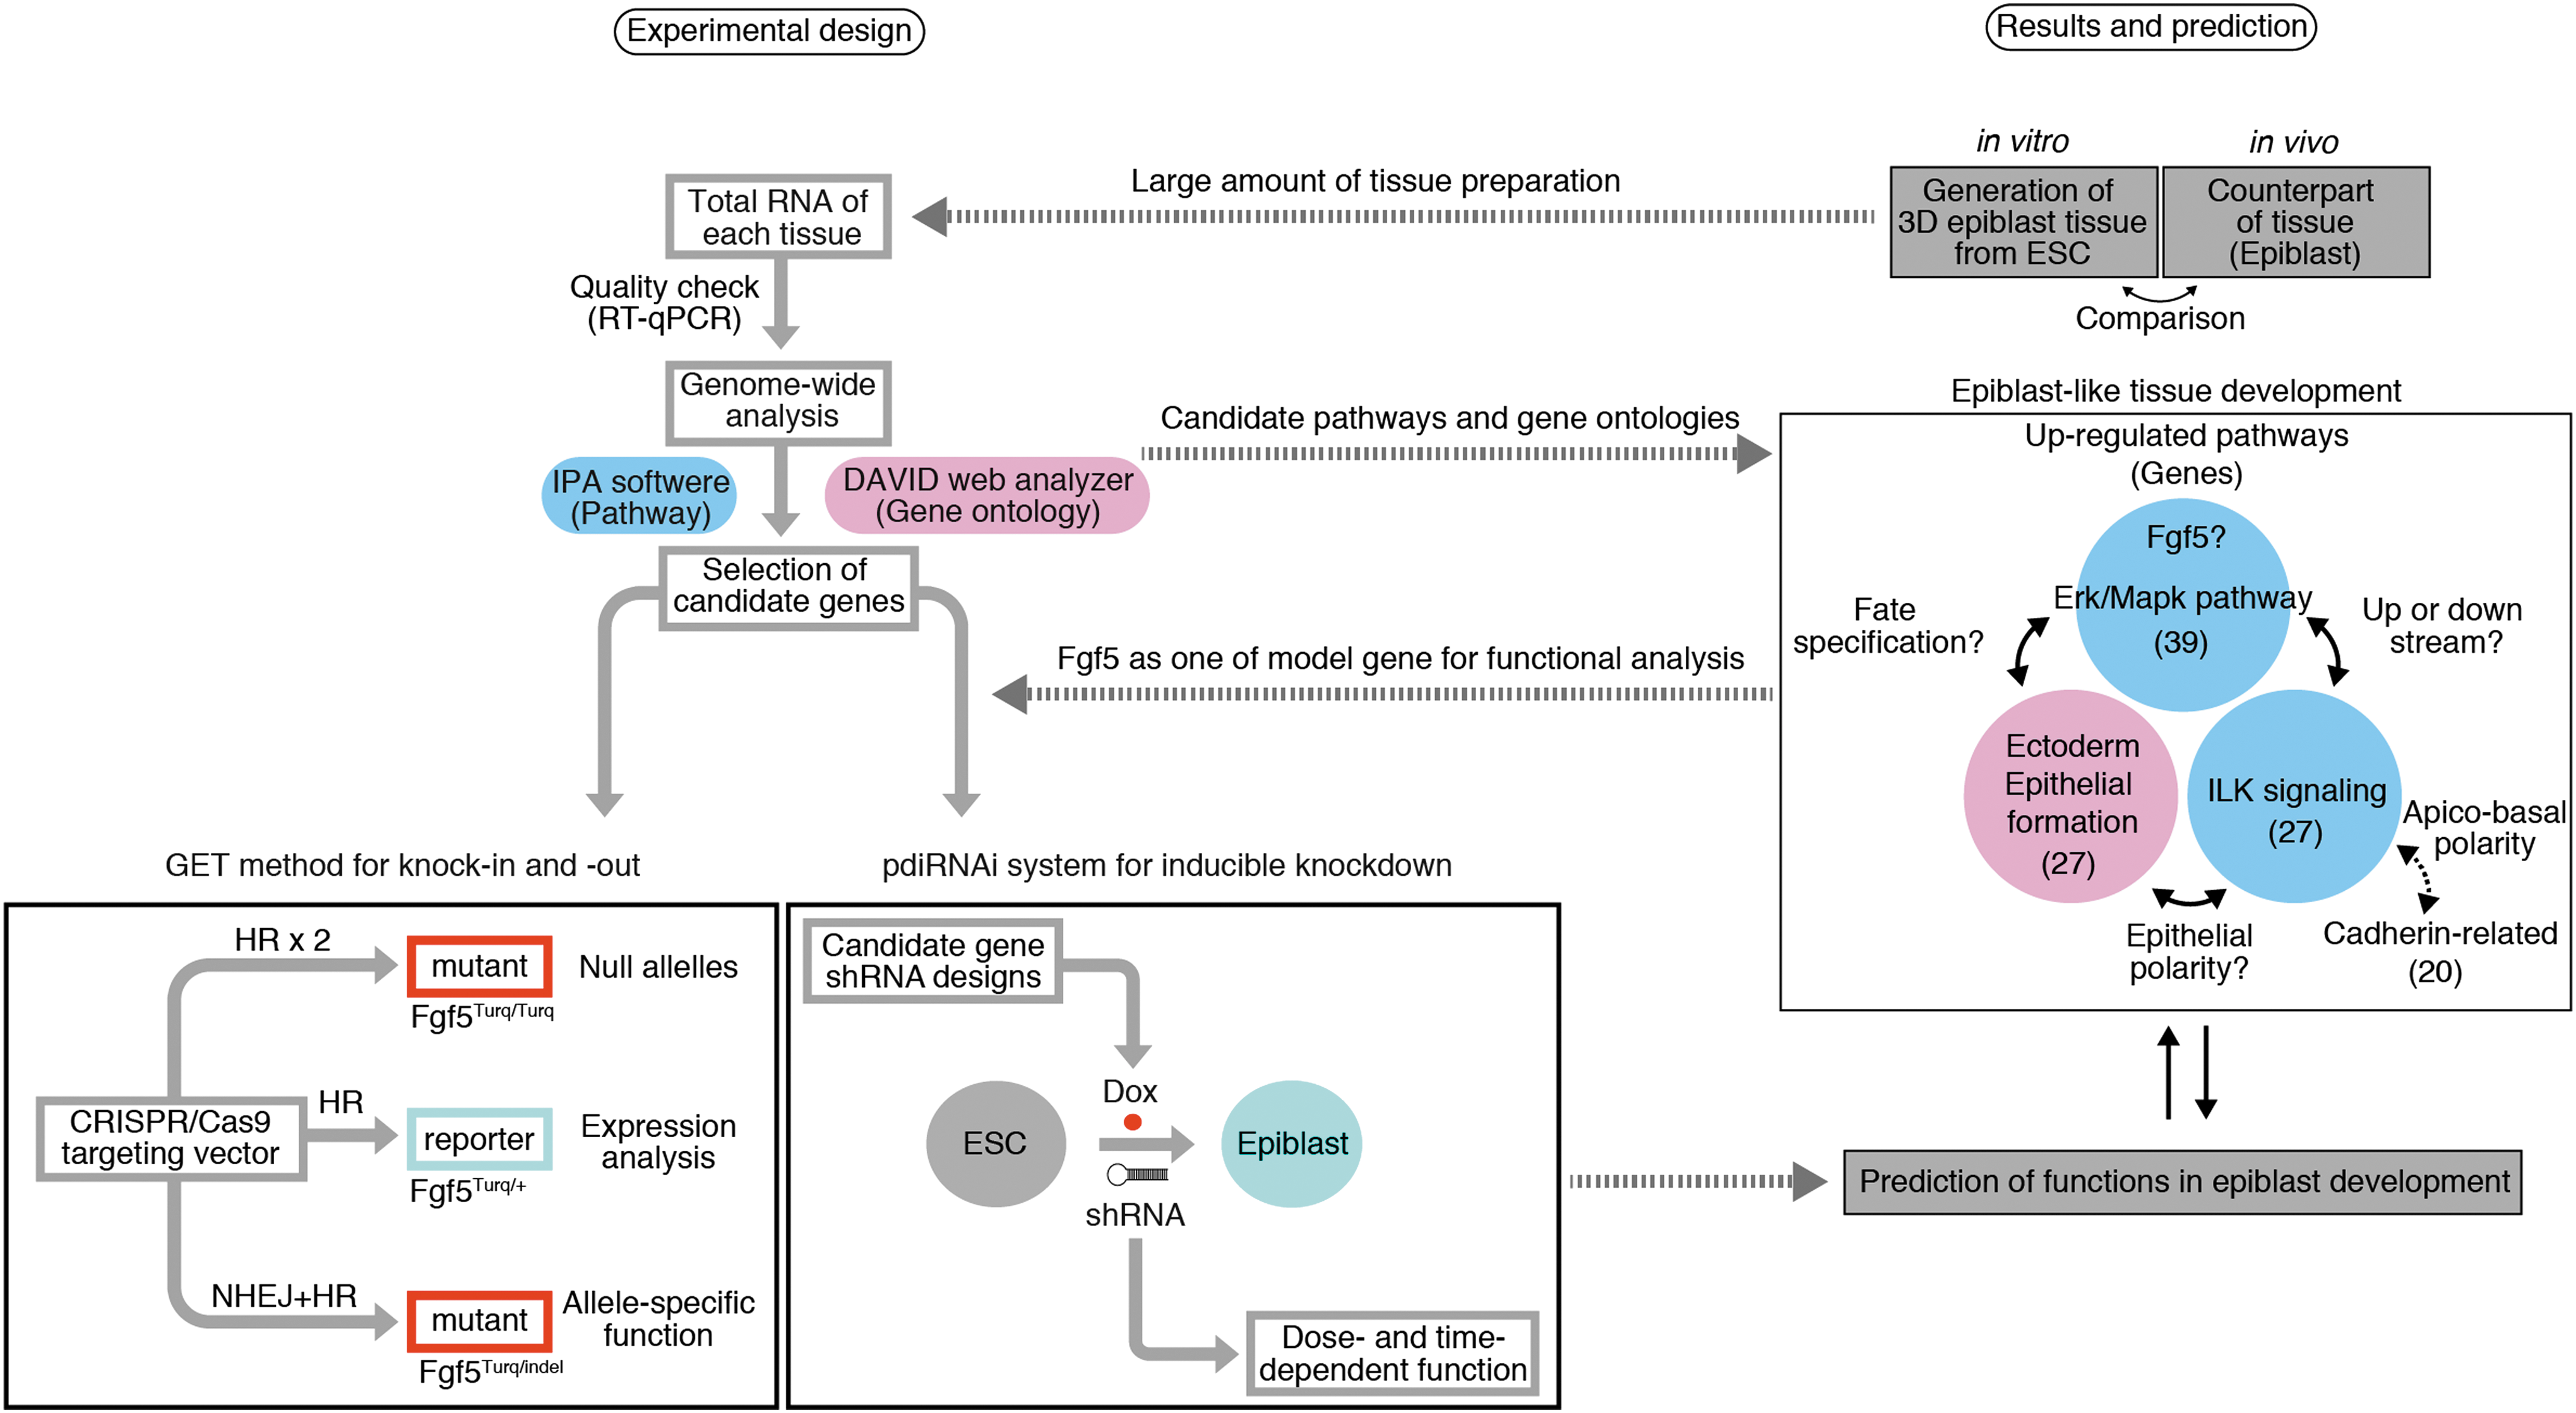
Overview of strategies of experimental design and gene prediction using knockdown, knockin, and knockout in an interactive way.
Overall, as researchers aim increasingly to understand key properties of biological systems, combinational and interactive strategies to analyze gene expression and functions during development in an efficient manner become essential. Importantly, two-dimensional (2D) culture systems (adhesion culture) differ from 3-D systems, 70 in that in 2D systems it is difficult to observe the architecture of epithelium such as in vivo epithelium. In future studies, a more in-depth analysis of 3-D aspects of target tissues, using the GET method and pdiRNAi system, will be required. Although elucidation of causal relationships between the discovered gene sets (Fgf/Erk and ILK signaling, and ectoderm/epithelial formation regarding apicobasal polarity) needs further examination, here we provide a framework for systematic approaches to gene discovery, using 3-D developing tissue in vitro (Fig. 6).
Footnotes
Acknowledgments
The authors are grateful to M. Eiraku and H. Hiraga for invaluable comments and to members of the laboratory for discussion. The authors also thank T. Nakamura and T. Watanabe for help and discussion regarding genome editing; M. Kawada for technical advice on SFEBq and knockin vector construction; M. Ohgushi for technical advice on FACS; and H. Miyoshi, A. Miyawaki, and N. Love for kindly donating vectors. This work was supported by grants-in-aid from the Ministry of Education, Culture, Sports, Science, and Technology in Japan (MEXT) (to Y.S.), and the Network Program for Realization of Regenerative Medicine from the Japan Science and Technology Agency (JST) (to Y.S.).
Author Contributions
N.T. designed the research; N.T. and E.S. performed the experiments; N.T. and T.K. analyzed the micro array data; T.S. and T.Y. provided strong support for technical information on genome editing; N.T. prepared the figures; N.T. wrote the paper. T.S., T.Y., and Y.S. supervised the projects.
Author Disclosure
No competing financial interests exist.
References
Supplementary Material
Please find the following supplemental material available below.
For Open Access articles published under a Creative Commons License, all supplemental material carries the same license as the article it is associated with.
For non-Open Access articles published, all supplemental material carries a non-exclusive license, and permission requests for re-use of supplemental material or any part of supplemental material shall be sent directly to the copyright owner as specified in the copyright notice associated with the article.