
Abstract
Customizable endonucleases such as transcription activator-like effector nucleases (TALENs) and clustered regularly interspaced short palindromic repeats/CRISPR-associated protein 9 (CRISPR/Cas9) enable rapid generation of mutant strains at genomic loci of interest in animal models and cell lines. With the accelerated pace of generating mutant alleles, genotyping has become a rate-limiting step to understanding the effects of genetic perturbation. Unless mutated alleles result in distinct morphological phenotypes, mutant strains need to be genotyped using standard methods in molecular biology. Classic restriction fragment length polymorphism (RFLP) or sequencing is labor-intensive and expensive. Although simpler than RFLP, current versions of allele-specific PCR may still require post-polymerase chain reaction (PCR) handling such as sequencing, or they are more expensive if allele-specific fluorescent probes are used. Commercial genotyping solutions can take weeks from assay design to result, and are often more expensive than assembling reactions in-house. Key components of commercial assay systems are often proprietary, which limits further customization. Therefore, we developed a one-step open-source genotyping method based on quantitative PCR. The allele-specific qPCR (ASQ) does not require post-PCR processing and can genotype germline mutants through either threshold cycle (Ct) or end-point fluorescence reading. ASQ utilizes allele-specific primers, a locus-specific reverse primer, universal fluorescent probes and quenchers, and hot start DNA polymerase. Individual laboratories can further optimize this open-source system as we completely disclose the sequences, reagents, and thermal cycling protocol. We have tested the ASQ protocol to genotype alleles in five different genes. ASQ showed a 98–100% concordance in genotype scoring with RFLP or Sanger sequencing outcomes. ASQ is time-saving because a single qPCR without post-PCR handling suffices to score genotypes. ASQ is cost-effective because universal fluorescent probes negate the necessity of designing expensive probes for each locus.
Introduction
T
In most cases, targetable endonucleases generate small insertions and deletions (indels) as the majority of DNA lesions are repaired through the error-prone repair pathway, nonhomologous end joining (NHEJ) (reviewed in refs. 9 –13 ). Unless mutated alleles result in distinct morphological phenotypes, mutant strains have to be genotyped using standard methods in molecular biology. Classically, polymerase chain reaction–restriction fragment length polymorphism (PCR–RFLP) has been a standard procedure for scoring genotypes. 14 –18 However, it is a labor-intensive multistep process that includes PCR and size differentiation after restriction endonuclease digestion. RFLP depends on the presence of restriction sites, and is expensive, low-throughput, and prone to human errors in a large-scale application. Ever since the development in 1989 by Newton and colleagues, amplification refractory mutation system (ARMS), also commonly known as allele-specific PCR (ASPCR) or PCR amplification of specific alleles (PASA), has been used in research and clinical settings as an alternative to RFLP and resulted in multiple modified varieties. 19 –22 Although simpler than RFLP, early generations of ARMS required two PCRs for each allele with post-PCR processing such as gel electrophoresis or sequencing. 23 Other variants that enabled a single-tube reaction needed post-PCR handling such as sequencing. 24,25
Other methods use special synthetic DNA oligonucleotides (primers) with a modified ribose backbone, 26,27 locus-specific fluorescent probes, 28,29 or specific instrumentation to analyze the outcomes. 30 Myakishev et al. made a significant breakthrough by introducing a single PCR ARMS without post-PCR handling using universal fluorescent probes. 31 However, their hairpin loop-based probe structure is so highly temperature sensitive that fluorescence intensity needs to be read at a lower temperature compared with our allele-specific qPCR (ASQ) system (room temperature vs. 45°C). In addition, the hairpin loop-based probe requires an internal dabcyl quencher and customized probe synthesis, which makes it difficult to find a vendor that provides the custom design option. Commercial solutions are more expensive than assembling reactions in-house and can take more time because of assay development and optimization necessary per use of service. Key components of many commercial assay systems are proprietary, which limits the potential for independent optimization of assays as needed for individual projects.
Therefore, we developed a versatile open-source genotyping method based on qPCR. ASQ utilizes allele-specific primers (ASPs), a locus-specific reverse primer, universal fluorescent probes and quenchers, and hot start DNA polymerase. Genotype outcomes from ASQ can be analyzed by either threshold cycle (Ct) method in a qPCR machine or end-point fluorescence reading in a plate reader after regular PCR. With this versatility, ASQ may prove to be the method of choice for rapid, accurate, and cost-effective genotyping.
Materials and Methods
Materials and instruments
All the reagents and instruments used in our experiments are listed in Supplementary Table S1 (Supplementary Data are available online at
Software
Nucleotide sequences were reviewed with Sequencher (ver. 5.3; Gene Codes Corporation, Ann Arbor, MI). The determination of annealing temperatures of the primers was based on SnapGene (ver. 2.8.2; GSL Biotech LLC, Chicago, IL). Potential secondary structures, including hairpin, self-dimers, and heterodimers of oligo nucleotides, were reviewed with OligoAnalyzer (ver. 3.1; IDT Inc., Coralville, IA). Nonspecific amplification of fluorescent probes and primers was reviewed with Primer-BLAST (National Center for Biotechnology Information, Bethesda, MD). Fluorescence and Ct (threshold cycle) values were quantified and converted to raw data with CFX Manager (Bio-Rad Laboratories, Inc., Hercules, CA).
Zebrafish handling and strains
All zebrafish strains were maintained and handled following standard practices 32 and guidelines from the Institutional Animal Care and Use Committee (IACUC) in Mayo Clinic. myo7aa strain was provided by the Nicolson laboratory. 33 All other strains were made in our laboratory using TALENs targeting the gene of interest (nr3c1, nod2, mc2r, and il-6). The GoldyTALEN scaffolding was used to construct TALENs. 34
Genomic DNA preparation
An established hot sodium hydroxide (NaOH) DNA extraction method was used. 35 –37 The hot NaOH DNA extraction allowed a rapid preparation of DNA in 1 hr without additional purification. Although it was a crude preparation, the DNA preparation could be directly used in downstream experiments such as PCR after neutralizing NaOH with 1/10 volume of 1 M Tris buffer (pH 8). An individual larval zebrafish (5 days postfertilization [dpf]) was incubated in 20 μl of 50 mM NaOH (95°C, 90 rpm) for 25 min followed by neutralization with 2 μl of 1 M Tris (pH 8). The crude DNA preparation can be stored at −20°C for an extended period of time (e.g., 2 years).
Primers for sequencing the target loci
The locus of interest was PCR-amplified and sequenced by the Sequencing Core of the Medical Genome Facility at Mayo Clinic to determine the sequences of WT and mutant alleles of each locus (Supplementary Table S2). The following PCR primers were used: nr3c1 (F 5′-CTCTCCTTTCAGAGCTGCCGACAA, R 5′-ACATTACACGAACATCGCATTCACC); nod2 (F 5′-GTATTTACTGCATTTAACAGGG, R 5′-CCTCCAGCCCTAATGTTG); mc2r (F 5′-CTGAATCTCCCTCCAGCATCCACA, R 5′-CTGCCTCAAAAAAGCCGACCATTAG); myo7aa (F 5′-TCACGTCTGCAGGCGCTATATAG, R 5′-CTCCTTTGAGTCGTTTGTAGAGCC); il-6 (F 5′-CCATCCGCTCAGAGTAAGTG, R 5′-AACATTTCCGAGTTACTACAGG). Either forward or reverse PCR primer was used as a sequencing primer.
Fluorescent probes and quenchers
The design of fluorescent probe and quencher sequences are described in the Results section. The fluorescent probes and quenchers were ordered from Integrated DNA Technology (IDT). The fluorescent probes were conjugated with either 6-fluorescein phosphoramidite (6-FAM) or 6-hexachloro-fluorescein phosphoramidite (HEX) at the 5′ end of the oligonucleotide (Table 1). Both quenchers were conjugated with Black Hole Quencher 1 at the 3′ end. While the sequence of each quencher was complementary to the corresponding FAM or HEX probe, the quenchers were shorter in nucleotide length (16 nt) than were the probes (23 nt). A 400 μM stock of each probe and quencher was prepared by dissolving each in STE buffer (10 mM Tris pH 8, 50 mM NaCl, and 1 mM EDTA). A 50 μM of working stock of all four probes and quenchers was used for assays. The working stock was heated to 95°C for 5 min, gradually cooled by leaving it at room temperature, letting them form a stable dimerized species, and aliquoted in 21 μl. The probes and quenchers were stored at −20°C (stable for at least 1 year).
Fluorescent probes, quenchers, allele-specific primers, and locus-specific primers
ASQ, allele-specific qPCR; WT, wild type.
Sequences identical to a fluorescent probe are italicized (FAM or HEX). The allele-specific region of ASQ primers is
T m is reported based on the calculation by SnapGene. The T m of allele-specific primers only regard the allele-specific region of the primers.
Allele-specific primers for nr3c1 and myo7aa were designed on (−) strain (reverse direction based on the gene's orientation) and the locus-specific primer was designed on (+) strain (forward direction based on the gene's orientation).
Allele-specific primers for il-6 were designed to contain a mismatch at the penultimate sequence (marked as a lower case “t”). The original nucleotide without mismatch is “C” at the penultimate place.
Allele-specific primers and locus-specific common primers
ASPs were designed based on wild-type or mutant sequences obtained from Sanger sequencing of the locus of interest. The 3′-end terminated at the SNP base or after extending one or more nucleotides (1–5 nt) into unique sequences of a WT or mutant indel allele to differentiate wild-type from mutant alleles (Table 1). The remaining allele-specific region of ASPs was selected to obtain a melting temperature close to 58°C ranging from 57°C to 59°C. The designed sequences of the allele-specific region were analyzed for hairpin structure formation, self-dimerization, and heterodimerization using oligo analysis software (e.g., Oligo Analyzer 3.1). If stable hairpin or dimer products were detected, a few bases were added or removed to the 5′-end of the allele-specific region according to the genomic sequences. If this did not result in an optimal design, the direction of the ASPs was reversed. For example, if the initial primer design was attempted along the (+) strain, a (−) strain direction was tried and a reverse primer was designed at the upstream accordingly. Once the allele-specific region was designed, a 5′-tail sequence, which was identical to either FAM or HEX fluorescent probe sequence, was added to the 5′-end of the allele-specific sequences. This combined whole primer sequence was re-analyzed for hairpin, self-dimerization, and heterodimerization.
Quantitative PCR
The total reaction was 10 μl containing ASPs (50 nM each), a reverse primer (500 nM), fluorescent probes (500 nM each), quenchers (500 nM each), 5× MyTaq Reaction Buffer Colorless (1×, final concentration), MyTaq HS DNA polymerase (0.5 units), and distilled water (q.s.) (Table 2). The thermal cycling for Ct value-based genotyping was as follows: 95°C 3 min +12× [95°C 15 s + 57.5°C (an optimal annealing temp) 15 s + 72°C 60 s] +25× [95°C 15 s + 62°C 15 s + 72°C 60 s + 45°C 5 s + plate reading] (Table 3). For end-point fluorescence reading, the thermal cycling was as follows: 95°C 3 min +12× [95°C 15 s + 57.5°C (an optimal annealing temp) 15 s + 72°C 60 s] + (18–27)× [95°C 10 s + 62°C 10 s + 72°C 60 s] +45°C 5 s + plate reading.
ASQ reaction
ASQ thermal cycling
The number of thermal cycles in tiers 1 and 2 needs to be optimized based on the quality of amplification at each locus and the specificity of the primers for the locus. Twelve times for tier 1 and 25 times for tier 2 are good starting points. The tier 1 cycling may vary between 10 and 14 times and the tier 2 may range from 22 to 35 times.
qPCR data analysis
Threshold values for FAM and HEX signals were set at a point during the exponential amplification phase of the qPCR using CFX Manager software (Bio-Rad) provided with a qPCR machine. Taking advantage of generic software provided with a qPCR machine, we used an allele discrimination plot automatically constructed by CFX Manager. We did not perform any extra treatment to construct the plot in this article. Although the user interface might be slightly different, basic visual presentation tools for allele discrimination in most qPCR machines and plate readers can be adapted for this analysis.
Results
Design of the ASQ system
Fluorescent probes
ASQ utilizes two pairs of universal fluorescent probes and quenchers that need not be redesigned for each locus in any animal model and cell culture (Table 1). At the 5′ end, one probe is conjugated with 6-fluorescein phosphoramidite (6-FAM) and the other with 6-hexachloro-fluorescein phosphoramidite (HEX). We chose the organic fluorophores (6-FAM and HEX) because of their minimal overlap in signal and ubiquitous commercial availability. The nucleotide sequences of each probe were originally designed and used for Rapid Amplification of cDNA Ends (RACE) PCR in a number of our projects since the late 1990s. 38 The sequences were designed to have minimal self-dimerization, heterodimerization, and hairpin structure, which was confirmed using Oligo Analyzer Version 3.1 (Integrated DNA Technologies, IDT). We verified that the probe sequences did not result in any nonspecific amplification against reference genomes of prokaryotes, eukaryotes, and viruses using Primer-BLAST (National Center for Biotechnology Information, NCBI). The probes were further validated against primary chromosome assemblies for selected organisms, including bee, cattle, chimpanzee, dog, fruit fly, horse, human, mouse, rat, and zebrafish, in the same manner. Nonspecific amplifications were not predicted in any of the blast results. Thus, our probe sequences may be safely applied in diverse model systems without further modification.
Quenchers
To increase signal-to-noise ratios and eliminate nonspecific fluorescent signals, an effective quenching system is essential. The fluorescent quenchers in ASQ are complementary sequences to the fluorescent probes and conjugated to 3′ Black Hole Quencher (Biosearch Technologies, Inc.). To enable an efficient amplification, the quenchers are shorter and have a lower melting temperature (16 nt, 52°C) than are the probes (23 nt, 62°C) (Table 1). Because of the lower melting temperature, the quenchers interfere less with the annealing of ASPs or fluorescent probes to the genomic DNA at the annealing steps (57.5°C or 62°C) (Table 2). When we tested the quenchers with the same melting temperature as that of the probes, we could not obtain the target PCR amplification products, demonstrating that the size of the quencher is an important factor that determines efficiency of an ASQ reaction.
Allele-specific primers
Allele specificity is achieved by ASPs. ASPs comprise two sequence domains. The 5′-domain contains the same sequence as one of the probes (FAM or HEX) and the 3′-domain contains allele-specific sequences (Fig. 1; Table 1). During the initial stages of amplification, the allele-specific sequences of the ASPs bind to genomic DNA and drive the amplification with the locus-specific reverse primer (reverse primer) (Fig. 1). During this early amplification, complementary sequences to the fluorescent probes are generated. Using this complementary sequence, the fluorescent probes and the reverse primer can now drive the amplification. Because the complementary sequence is allele-specifically generated based on ASPs, the amplification by the fluorescent probes and reverse primer lead to allele-specific fluorescent signals.
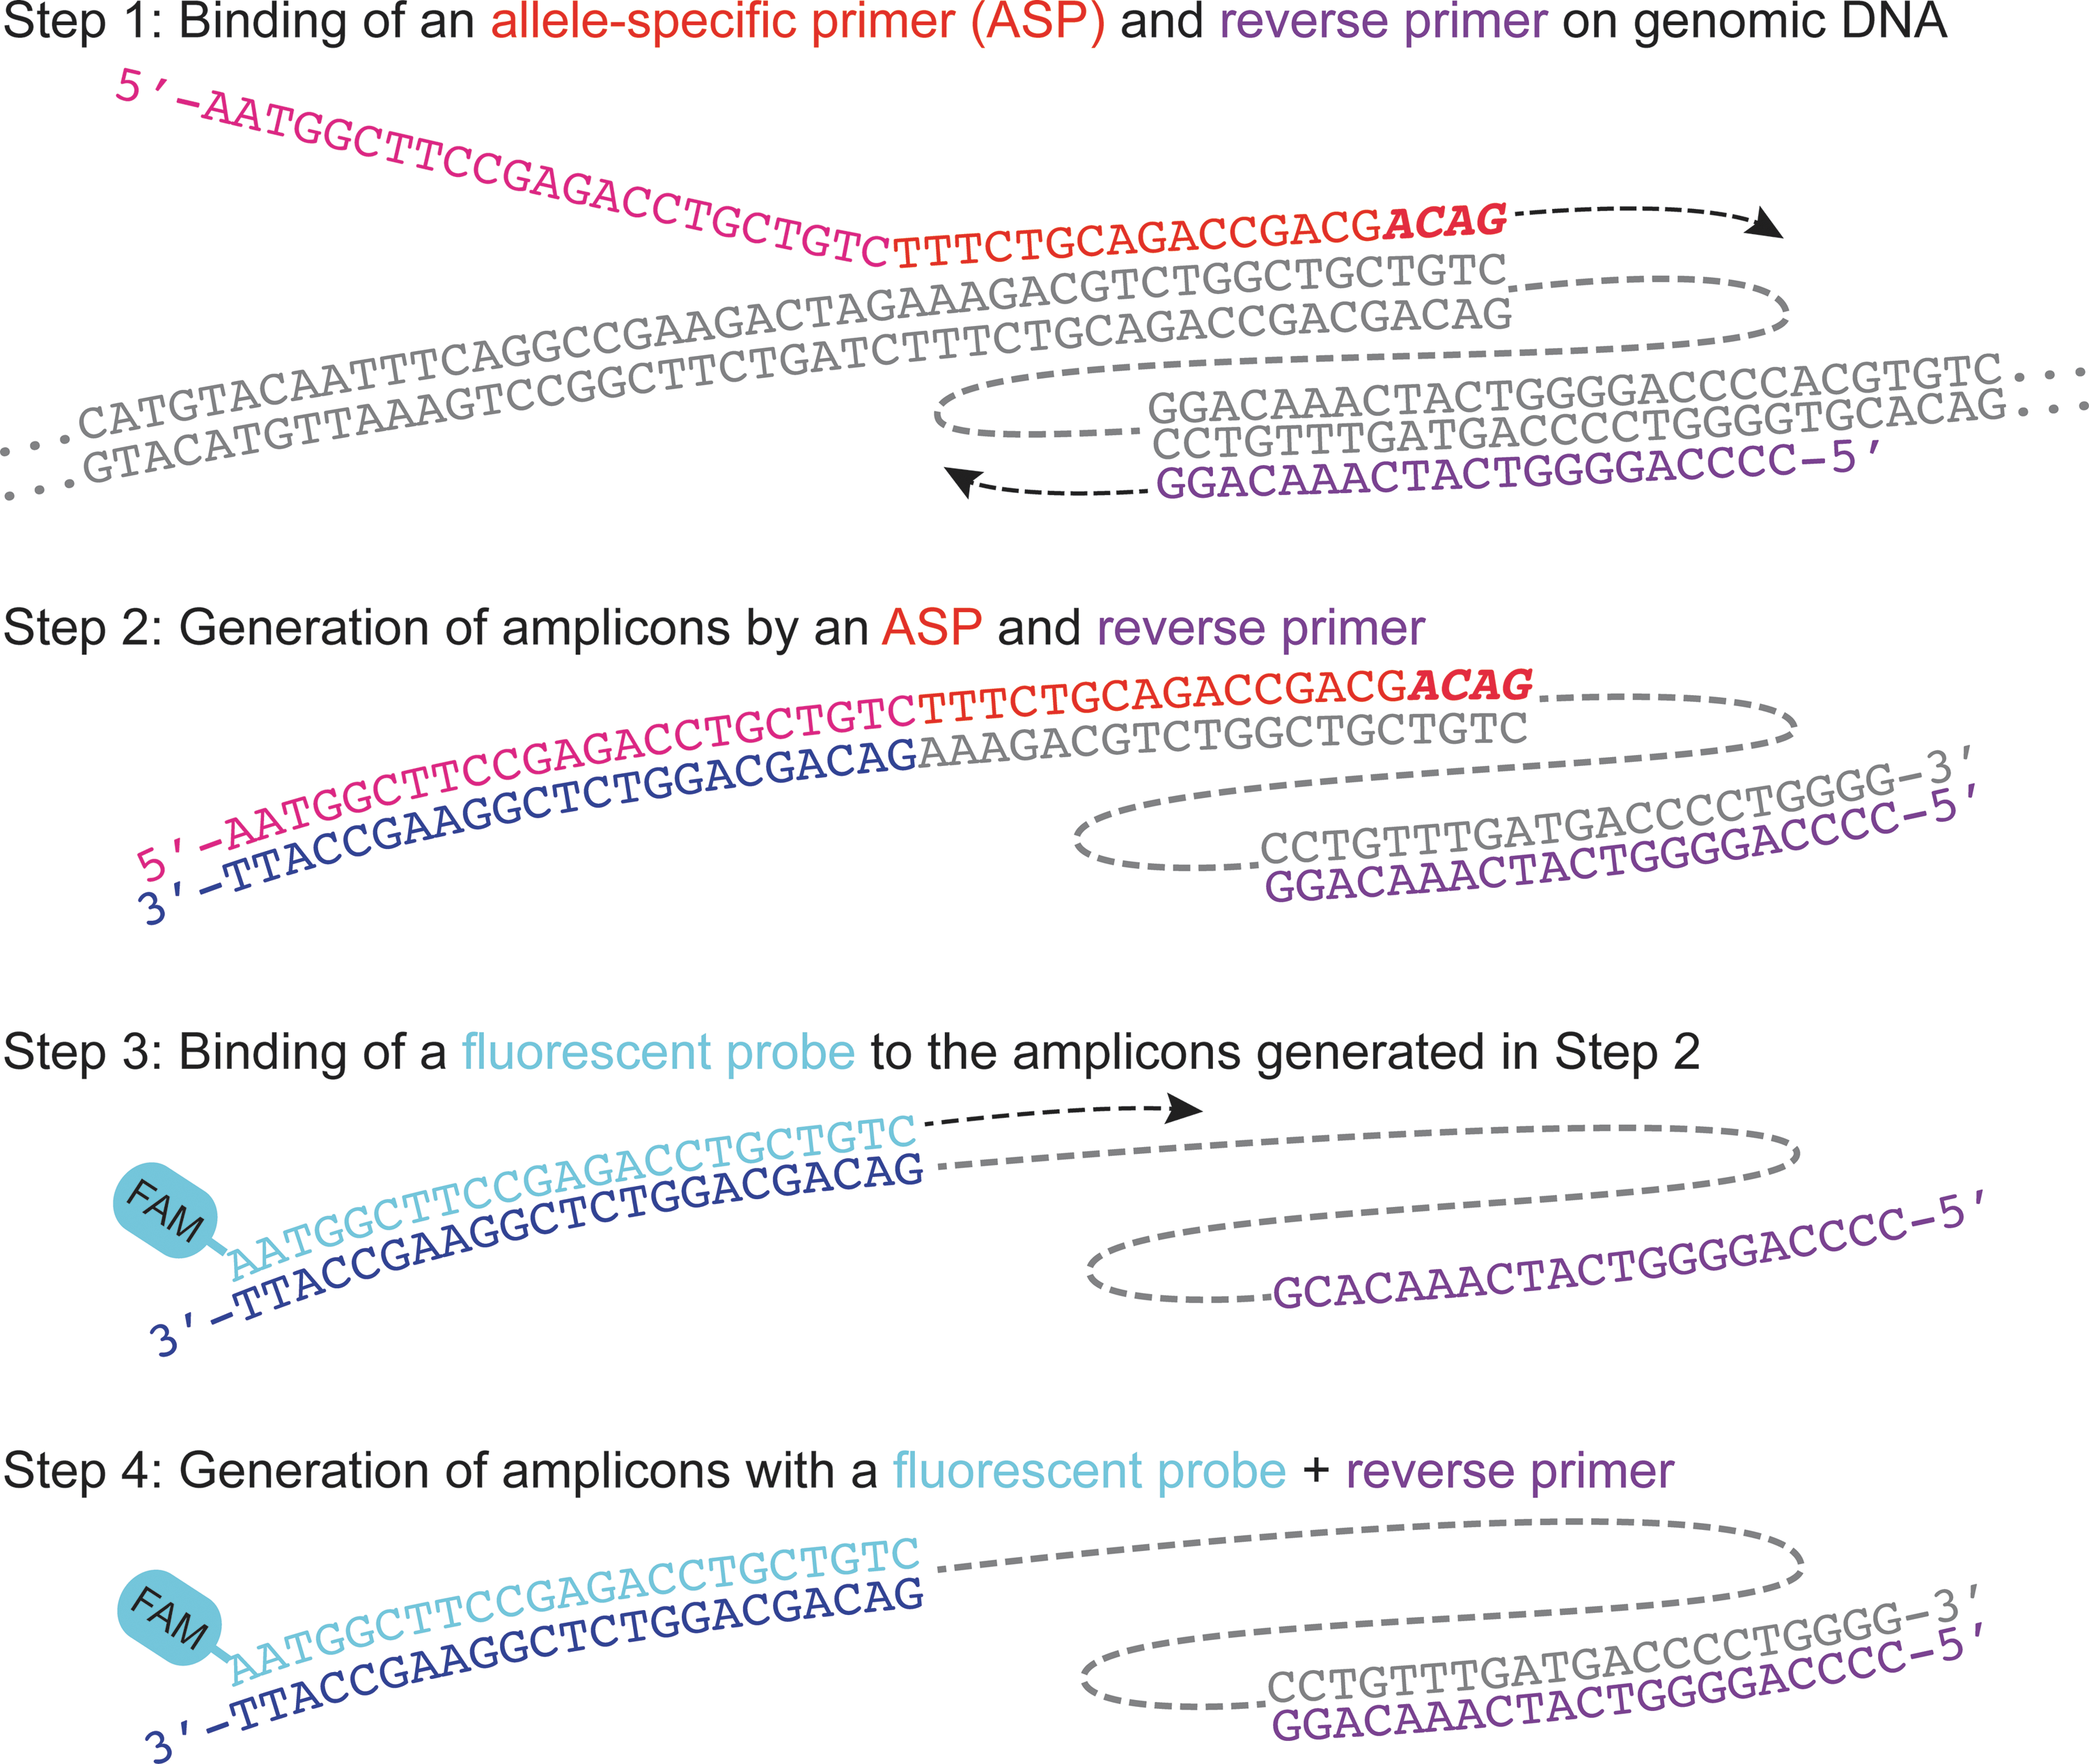
The mechanism of allele-specific qPCR (ASQ). The allele-specific region (red) of the allele-specific primers (pink and red) and a locus-specific reverse primer (purple) bind the target sequence in the genomic DNA (gray) (Step 1). Subsequent amplification results in the generation of amplicons that contain the complementary sequence (navy blue) to the fluorescent probe (Step 2). The fluorescent probe (sky blue) binds the complementary sequence (navy blue) (Step 3) and drives the amplification (Step 4). This amplification in Step 4 generates the fluorescence signals.
Improved signal generation and specificity results in part because of differences in the annealing temperature and molarity between ASPs and fluorescent probes (Table 2). The annealing temperature of the ASPs' allele-specific region is 57.5°C, whereas that of the probes is 62°C. The number of ASP molecules is 0.5 pmol in 10 μl (50 nM), whereas the amount of fluorescent probe molecules is 5 pmol in 10 μl (500 nM) (Table 2). The higher melting temperature and concentrations appear to give a competitive edge to fluorescent probes favoring the generation of desired fluorescent signals over allele-specific primer-based amplicons.
Optimization of the ASQ system
Thermal cycling and fluorescence quantification
Thermal cycling for ASQ uses two tiers with distinct annealing temperatures. During the initial cycling series (Tier 1), amplification from the allele-specific region of ASPs is achieved by using a lower annealing temperature (57.5°C) (Fig. 1; Table 3). In the later cycling series (Tier 2), amplification from the fluorescent probes is favored by using a higher annealing temperature (62°C), yet this probably does not completely exclude the allele-specific primer-based amplification. A method to quantify relative fluorescence intensity can be chosen depending on instruments available in a laboratory. A qPCR machine with FAM and HEX fluorescence filters allows a Ct (threshold cycle) value-based allele determination. With the Ct-value-based method, a plate of PCRs is read at each cycle during the second-tier cycling. A regular PCR machine and plate reader with FAM and HEX filters can be used for end-point fluorescence reading. With this method, a plate is read only once after PCR is completed. An optimal number of second-tier cycles needs to be empirically determined.
Graphic analysis of fluorescence values
Once fluorescence values are acquired, each genotype (wild-type [wt], heterozygous [het], or homozygous [hom]) distinctively clusters on a graphic allele-discrimination plot that is constructed with generic qPCR machine or plate reader software (Figs. 2A and 3A). The genotype clusters are tighter and more distinctive, or looser and less distinctive depending on the specificity of ASPs at the target locus, optimization of the annealing temperature in the first-tier amplification, and number of cycles in the second-tier amplification. Once these conditions are optimized, the signals are clearly differentiated from nonspecific fluorescent signals. There are several important controls that assist in data analysis and optimization. Two or three no-template controls (NTCs) form a cluster near the origin, providing the baseline fluorescence values to normalize sample values with (Figs. 2A and 3A). As a positive control, a serial dilution of a DNA sample with a known genotype (wt, het, or hom) is used. We employ a 3× serial dilution of wild-type genomic DNA (1-, 3-, 9-, 27-, 81-, and 243-fold dilution). As the DNA becomes too dilute, the samples cannot be properly scored. For example, we observed two other unscored data points (black diamond) on the graph (Fig. 2A), which were the two most diluted control samples (81- and 243-fold dilution). When DNA templates were not provided (NTCs) or DNA was present at a very low concentration, nonspecific amplifications arose. Spurious amplification explains the later rise in fluorescence intensity after cycle 22 in the amplification plot (Fig. 2C). Thus, those signals arising after the mean Ct value of the NTC samples were considered nonspecific signals and discarded from further analysis. When DNA templates were provided, the ASPs and probes dominated the reaction and spurious reactions did not occur. We have observed that second-tier amplification with between 23 and 29 cycles is generally ideal for allele discrimination.
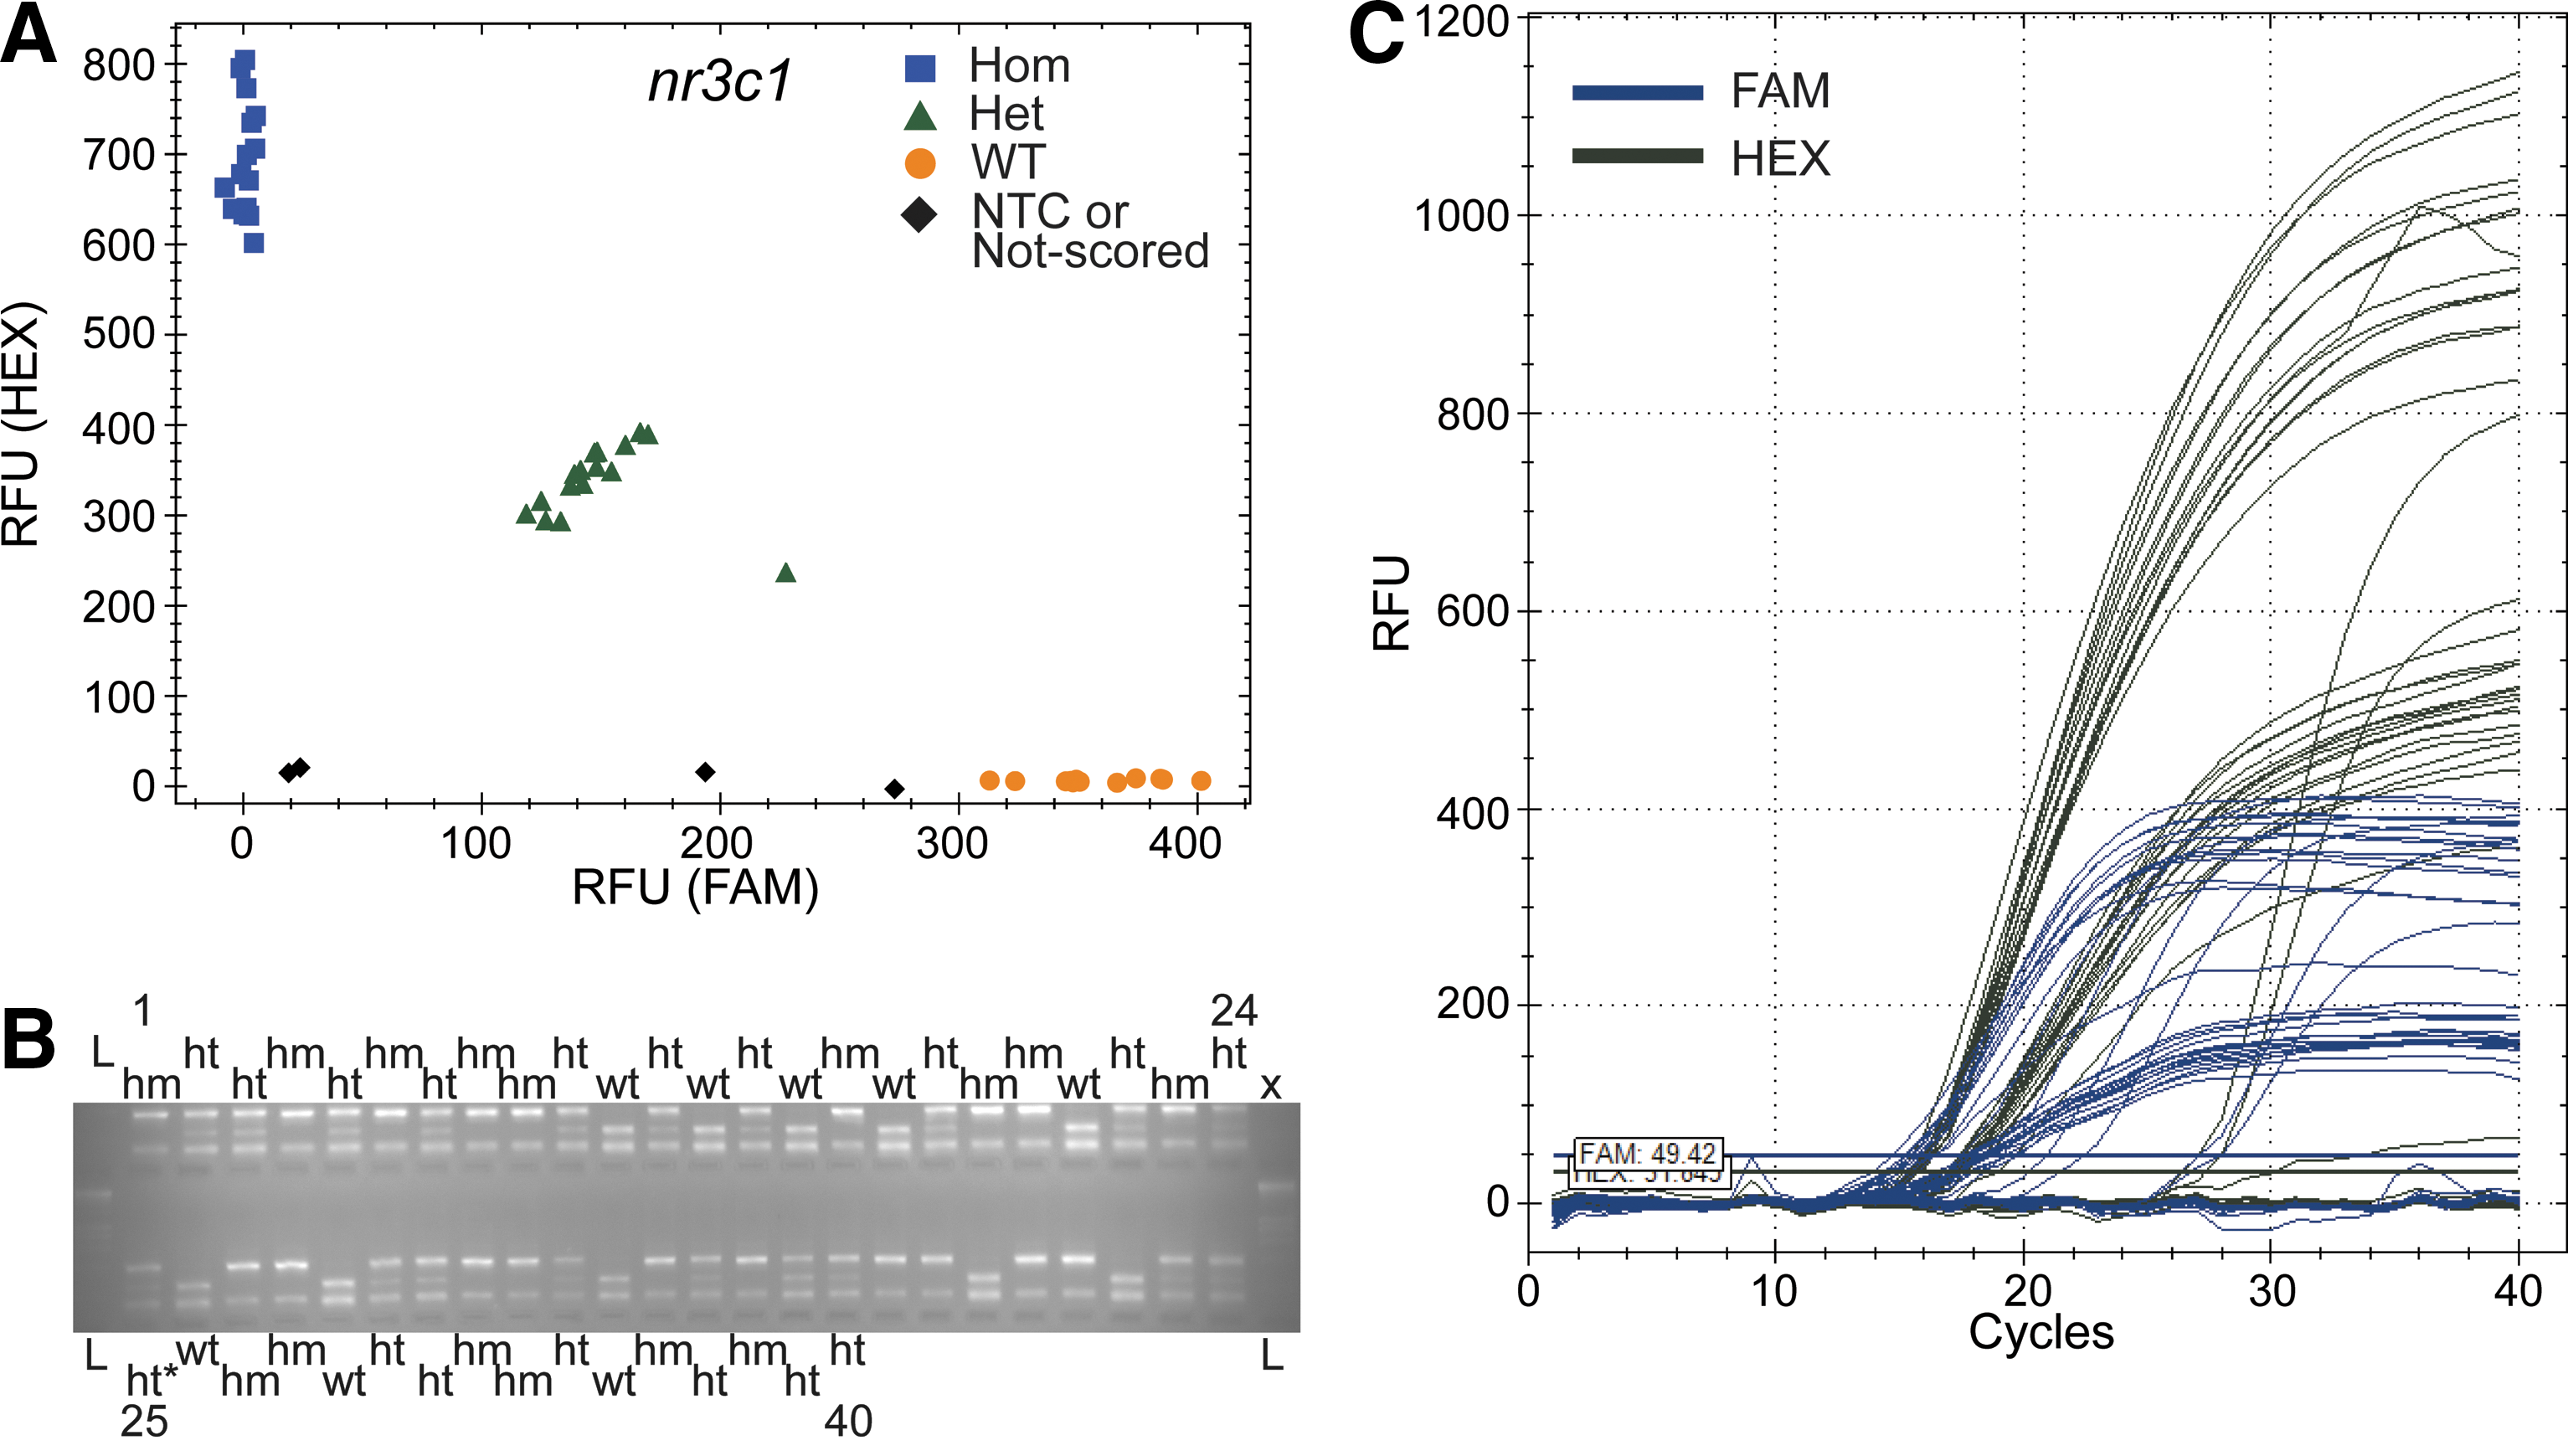
Validation of ASQ genotyping of the nr3c1 locus with restriction fragment length polymorphism (RFLP).
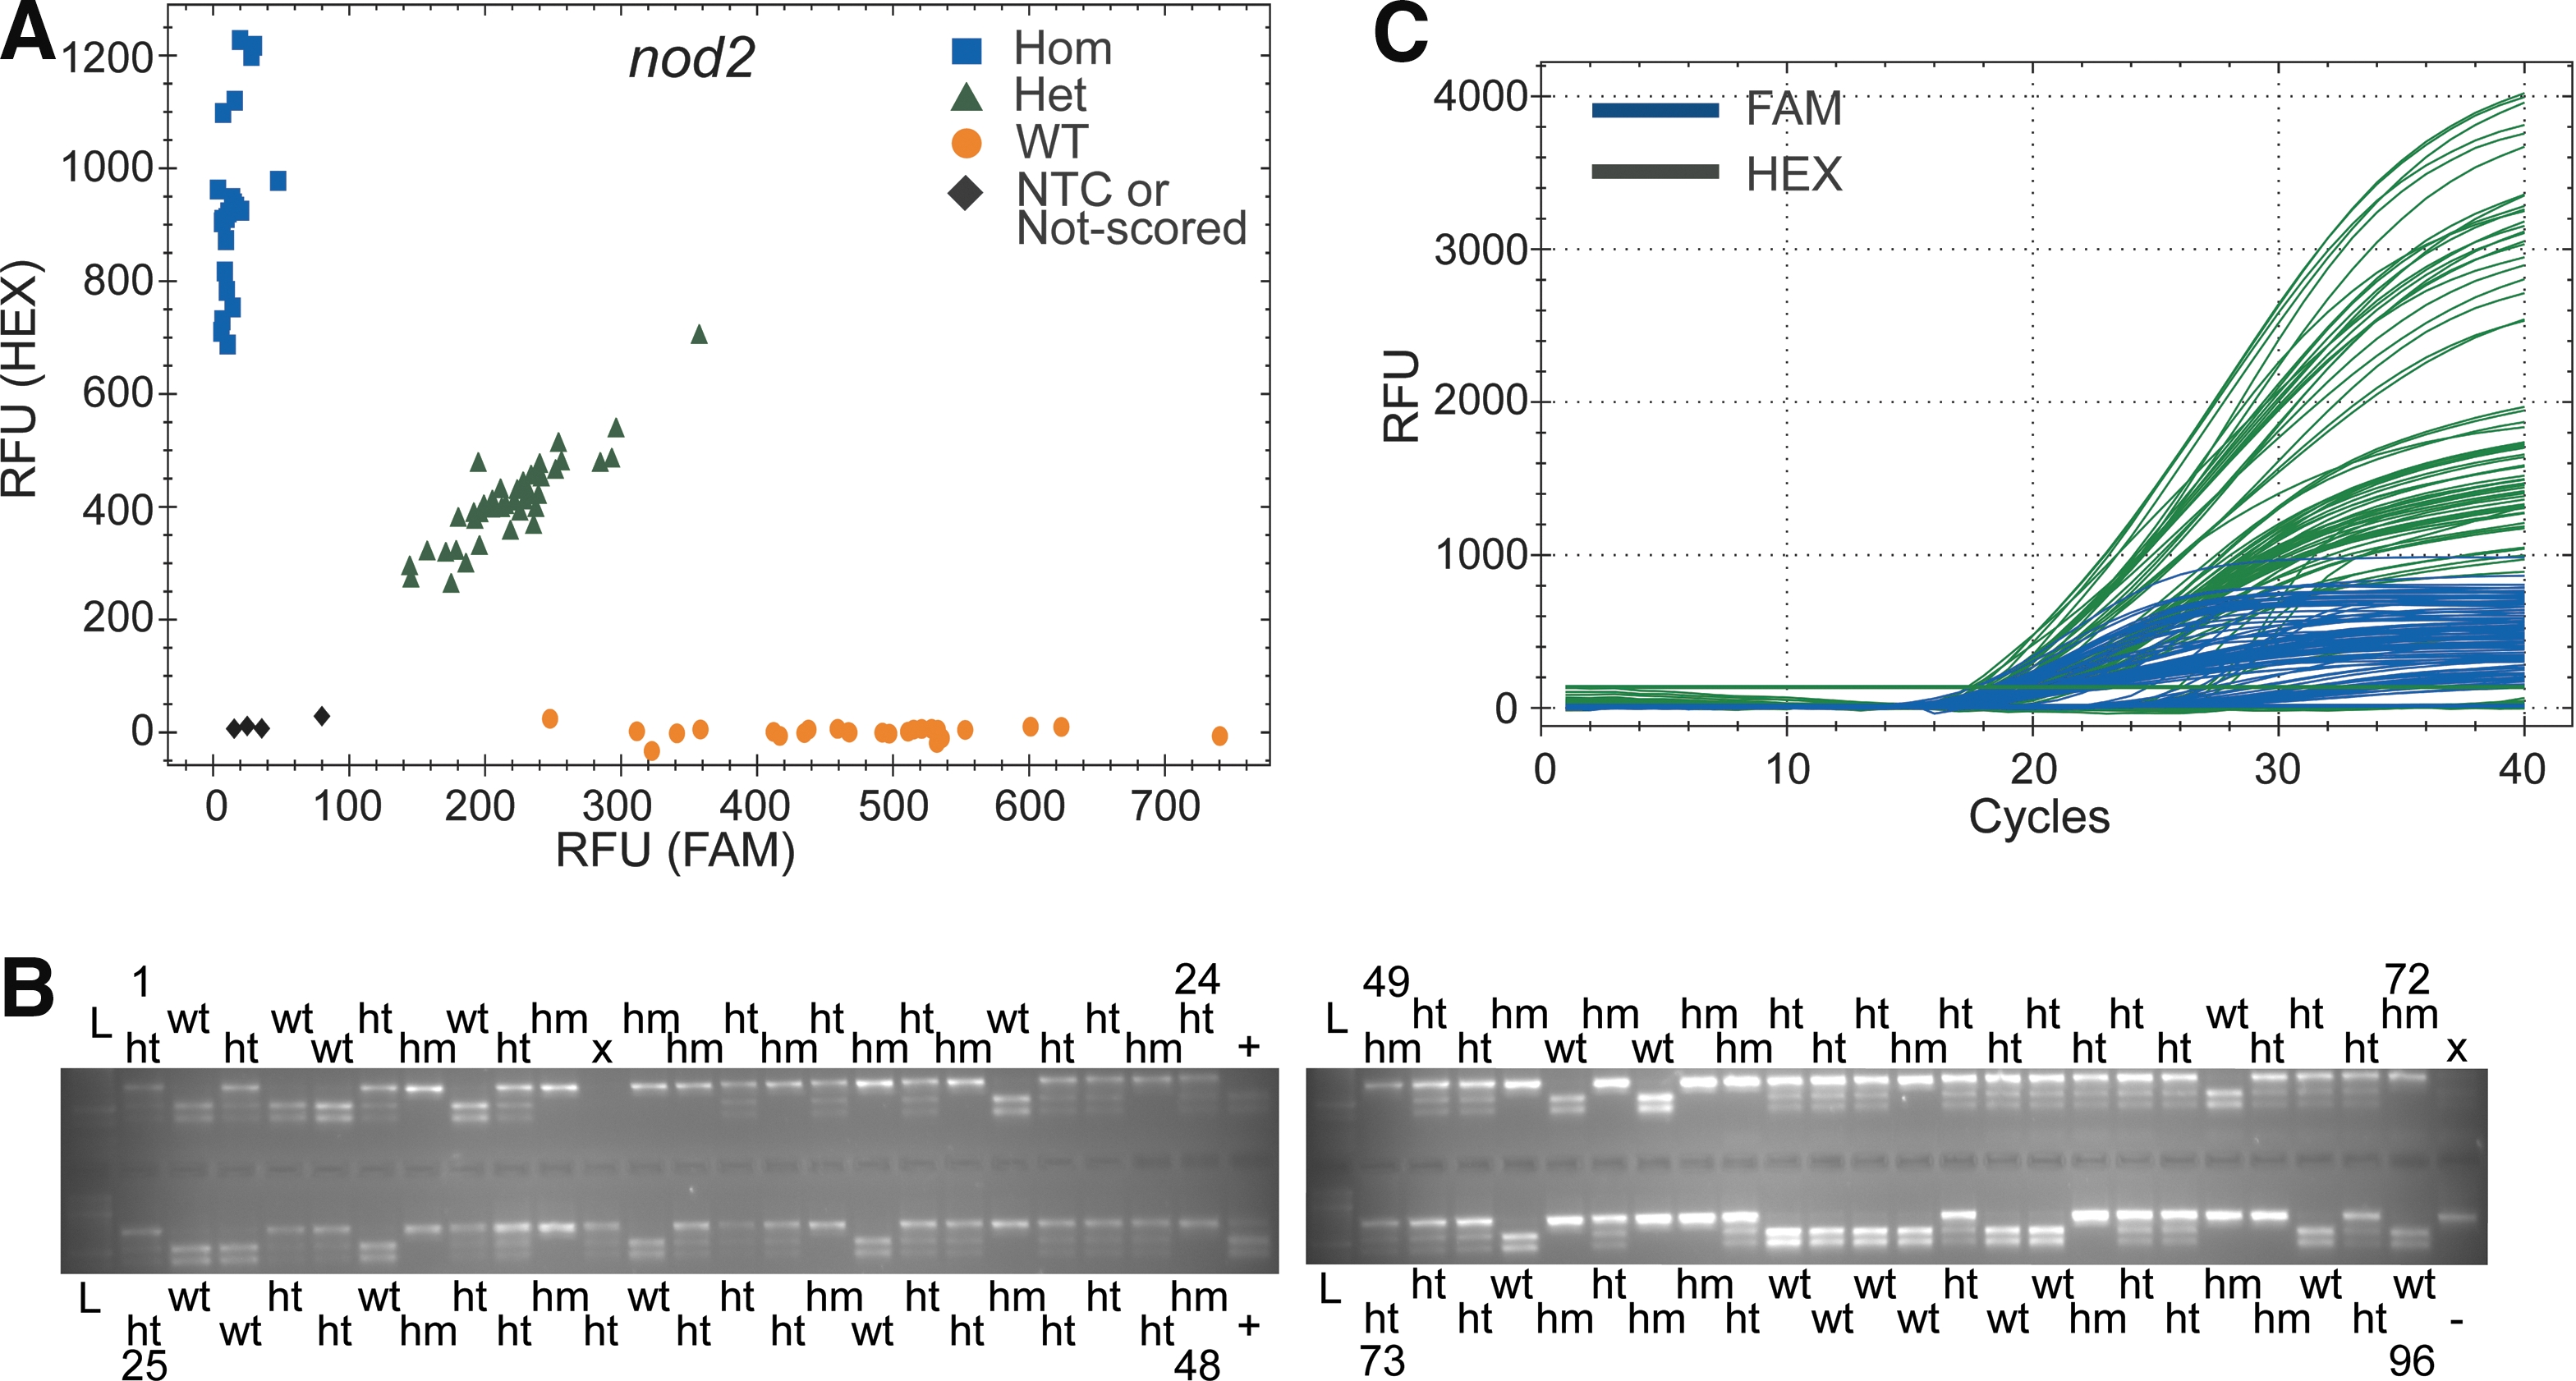
Validation of ASQ genotyping of the nod2 locus with RFLP.
Genotype scoring of germline mutants
With basic optimization, ASQ has shown a 98–100% agreement in genotype scoring with RFLP or Sanger sequencing when tested in 5 different genomic loci in zebrafish: nr3c1 (nuclear receptor subfamily 3 group c member 1; gene ID: 553740), nod2 (nucleotide-binding oligomerization domain-containing protein 2; gene ID: 777696), mc2r (melanocortin receptor type 2; gene ID: 353152), myo7aa (myosin VIIAa; gene ID: 252846), and il-6 (interleukin 6; gene ID: 100885851). Mutations in these loci included a 7 bp deletion (nr3c1), 5 bp deletion (nod2), two independent 4 bp deletions and a 5 bp deletion (mc2r), single-nucleotide polymorphism (SNP) (myo7aa), and 1 bp insertion (il-6) (Supplementary Table S2).
We first tested nr3c1 (7bp-del) and nod2 (5bp-del) loci for indel genotype scoring, which delivered a 100% concordance with RFLP genotyping outcomes (Figs. 2 and 3; Supplementary Figs. S4 and S5; Supplementary Table S3). We then tested multiplexing of primers for the mc2r locus in a mixed population of mutant zebrafish strains (a 4bp-del, another 4bp-del, or 5bp-del). Unconfirmed heterozygote carriers from these 3 alleles were randomly mated. We were able to use a multiplexed ASQ to score genotypes (wild-type [wt], heterozygous [het], or homozygous [hom]) in 100% agreement with RFLP results (Supplementary Figs. S1 and S6; Supplementary Table S3) regardless of the mutant allele(s) carried in the offspring. ASQ is a two-allele genotyping system that can score the genotype (wt, het, or hom) of two competing alleles (e.g., 1 wt allele vs. 1 mutant allele). The experiments with the mc2r locus showed that multiple ASPs (wt, two independent 4 bp-dels, and 5 bp-del) could be mixed in a single reaction. In this case, DNA templates in a sample contained no more than two competing alleles. Subsequently, we tested ASQ in the myo7aa locus (an SNP; 1 bp-substitution) and the il-6 locus (1 bp-insertion). ASQ genotype scoring was also 100% in agreement with Sanger sequencing (myo7aa) (Supplementary Figs. S2 and S7; Supplementary Table S3) and 98% in agreement (63/64) with RFLP (il-6) due to 1 il-6 sample that did not have signal (Figs. S3 and S8; Supplementary Table S3).
Discussion
Ensuring the quality of ASQ reactions
Genomic DNA preparation
The quality and amount of DNA template are critical factors in determining the specificity of ASQ reaction and genotype scoring. Although we have used NaOH-treated crude DNA preparations without any complication, there are differences in the quality of crude preparations, especially when using end-point analysis. To control the quality of DNA preparations, it is important to adhere to the same treatment regimen for each treatment. After NaOH treatment, the tissue needs to be vortexed or vigorously flicked to make each sample a homogeneous solution. Once the tissue has been thoroughly homogenized (although still cloudy), Tris buffer (pH 8) has to be added to the samples to neutralize NaOH and prevent extensive nicking of genomic DNA.
Assessing the quality of each ASQ assay
To assess the quality of DNA templates in a reaction (96-well plate), a dilution series of genomic DNA of known genotype is used (see Supplementary Figs. S4–S9 for standard curves for each locus). The spurious amplification can be detected by comparing the amplification of the dilution series against the amplification of NTCs. Any amplifications occurring beyond the mean Ct or below the mean fluorescence value of NTCs should be considered nonspecific amplification. The dilution series provides the relative amount of DNA at which specific amplification terminates and spurious amplification arises. The dilution series is useful because DNA is generally used without accurate quantification in crude preparations. Samples may show nonspecific reactions for various reasons, including evaporation, poor DNA quality, low DNA quantity, or a high concentration of PCR inhibitors such as excess salts, polysaccharides, hemoglobin, immunoglobulin G, and proteinases. 39,40 Those samples with spurious amplification should be discarded from genotype calling.
While we have successfully used crude preparation of approximately 3 ng of genomic DNA, the lowest amount of DNA template that can be used would vary depending on the quality of DNA preparation and the specificity of the reaction. We anticipate that lower quantities of DNA template would work if purified DNA samples are used. We did not test purified DNA templates because the purpose of developing the ASQ system was to perform a rapid and accurate genotyping in the most versatile and convenient way.
Analyzing assays accurately
Choosing between a Ct value and end-point reading method
With ASQ, genotype scoring can be accomplished with either threshold cycle (Ct) or end-point fluorescence reading. Beginning with the Ct value method is easier to optimize the assay conditions. In the Ct value method, fluorescence values are read in each cycle of the second tier amplification (Table 3). Because the increasing fluorescence values are acquired at each cycle, we can determine the cycle at which spurious reaction arises and the sensitivity of the reaction using the NTCs and a dilution series. A total of 40 cycles in the second-tier amplification were used during this optimization process, and a decreased number of cycles can be used once the assay is optimized. The end-point reading method can shorten the reaction time because the reading is conducted only one time after a completion of the reaction. After optimization, the end-point reading in routine ASQ applications would save time and can be done on a standard thermal cycler.
Other applications and considerations
Combining ASQ in nested PCR
It is often necessary to process samples for both RNA extraction and DNA genotyping. If the model system is a larger animal or cell culture, different portions of the sample can be allotted for either RNA or DNA preparation. In smaller animal models such as larval zebrafish and fruit flies, the amount of tissue is often limited and the reagents used to neutralize RNase can strongly inhibit PCR. In such case, we have performed ASQ genotyping using a nested PCR approach. We used a pair of “outer” primers for the first PCR that generates a bigger amplicon flanking allele-specific primer/reverse primer binding ranges. In this application, 1 μl (or any small volume) of each sample prepared for RNA extraction was diluted at 1:25 in 24 μl of PCR-grade water. The first PCR was performed with this DNA sample and outer primers. Subsequently, the first PCR product was diluted at 1:100 and the diluted PCR product was used as DNA source for ASQ genotyping. The nested PCR successfully lowers the amount of PCR inhibitors such as guanidine thiocyanate in RNA extraction buffer 41 while increasing the amount of DNA template for ASQ. In this application, lower Ct values were observed compared with the genomic DNA preparation, implying that the products for the first PCR contained a higher concentration of DNA than genome DNA.
Size of the amplicons
The size of the amplicon generated between an allele-specific primer and reverse primer varied widely ranging from 165 bp (nr3c1) to 365 bp (nod2) without affecting the accuracy of genotype scoring (Supplementary Table S2). This dynamic range should assist in designing a reverse primer with a proper annealing temperature in AT or GC-rich regions.
Dealing with SNPs and 1 bp deletion or insertion
Designing a pair of ASPs (wild-type vs. mutant) at an SNP site is more challenging than designing an assay for indel sites. Because of the mechanism of ASQ, the locus of ASPs is fixed at the site of the SNP. The guidelines, described in the Materials and Methods section such as modifying the length of ASPs and changing the directionality of ASPs and a reverse primer, should be generally sufficient to produce a successful assay. However, if correct genotype calling fails after exhausting these basic options, an alternative primer designing can be applied. This guideline exploits the fact that one mismatch at the 3′ end of the primer might not be sufficient to prevent an nonspecific extension, whereas two consecutive mismatches at the 3′ end of the primer increase the possibility of preventing an extension. 21,42 The penultimate nucleotide in the ASPs can be intentionally made to be the same nucleotide on the binding strand instead of being complementary. This way, the ASPs (wild-type vs. mutant) will have two mismatches at the 3′-end on the opposite allele. When the ASPs designed with the penultimate-site mismatch are tested, it is strongly recommended to perform gradient PCR to determine the most effective annealing temperature during the first-tier PCR. We applied this method to the il-6 locus and could acquire stronger signals and better clusters (Supplementary Fig. S3; Table 1).
Conclusions
With the increasing application of whole-genome and whole-exon sequencing in the clinical setting, functional validation of variants of uncertain significance (VUS) in animal models and cell lines is a priority. A rapid application of customizable endonucleases in both clinical and research environments generates mutant animals and cell lines with an increasing speed. Genotyping mutant alleles and maintaining the identity of an allele should be further streamlined and routinized so that they do not impede the pace of delivering novel discoveries. ASQ provides a rapid, accurate, and cost-effective solution for genotyping, which can be easily customized. We reported a promising application of ASQ technology to five genomic loci in zebrafish. On the basis of our experience in zebrafish, we expect that ASQ technology can be adapted to other model systems, including plants and cell culture.
Footnotes
Acknowledgments
Tammy M. Greenwood, Kelly S. Predmore, Danielle E. Hunter, and Ryan E. Leveque in Mayo Clinic Zebrafish Core Facility took care of zebrafish strains. myo7aa strain was provided by Dr. Teresa Nicolson's laboratory (currently in Oregon Health and Science University). Dr. Haojie Huang and colleagues in Mayo Clinic allowed us to use their qPCR machine during the early stage of project development. Dr. Stephen C. Ekker in Mayo Clinic provided critical feedback for experimental design and manuscript. The National Institutes of Health (GM63904, DK84567, DA032194), Mayo Graduate School, the Mayo Clinic Center for Individualized Medicine, and the Mayo Foundation for Medical Education and Research provided funding and support for our work.
Author Disclosure
No competing financial interests exist.
References
Supplementary Material
Please find the following supplemental material available below.
For Open Access articles published under a Creative Commons License, all supplemental material carries the same license as the article it is associated with.
For non-Open Access articles published, all supplemental material carries a non-exclusive license, and permission requests for re-use of supplemental material or any part of supplemental material shall be sent directly to the copyright owner as specified in the copyright notice associated with the article.