
Abstract
Oncolytic adenoviruses represent a novel class of anticancer agents. Their efficacy in killing cancer cells is variable, suggesting that there is room for improvement. Host miRNAs have been shown to play important roles in susceptibility of cells to replication of different viruses. This study investigated if adenovirus replication in human prostate cancer cells is influenced by host cell miRNA expression. To this end, human miRNA expression in response to adenovirus infection was analyzed, and functional screens for lytic adenovirus replication were performed using synthetic miRNA mimic and inhibitor libraries. Adenovirus infection generally reduced miRNA expression. On top of this nonspecific interference with miRNA biogenesis, a set of miRNAs, including in particular miR-222, was found specifically reduced. Another set of miRNAs was found to promote adenovirus-induced death of prostate cancer cells. In most cases, this did not stimulate adenovirus propagation. The exception was miR-26b. Overexpression of miR-26b inhibited adenovirus-induced NF-κB activation, augmented adenovirus-mediated cell death, increased adenovirus progeny release, and promoted adenovirus propagation and spread in several human prostate cancer cell lines. This suggests that miR-26b is particularly useful to be combined with oncolytic adenovirus for more effective treatment of prostate cancer.
Introduction
F
There is increasing evidence that microRNAs (miRNAs) play important roles in virus–host cell interactions. 11,12 On one hand, RNA interference (RNAi) forms part of the defense mechanism of many multicellular organisms against viruses. 13 Although a physiological role for RNAi in response to virus infection in mammals is being challenged, 14 several reports suggest specific suppressive activities of cellular miRNAs on mammalian viruses. 15 –18 On the other hand, some mammalian viruses were shown to exploit the RNAi machinery of their host to their benefit. In particular, viruses of the herpesvirus and polyomavirus families were found to express virus-encoded miRNAs that modify host cell biology to promote virus replication. 19,20 Interestingly, virus replication can also be enhanced by host cell miRNAs, as can be deduced from the unusual observations that miR-122 expression in liver cells promoted hepatitis C virus replication 21 and that elevated miR-132 expression in T cells augmented HIV-1 replication. 22 Thus, host cell miRNAs might exert specific proviral or antiviral activities. In the present study, it was postulated that adenovirus replication could perhaps also be regulated by host cell miRNA expression. MiRNA expression is often tissue specific and altered in cancer cells compared with their healthy tissue counterpart. 23 –25 Oncolytic adenoviruses currently under development for the treatment of cancer are mostly derived from human adenovirus serotype 5 (Ad5) that naturally propagates primarily in differentiated airway epithelial cells. Hence, differential miRNA expression in cancer cells compared with the natural adenovirus host cells could influence oncolytic adenovirus potency and, consequently, cancer treatment efficacy.
This study investigated the effect of human miRNAs on adenovirus propagation in prostate cancer cells by analyzing miRNA expression in response to adenovirus infection and by performing functional screens with synthetic miRNA mimics and inhibitors. Several host miRNAs were identified that impact the adenovirus life cycle. In particular, miR-26b was identified as a stimulator of Ad5 propagation. This knowledge provides insight in adenovirus biology and new therapeutic opportunities for effective treatment of prostate cancer with oncolytic adenoviruses.
Materials and Methods
Cells
PC-3 prostate cancer cells, A549 non-small cell lung cancer cells, U87MG glioblastoma cells, and HEK293 adenovirus E1-complementing cells were grown at 37°C and 5% CO2 in a humidified incubator in Dulbecco's modified Eagle's medium F12 (DMEM-F12) supplemented with 10% fetal bovine serum (FBS) and antibiotics (100 IU/mL of penicillin and 100 μg/mL of streptomycin). DU145 and 22Rv1 (both prostate cancer cell lines) were grown in Roswell Park Memorial Institute 1640 medium (RPMI-1640), supplemented with 10% FBS and antibiotics. Three prostate cancer cell lines overexpressing human miR-26b and miR-Vec empty vector control cells were generated by transduction with amphotropic retroviral miR-Vec-26b and miR-Vec-ctrl virus, 26 respectively, in the presence of 8 μg/mL of polybrene (Sigma–Aldrich). After 3 days, cells were subjected to 5 μg/mL of blasticidine S hydrochloride (Sigma–Aldrich) for 10 days to select for transduced cells. Cells were cloned by limiting dilution and a miR-26b clone with strong miR-26b overexpression compared with miR-Vec cells, as measured by quantitative polymerase chain reaction (PCR), was selected for all three prostate cancer cell lines. Prostate cancer NF-κB reporter cells were made by transfecting PC-3 cells with pGL4.32[luc2P/NF-κB-RE/Hygro] (Promega) using FuGENE® 6 Transfection Reagent (Promega). Transfected cells were selected using 100 μg/mL of hygromycin B (ROTH). Individual clones were tested for firefly luciferase activity using the Promega Luciferase Chemiluminescent Assay System and an EG&G Berthold Lumat LB 9507 luminometer. A clone with clear luciferase expression that was induced upon addition of tumor necrosis factor alpha (TNF-α) was designated PC-3/NF-κB-Luc and used in NF-κB activity assays.
MiRNA reagents
The miRIDIAN human miRNA mimic (cat. no. CS-001000, Lot 060417) and inhibitor (cat. no. IS-001000, Lot 060417) libraries and control Caenorhabditis elegans miRNA mimics (#1, cel-miR-67, cat. no. CN-001000-01-05; #2, cel-miR-239b, cat. no. CN-002000-01-05) and inhibitors (#1, cel-miR-67, cat. no. IN-001000-01-05; #2, cel-miR-239b, cat. no. IN-002000-01-05) were obtained from Dharmacon, part of GE Healthcare. The libraries comprised 426 mimics or inhibitors, representing 344 unique mature miRNAs. Replicate miRNAs in the libraries are those with more than one identifier in miRBase v8.
Adenoviruses
Wild-type human adenovirus serotype 5 (Ad5) was kindly provided by Rob Hoeben (Leiden University Medical Center). Recombinant AdE1+Luc virus that has a wild-type Ad5 genome with the E3-gp19k open reading frame replaced by a firefly luciferase open reading frame has been described before. 27 Oncolytic adenovirus AdΔ24.CMV-GFP carrying an expression cassette for enhanced green fluorescent protein (GFP) under control of the CMV promoter has also been described before. 28 A similar virus expressing GFP driven by the endogenous major late promoter was made as follows. The GFP cDNA gene was obtained by PCR amplification using primers with overhanging XbaI and SacI restriction sites and pAdTrack 29 as template; and inserted into XbaI/SacI-digested pABS.4-SA-MCS. 30 This plasmid was digested with PacI and inserted into PacI-digested pBHG11 (Microbix Biosystems). The kanamycin resistance gene was removed by digestion with SwaI followed by self-ligation. The resulting plasmid was recombined with pXC1-Delta2431 following co-transfection into HEK293 cells. The emerging virus was plaque purified and propagated on A549 cells. Virus titers were determined using the Adeno-X Rapid Titer Kit (BD Biosciences).
MiRNA transfections
Forward transfections were done in 96-well microtiter plate format on 5,000 PC-3 cells seeded 2 days before transfection. MiRNA mimics or inhibitors were mixed with DharmaFECT transfection reagent (Dharmacon) and added according to the manufacturer's instructions. Transfection reagent and miRNA concentrations were chosen on the basis of experiments with GAPDH siRNA (Dharmacon cat. no. D-001140-01) and non-targeting control siRNA (siCONTROL #1; Dharmacon cat. no. D-001210-01) to yield minimal toxicity (i.e., reduction of GAPDH activity after control siRNA transfection) and maximal silencing (i.e., reduction of GAPDH activity after GAPDH siRNA transfection compared with control siRNA transfection), as determined by KDalert assay (Ambion). Transfection reagent DharmaFECT-2 was used at 0.2% final concentration; miRNA mimic and inhibitor concentrations were 100 nM in primary screens, 50 nM in secondary screens, and 25 nM in validation experiments. Decreasing mimic and inhibitor concentration, hence increasing stringency, was applied in the hit identification and stratification strategy to maximize hit identification in the primary discovery screens and depletion of false-positive hits in the confirmation and validation studies.
Cell viability screens
First, three independent replicate primary cell viability screens were done on adenovirus-infected PC-3 cells. Cells were seeded 5,000 cells per well in 96-well microtiter plates and transfected 2 days later with 100 nM of miRNA mimic and inhibitor libraries. One day later, cells were infected with wild-type Ad5 at high multiplicity of infection (MOI; 100 IU/cell). Under these conditions, all cells in the culture were infected. Cell viability was measured using Cell-Titer Blue reagent (CTB; Promega) 4 days after adenovirus infection, when cell viability in control Ad5-infected cultures had declined by 30–50%. To this end, 10 μL of CTB was added to all wells and mixed by shaking. After 2 h of incubation at 37°C and 5% CO2 in a humidified incubator, reactions were stopped by adding 50 μL of 3% SDS. After at least 30 min of incubation at room temperature, cell viability was determined by measuring fluorescence at 540 (25) nm excitation and 590 (20) nm emission wavelengths using a Tecan Infinite F200 reader. Data preprocessing and normalization for analysis was done using CellHTS2 software. 32 Primary hits were selected on the basis of robust Z and B-scoring. The advantages and limitations of these statistical methods for analysis of RNAi screen data were reviewed by Birmingham et al. 33 The primary hit selection threshold was set at 2 median absolute deviations (MAD) above or below the median robust Z score or 3 MAD above or below the median B score. This hit selection did not select any of the negative controls included in the screens.
Next, all primary hit miRNA mimics and inhibitors were rescreened in two independent secondary screens, each consisting of six plate sets (i.e., three that were subsequently subjected to Ad5 infection as in the primary screens, and three that were subjected to control medium without Ad5). Test miRNA mimics and inhibitors were randomly distributed over plates at different positions in the two secondary screens and at different positions from in the primary screens. Each plate set furthermore included 43 negative control mock transfections. Experimental setup was the same as in the primary screens, except for the miRNA mimic or inhibitor concentration, which was reduced to 50 nM. In these experiments, Ad5-infected controls caused approximately 40% cell kill at the time of analysis. The data of the secondary screens were analyzed in two ways. First, direct miRNA-mediated effects on cell viability were determined on plates without virus. Second, the mean 2Log(ratio with/without Ad5) was calculated. The hit selection threshold to identify miRNA-mediated sensitization to or protection against Ad5-induced cell death was set at 3 standard deviations above or below the mean 2Log(ratio with/without Ad5) of the 43 negative controls.
Adenovirus replication screen
Three independent replicate screens with the miRIDIAN mimic and inhibitor libraries and PC-3 cells as above were performed, but now infecting the cells with AdΔ24.SA-GFP at a lower, non-saturating MOI (10 IU/cell). Two days after infection, GFP expression was determined by lysing the cells with 50 μL of 3% SDS and measuring fluorescence at 488 (10) nm excitation and 530 (25) nm emission wavelengths using a Tecan Infinite F200 reader. Screen results were analyzed by B-score calculation using cellHTS2 software, and the hit selection threshold was set at a mean B-score >3 or <–3.
Virus output assay
PC-3 cells were seeded and transfected with 50 nM of miRNA mimic as above. The next day, the cells were infected at 500 IU/cell with recombinant adenovirus AdE1+Luc expressing firefly luciferase. Excess virus was washed away after a few hours, and intracellular virus was allowed to replicate. When cytopathic effects became apparent in control cultures, cell and supernatant fractions were collected separately, and virus was released by multiple freeze–thaw cycles. The supernatant fraction was collected by harvesting the upper 50 μL from the wells. This fraction was considered to contain 50% of the total amount of released virus. The remaining 50 μL of culture medium with adherent, semi-adherent, and detached cells were collected as cell fraction. The amount of progeny virus inside the cells was calculated by subtracting the virus titer in the supernatant fraction from the titer in the cell fraction. To determine the infectious virus titers, samples were diluted, and 10 μL was used to infect fresh PC-3 cells seeded 10,000 cells/well in 96-well plates the day before. A dilution titration of AdE1+Luc with known IU titer was taken along in triplicate. One day after infection, the cells were lysed, and luciferase expression was measured as above. Assay development experiments had shown a linear correlation between IU virus titer and firefly luciferase expression (relative light units [RLU]) in the range 100–100,000 IU per 10 μL. In addition, pre-diluting samples with high IU titer up to >1,000-fold caused a linear decrease in RLU values. Together, this allowed titrating AdE1+Luc over a range of 1.E+3 to 1.E+9 IU per 100 μL of culture (i.e., 0.1–100,000 IU per cell). Control cultures not transfected with miRNA mimics produced on average approximately 6,000 IU of AdE1+Luc per cell, of which at the time of analysis approximately 10% was released into the culture medium.
Adenovirus propagation assays
Two different virus propagation assays were used. In the first assay, PC-3 cells were seeded and transfected with 25 nM of miRNA mimic or irrelevant control siRNA as above. The next day, the cells were infected at 500 IU/cell with AdE1+Luc (cycle 0). Excess virus was washed away after a few hours. After 3 days of culture, cell and supernatant fractions were collected separately. The cell fraction was stored at −80°C in Reporter Lysis Buffer from the Promega Luciferase Chemiluminescent Assay System. The supernatant fraction, containing released progeny virus, was diluted 10,000-fold and used to infect PC-3 cells seeded and transfected as above (cycle 1). After another 3 days, cell and supernatant fractions were again collected separately. Cells were stored as above and supernatant was diluted 100-fold and used for another cycle of infection (cycle 2). This procedure was repeated once more (cycle 3). Stored cell lysates were used to measure luciferase activity, and virus expansion was calculated from the luciferase expression and the cumulative supernatant dilutions. Control experiments showed that measurements were in the linear range of detection. In the second assay, PC-3, DU145, and 22Rv1 miR-Vec or miR-26b expressing cells were seeded 10,000 cells/well in 96-well plates and the next day infected with AdΔ24.CMV-GFP at 100, 10, 1, 0.1, or 0.01 IU/cell. GFP expression was detected every 1–2 days until 7–10 days after infection using a TTP Labtech Acumen eX3 microplate cytometer with 488 nm excitation. Total fluorescence intensities were used as quantitative measure for number of adenovirus-infected cells. Fluorescence intensity scans were used to monitor virus spread in the cell monolayer.
Assay for adenovirus burst size
PC-3, DU145, and 22Rv1 miR-Vec or miR-26b expressing cells were seeded 10,000 cells/well in 96-well plates and the next day infected with AdΔ24.CMV-GFP at 0.01 and 0.001 IU/cell. At this low MOI, only very few infected cells were detected per well. GFP fluorescent images were taken daily from day 1 to day 11 with a TTP Labtech Acumen eX3 microplate cytometer set as above. Images were saved as TIFF files and exported to ImageJ to determine plaques. Images were first resized from 6,600 × 1,650 to 1,650 × 1,650 pixels to obtain the correct aspect ratio and then converted to micrometers. An unbiased selection of individual plaques per experimental group was made by careful examination of scans at all time points, avoiding inclusion of fluorescent areas that could not reliably be ascribed to a single plaque originating from a single infected cell. The first 20 plaques observed per experimental condition that met the selection criteria were included in the analysis. Plaque perimeters were defined with ImageJ's polygon selection tool and enclosed surface areas were calculated.
NF-κB activity assay
PC-3/NF-κB-Luc cells were seeded 10,000 cells/well in 96-well plates and transfected with 25 nM of miR-26b mimic or siCONTROL#1 as above. The next day, cells were infected with Ad5 at 3, 10, or 30 IU/cell or left untreated. One day after Ad5 infection, luciferase expression was measured as above. Control cultures not infected with Ad5 were stimulated with 10 ng/mL of TNF-α (R&D Systems) 4 hours before measuring luciferase activity.
MiRNA expression analysis by massively parallel sequencing
RNA was isolated using Trizol from PC-3 or U87MG cells before and 6 or 24 h after infection with Ad5. Total RNA (1 μg) was processed to generate sequence libraries under full service contract at the VUmc Tumor Genome Analysis Core using the Illumina TruSeq Small RNA Sample Preparation kit and protocol (Illumina). In short, RNA was adapter ligated, reverse transcribed, and PCR amplified. Amplified cDNA integrity was checked using an Agilent Bioanalyzer 2100 (Agilent Technologies) and a high sensitivity DNA chip. Next, cDNA of approximately 145–160 bp was purified on a 6% polyacrylamide gel and concentrated by ethanol precipitation. Isolated fragments were dissolved in 10 mM of Tris-HCl pH 8.5, and molarity was determined and integrity was checked using an expert DNA-1000 chip on the Agilent Bioanalyzer 2100. Peak products ranged from 142 to 150 bp. Fourteen different samples were pooled in equimolar quantities (5 fmol each). Cluster generation of the pooled sequence library was done on the Illumina cBot followed by sequencing on an Illumina HiSeq 2000 sequencer using single read 50 (SR50) run mode. The primary data analysis was performed by CASAVA 1.82, which generated fastq files for each sample. Expression of known miRNAs was analyzed by miRDeep2
34
using miRBase v19
35
and UCSC hg19 (
MiRNA quantitative PCR assay
RNA was isolated using QIAzol (Qiagen). To preserve small RNAs, 0.4 μg/mL glycogen was added to the aqueous phase. cDNA was synthesized using the Applied BioSystems TaqMan MicroRNA Reverse Transcription kit (part no. 4366597; cat. no. 0904040) and miRNA-specific stem-loop (SL) primers (Supplementary Table S1; Supplementary Data are available online at
Statistical analysis
Differences between experimental groups in adenovirus propagation and burst size assays were analyzed by multiple unpaired two-tailed t-tests (GraphPad Prism v6), with correction for multiple comparisons using the Holm–Sidak method.
Results
MiRNA screens for adenovirus lytic replication in PC-3 prostate cancer cells
With a particular interest in developing viral therapies for prostate cancer, experiments to identify human miRNAs that modulate the adenovirus life cycle were done using the prostate cancer cell line PC-3. To allow identification of relevant miRNAs irrespective of the endogenous miRNA expression in PC-3 cells, screens were performed with miRNA mimics and miRNA inhibitors. Introduction of mimics could identify relevant miRNAs that are not or insufficiently expressed in PC-3 cells and introduction of inhibitors might identify relevant miRNAs that are highly expressed in PC-3 cells. Figure 1A shows the experimental design of the primary screens done with 426 pairs of mimics and inhibitors, representing 344 unique mature miRNAs. One day after mimic or inhibitor transfection, cells were subjected to adenovirus infection. Subsequently, miRNA effects on the adenovirus life cycle were analyzed in two ways. In the first screen, effects on any phase of the adenovirus life cycle were detected by measuring cell viability 4 days after subjecting the cells to Ad5. This time point was chosen because PC-3 cells experienced an Ad5 dose-dependent viability decline from day 3 to day 5 after infection (Supplementary Fig. S1A). Measuring cell viability 4 days after infection with a saturating virus dose thus detects miRNA effects on the adenovirus life cycle, culminating in an accelerated or delayed death of the infected cell. In the second screen, cells were infected with oncolytic adenovirus AdΔ24.SA-GFP that expresses enhanced GFP driven by the endogenous adenovirus major late promoter (MLP). Late gene expression driven by this promoter is replication dependent. GFP expression was undetectable 1 day after infection, was dose dependent on day 2, and increased from day 2 to day 3 (Supplementary Fig. S1B). Screens were therefore performed with a non-saturating virus dose, and GFP expression was measured after 2 days. Both screens were done in three independent replicates. Two irrelevant control C. elegans miRNA mimics and inhibitors were included in duplicate on each assay plate. Supplementary Figure S2 shows that these molecules did not influence cell viability, Ad5-induced cell death, or MLP-driven GFP expression. Results of the cell viability and adenovirus replication screens are given in Supplementary Tables S2 and S3, respectively. Figure 1B shows the ranked mean robust B scores of the screens. Primary hits were selected on the basis of mean robust z and B scores. For replicate miRNAs present in the libraries, only those with consistent results were included in the primary hit list. This identified 43 molecules (29 mimics and 14 inhibitors) that affected cell death, and 17 molecules (12 mimics and 5 inhibitors) that modulated adenovirus replication (Supplementary Table S4). Figure 1C depicts the robust B score correlation between the results of the two screens. Most miRNA mimics and inhibitors that influenced cell viability did not significantly alter Ad5 replication. However, four miRNA mimics (i.e., miR-141, miR-151, miR-517a, and miR-517c) were found to decrease cell viability as well as Ad5 late gene expression. Probably, these four mimics induced PC-3 cell death before adenovirus replication was completed.

Primary screens for adenovirus propagation in PC-3 prostate cancer cells. (
Secondary screens for selective sensitization of PC-3 cells to Ad5-induced cell death
The primary cell viability screen did not discriminate between direct miRNA effects on cell viability and miRNA effects on Ad5-induced cell death. Therefore, primary hits were rescreened in two independent screens with and without Ad5 infection (Supplementary Table S5). Figure 2A shows the mean results of these screens, plotting direct miRNA-mediated effects on cell viability against miRNA-mediated effects on Ad5-induced cell death. Figure 2B illustrates that the hit confirmation rate was much higher for miRNA mimics than for miRNA inhibitors (69% vs. 7%). The secondary screens confirmed 21 primary hits that increased PC-3 cell death. Of these, miR-30a-3p, miR-520d, and miR-520e mimics and anti-miR-134 inhibitor affected cell viability directly (i.e., >20% reduced viability), but did not significantly affect Ad5-induced cell death. These molecules could thus be disregarded as modulators of adenovirus replication. In contrast, 17 miRNA mimics significantly increased Ad5-induced cell death (Supplementary Table S6). Figure 2C shows the absolute effects of these miRNAs on cell viability with and without Ad5 infection. A few miRNAs, in particular miR-10a, miR-10b, and miR-150, had minimal effects on PC-3 cell viability per se, but clearly sensitized the cells to Ad5-induced cell death. All other miRNAs affected cell viability to various degrees, but their combined effect with Ad5 infection was significantly stronger. Eight miRNA mimics brought about >80% reduced PC-3 cell viability in combination with Ad5 infection. This group of strongest sensitizers to Ad5-induced cell death was enriched for miRNAs that inhibited Ad5 late gene expression (see Fig. 2), suggesting that many of them interfered with Ad5 replication.
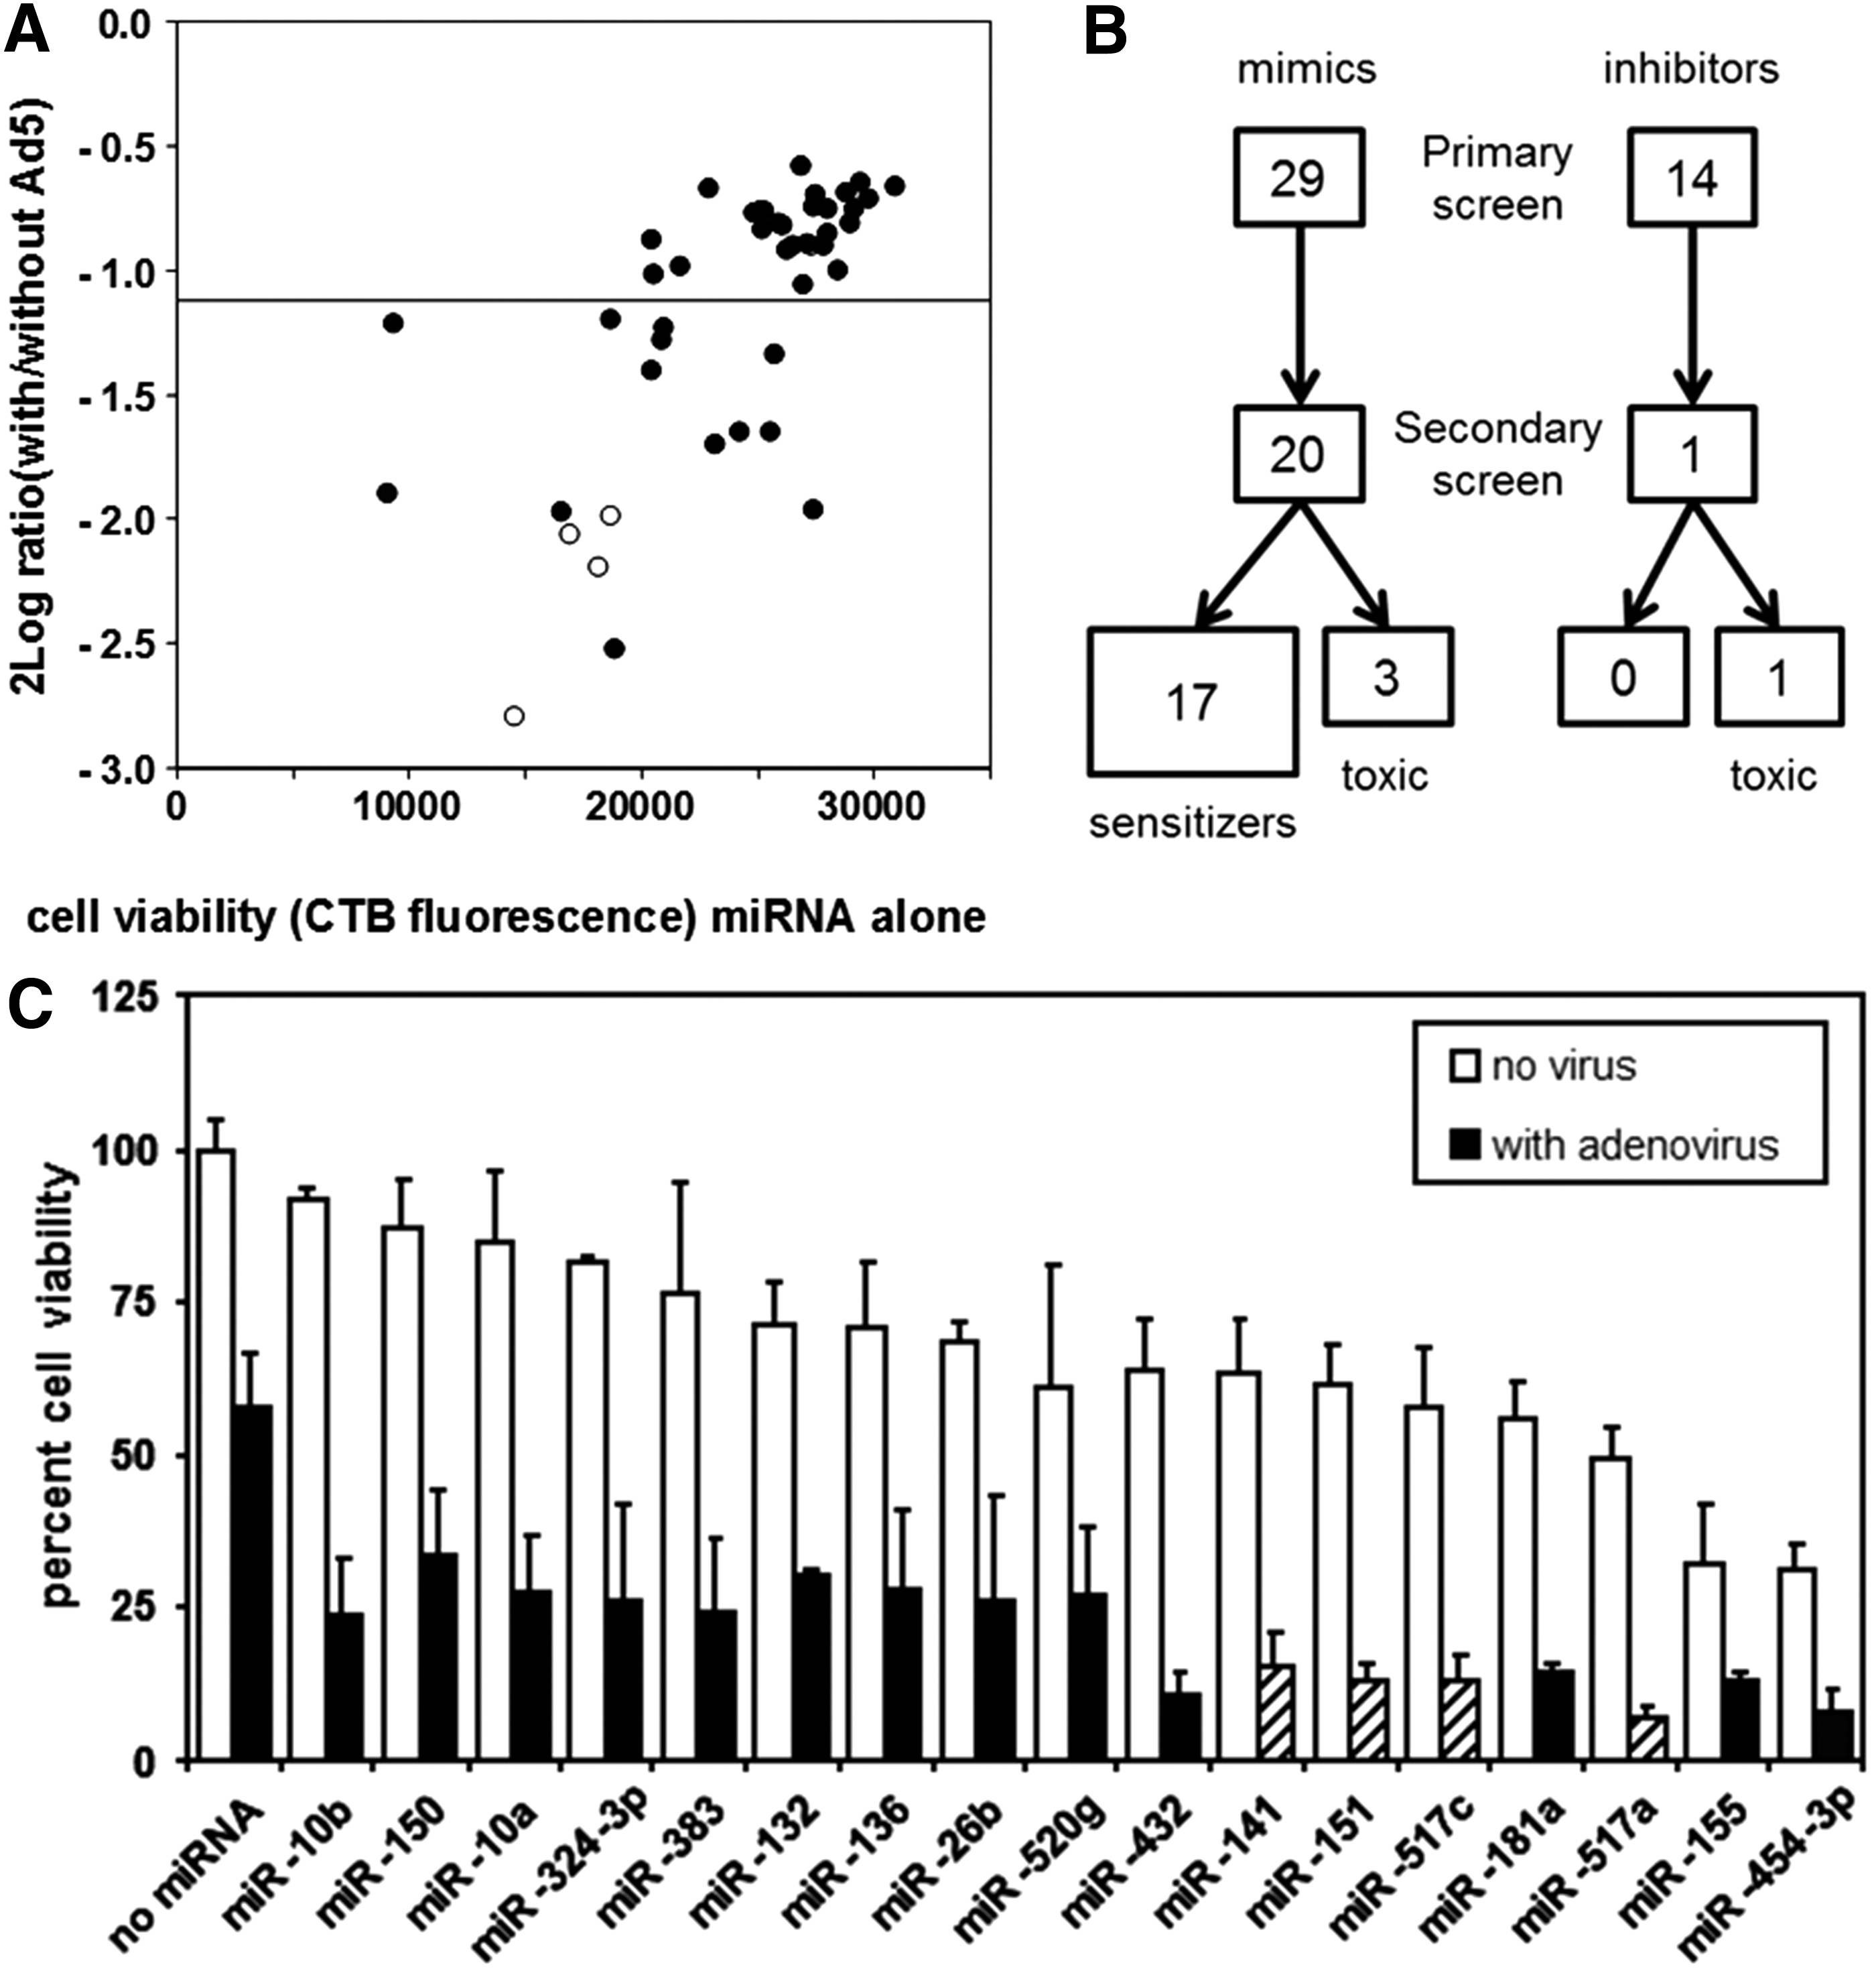
Identification of selective sensitizers to Ad5-induced cell death. Two independent cell viability screens were done in triplicate with and without Ad5 infection. (
Effect of miRNAs on infectious virus production in adenovirus-infected cells
Selected miRNAs were investigated for their effect on functional infectious virus production in and progeny virus release from PC-3 cells. To this end, PC-3 cells were transfected with miRNA mimics and infected at high MOI with recombinant adenovirus AdE1+Luc expressing firefly luciferase. When cytopathic effects became apparent in AdE1+Luc-infected control cultures that were not transfected with a miRNA mimic, cell and supernatant fractions were collected from all cultures separately. Infectious virus titers were determined by infecting fresh PC-3 cells and measuring luciferase activity. This allowed titrating AdE1+Luc over a 6-log infectious unit (IU) range. The effects of each miRNA mimic were determined in three to six independent experiments, and differences were considered meaningful if the titer was increased or decreased more than twofold. Figure 3 shows the relative infectious virus output of PC-3 cells transfected with test miRNA mimics compared to PC-3 cells transfected with irrelevant miRNA mimic cel-miR-67. As can be seen, most miRNAs with modest effects on Ad5-induced cell death had little impact on infectious virus production and release. In contrast, six of the eight miRNAs exhibiting the largest impact on cell viability caused a decrease in functional adenovirus production. This was largely consistent with the results of the late gene expression screen. All four miRNAs that inhibited late gene expression also inhibited functional virus production. Interestingly, two miRNAs (i.e., miR-26b and miR-181a) stood out from the rest. They increased adenovirus release approximately 10-fold and 3-fold, respectively. Although these effects were not statistically significant, due to the rather large inter-experimental variation, the combined promotion of cell death and virus release suggested that these miRNAs could be particularly useful to augment the therapeutic activity of oncolytic adenoviruses.
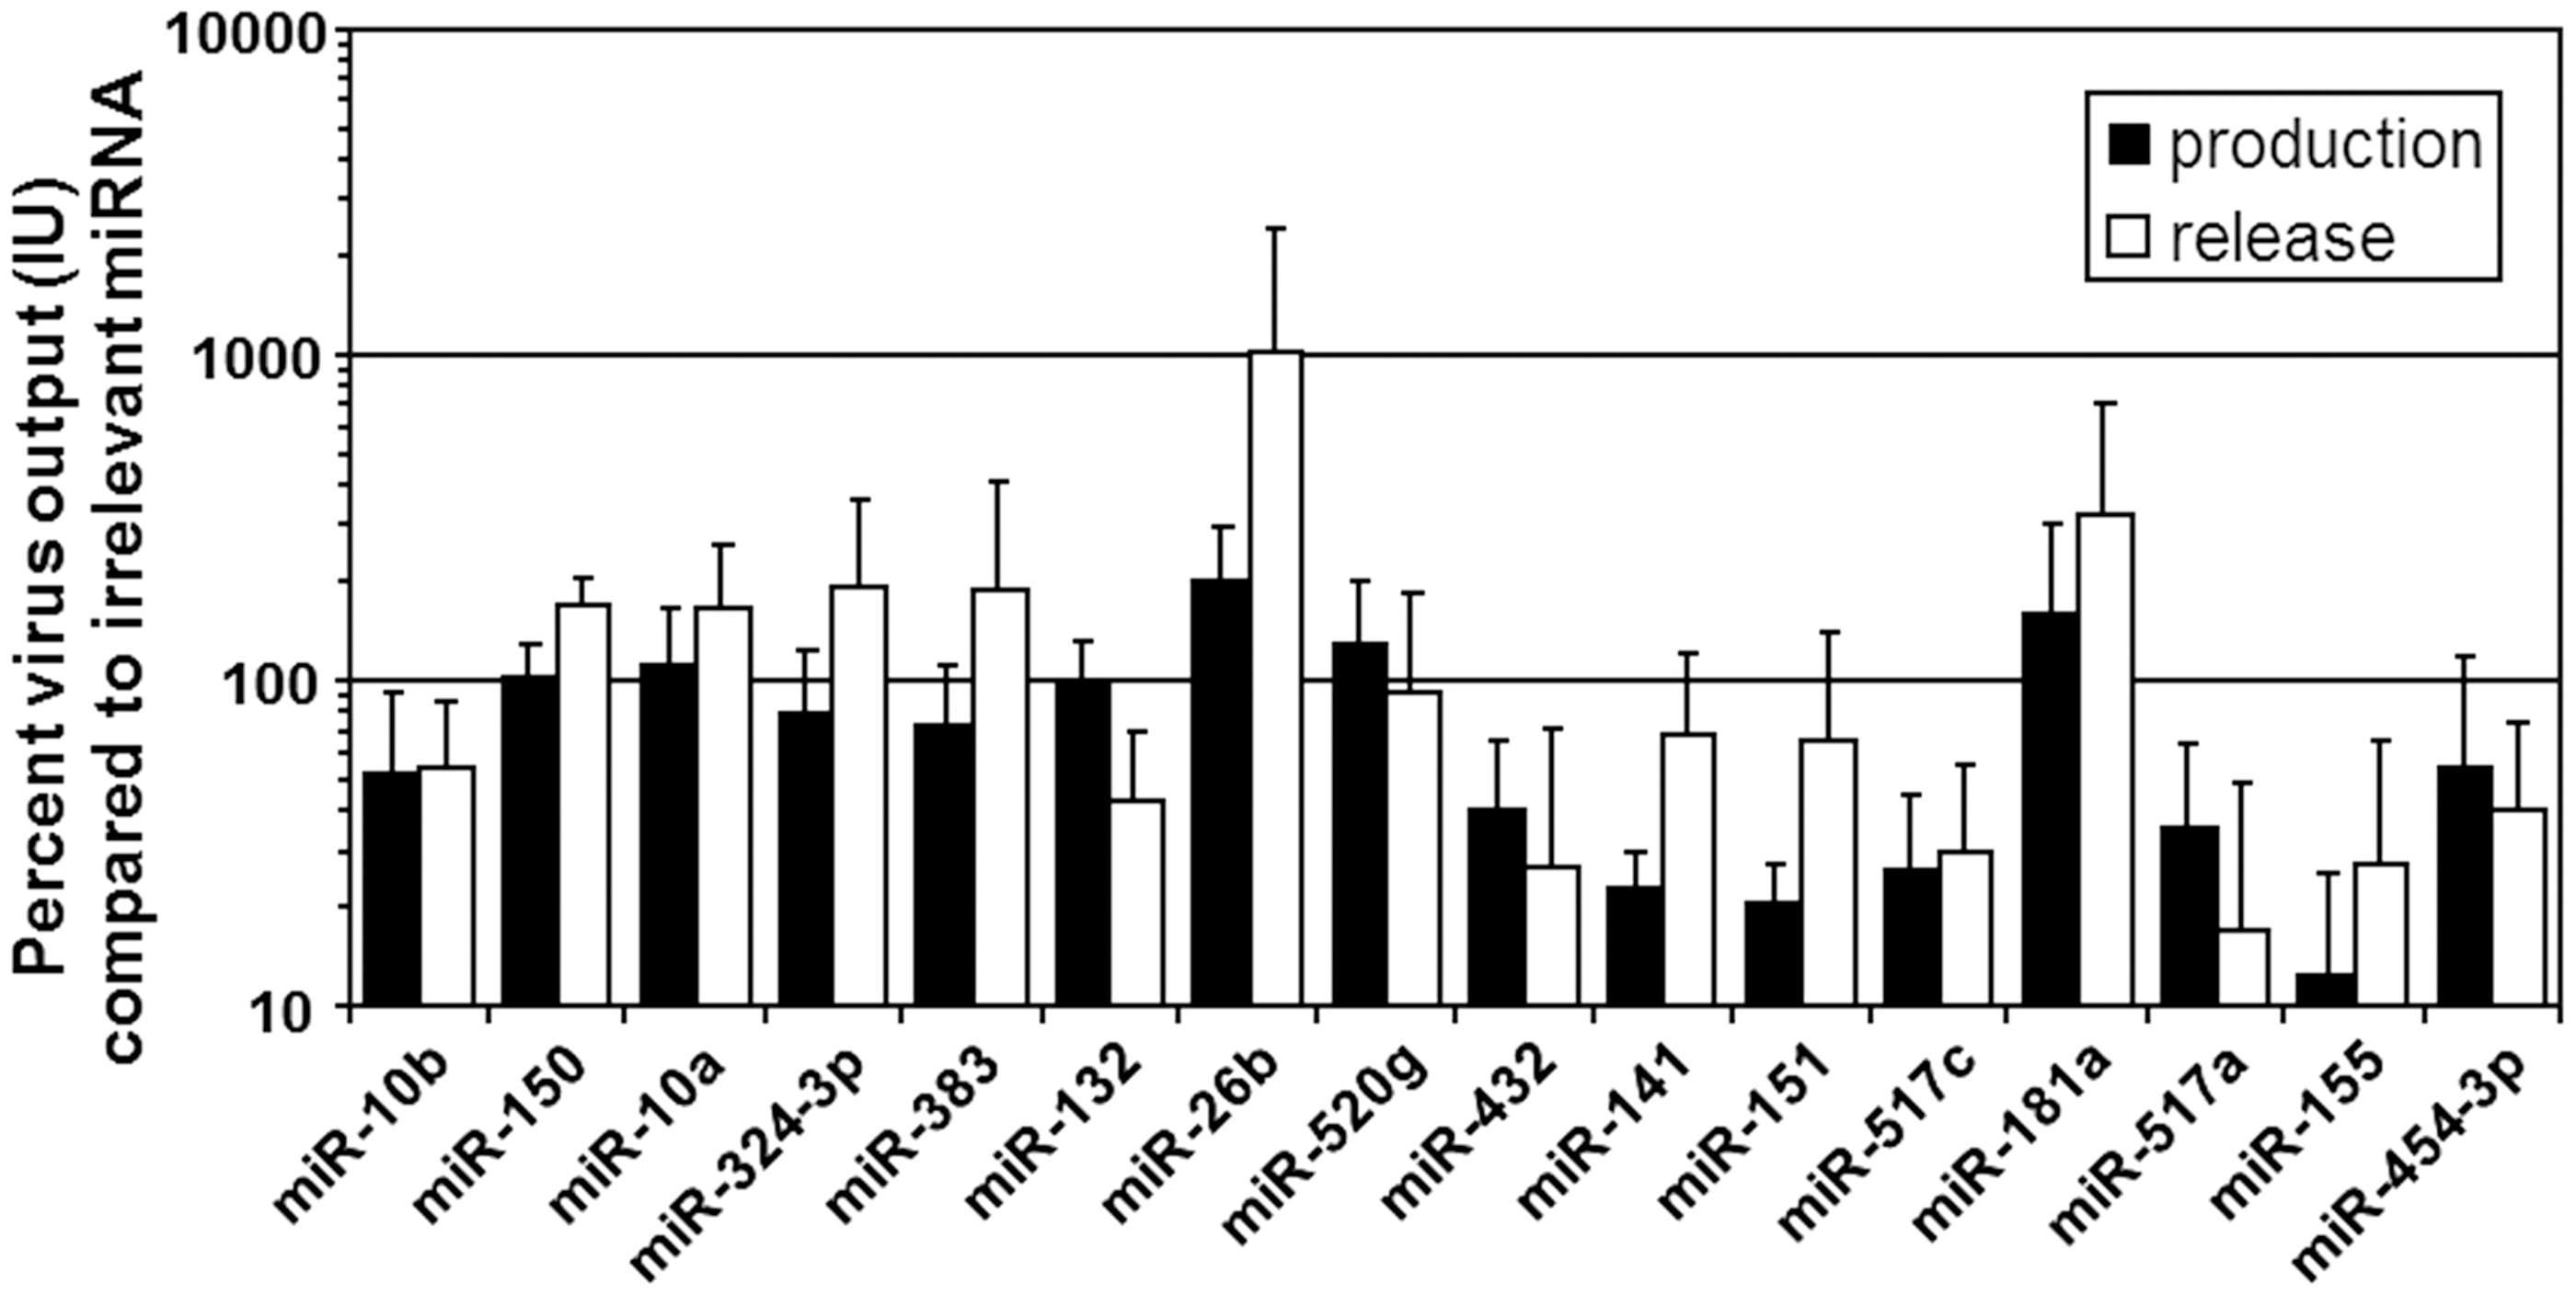
Infectious adenovirus output from adenovirus-infected PC-3 cell cultures. PC-3 cells were transfected with miRNA mimics and infected with recombinant adenovirus AdE1+Luc expressing firefly luciferase. Cell and supernatant fractions were collected separately, and infectious virus titers were determined. Bars show mean percentage + SD virus output compared to control cultures transfected with irrelevant miRNA mimic cel-miR-239b, determined from three to six independent experiments for each miRNA mimic. Black bars show total adenovirus production (cells + supernatant); gray bars show released adenovirus (supernatant only).
Effect of miRNAs on adenovirus progeny propagation
Next, adenovirus propagation and spread in PC-3 cells upon miRNA mimic transfection was investigated. MiRNAs with strong inhibitory effects on virus production and/or release were excluded from this analysis. PC-3 cells were transfected with miRNA mimics and infected with AdE1+Luc at high MOI (propagation cycle 0). After 3 days, cell and supernatant fractions were collected separately. The cell fraction was used to determine infection efficiency by measuring luciferase activity. The supernatant fraction, containing released progeny virus, was diluted and used to infect freshly seeded and miRNA mimic-transfected PC-3 cells (propagation cycle 1). This procedure was repeated for a total of three propagation cycles. The virus expansion was calculated from the luciferase expression and the cumulative supernatant dilutions. As can be seen in Supplementary Fig. S3, most miRNAs had either insignificant effects on the adenovirus life cycle or inhibited adenovirus propagation. In the latter cases, promoting cell death apparently inhibited virus propagation. The exception was miR-26b that promoted adenovirus propagation in PC-3 cells. After three life cycles, AdE1+Luc had expanded to approximately 30-fold higher titers in miR-26b mimic transfected cells than in irrelevant control transfected cells. To independently corroborate and expand this finding, adenovirus propagation was monitored in PC-3, DU145, and 22Rv1 prostate cancer cells with stable retroviral hsa-miR-26b overexpression. To this end, miR-Vec-26b transduced cells and miR-Vec empty vector control cells were infected with AdΔ24.CMV-GFP at various MOI, and cultures were subjected to GFP fluorescence scanning using a microplate cytometer until 7–10 days after infection. Figure 4 shows that PC-3/miR-26b and 22Rv1/miR-26b cells, but less convincingly DU145/miR-26b cells, supported more effective virus spread than did their respective miR-Vec controls. After reaching maximal fluorescence intensity, representing near complete infection of all cells in a culture, fluorescence intensities declined due to extensive cell death. In particular, the increased fluorescence observed at later time points in miR-26b overexpressing cells infected at low MOI supported the conclusion that miR-26b promoted virus propagation and spread.
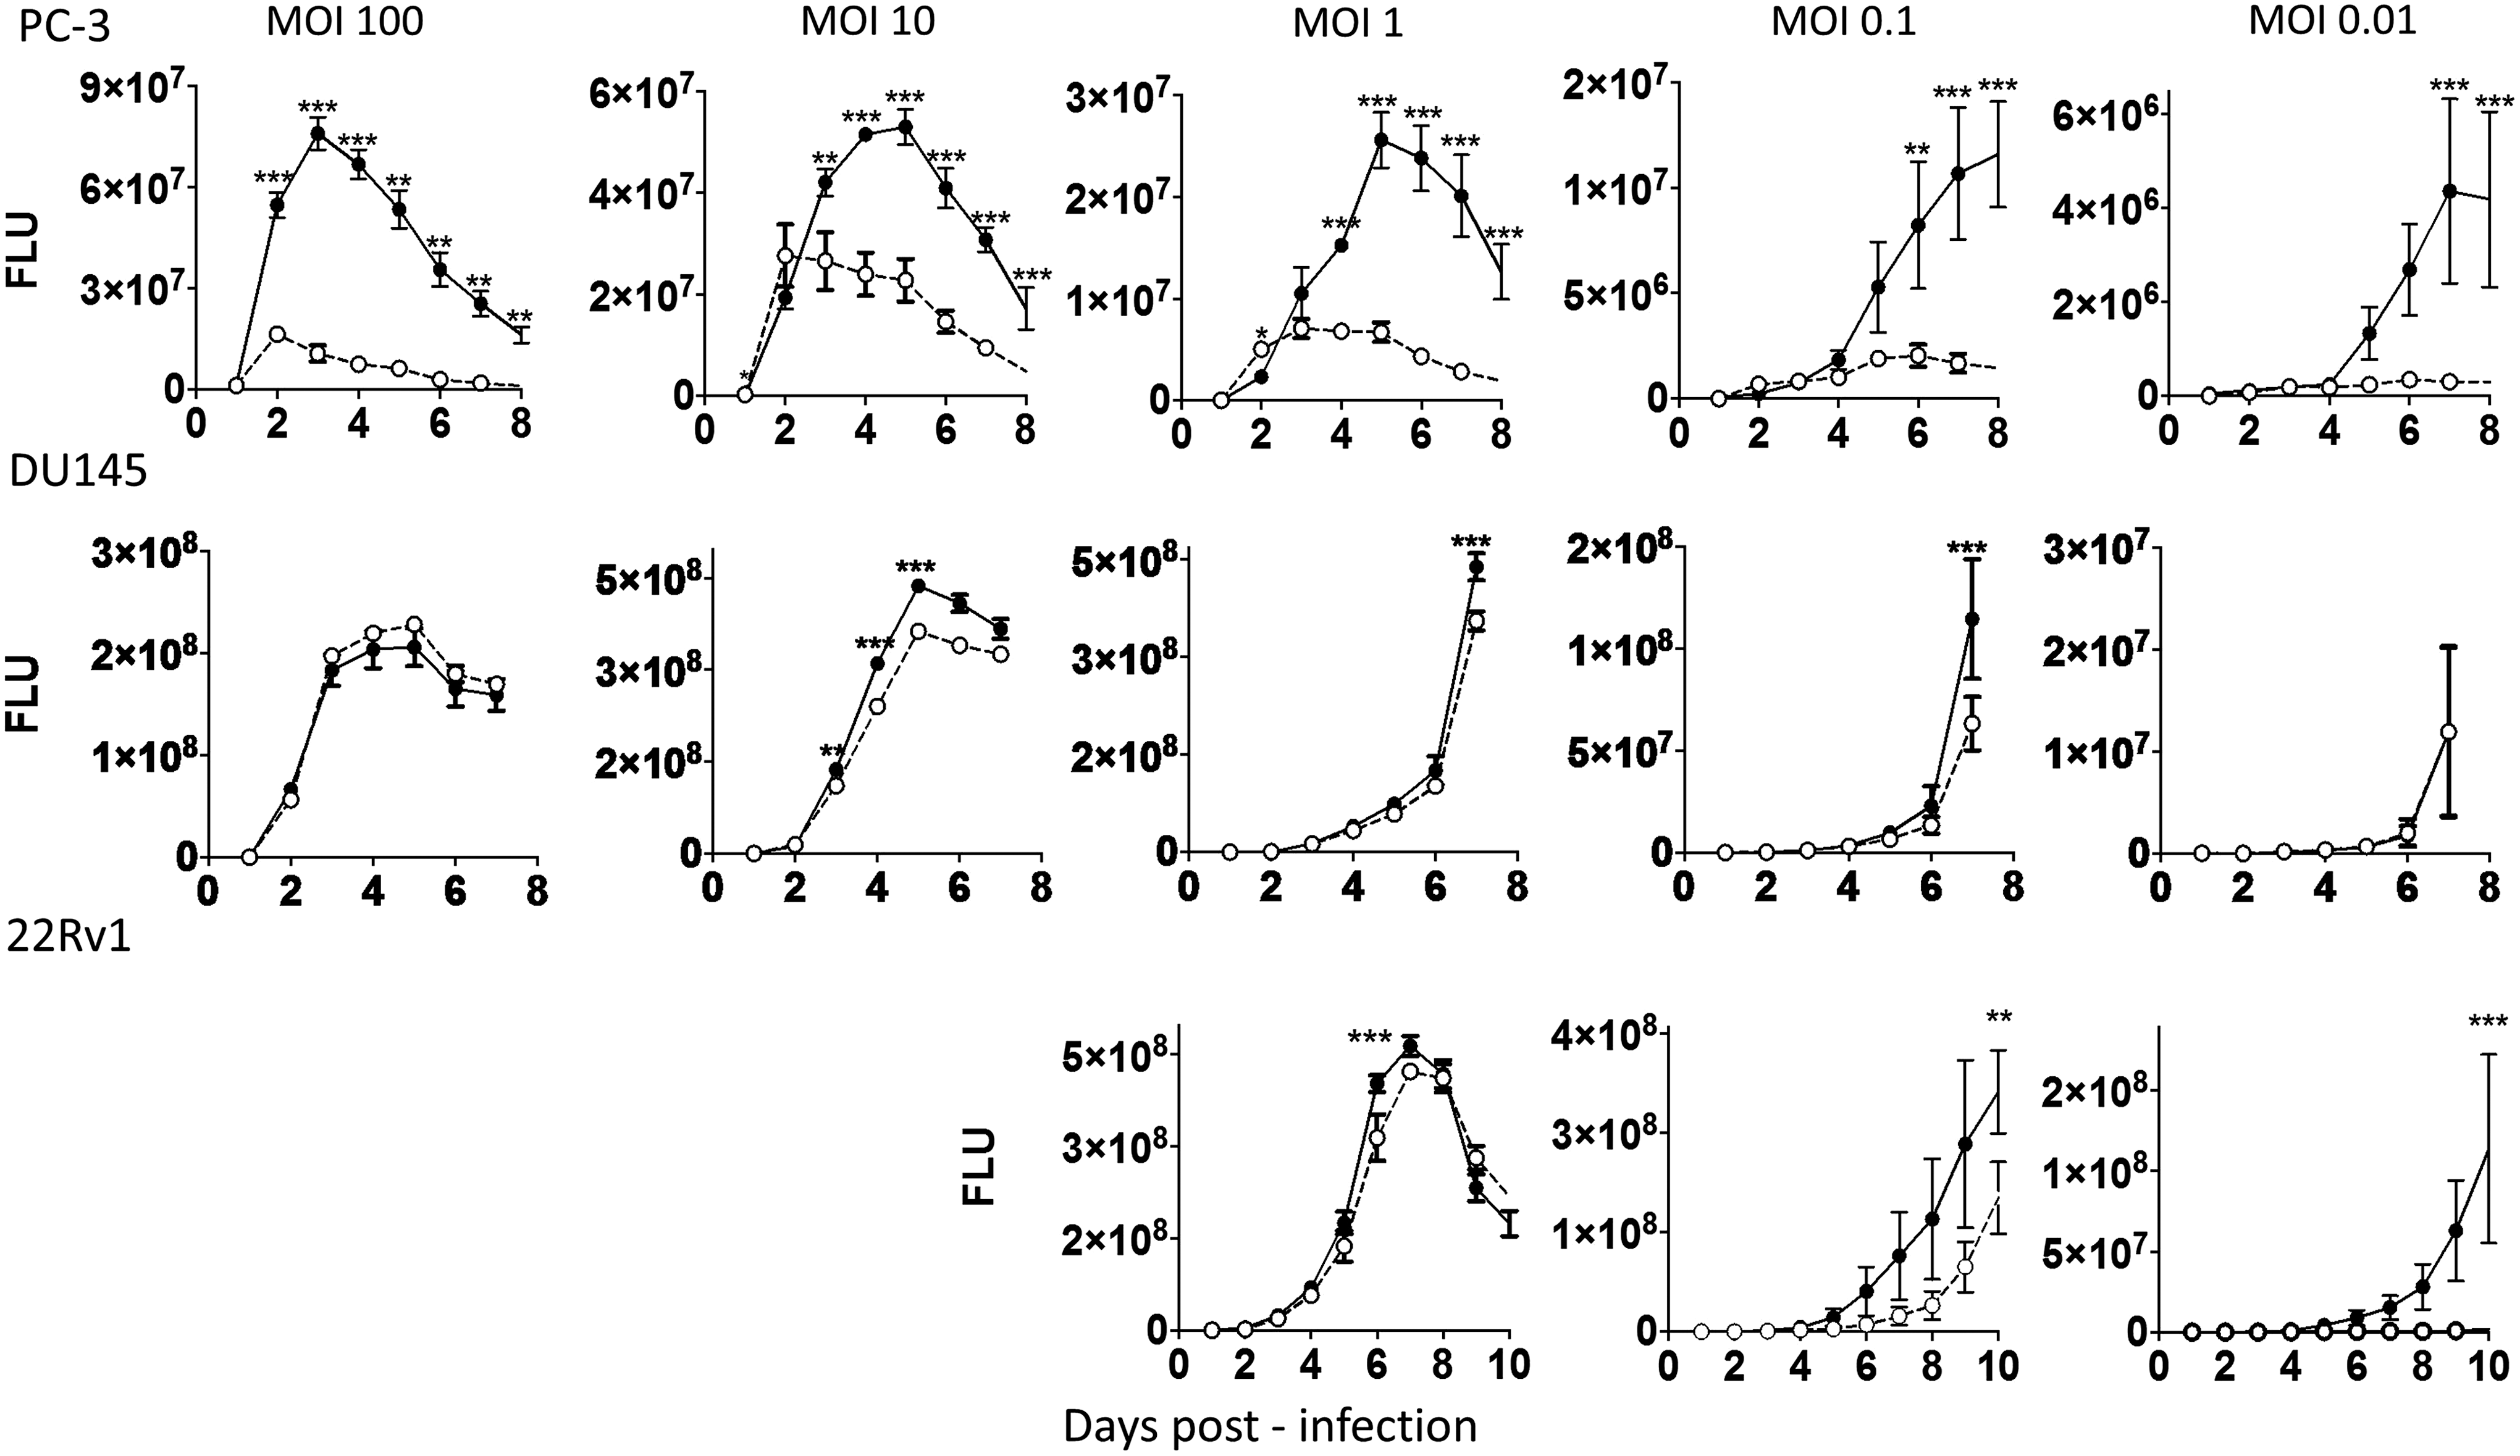
Human miRNA-26b promotes adenovirus propagation in prostate cancer cells. PC-3, DU145, and 22Rv1 prostate cancer cells stable transduced with a retroviral vector expressing miR-26b (closed circles) or an empty vector control (open circles) were infected with AdΔ24.CMV-GFP at the indicated multiplicity of infection (MOI), and cultures were subjected to green fluorescent protein fluorescence laser scanning until 7–10 days after infection. Data shown are mean fluorescence light units ± SD. *p < 0.05; **p < 0.01; ***p < 0.001.
To compare virus spread in a different way, miR-26b overexpressing and miR-Vec control cells were infected with AdΔ24.CMV-GFP at very low MOI, such that on average, less than one plaque per well was formed. GFP-positive plaque formation was monitored by fluorescence laser scanning until 11 days after inoculation. Plaque sizes were quantified by measuring the covered surface area. As can be seen in Fig. 5, for all three prostate cancer cell lines, AdΔ24.CMV-GFP displayed a larger-plaque phenotype on miR-26b overexpressing cells than on miR-Vec control cells. Plaques appeared earlier and reached sizes on average three, four, and 23 times larger on DU-145, 22Rv1, and PC-3 cells, respectively (all three cell lines: p < 0.001).
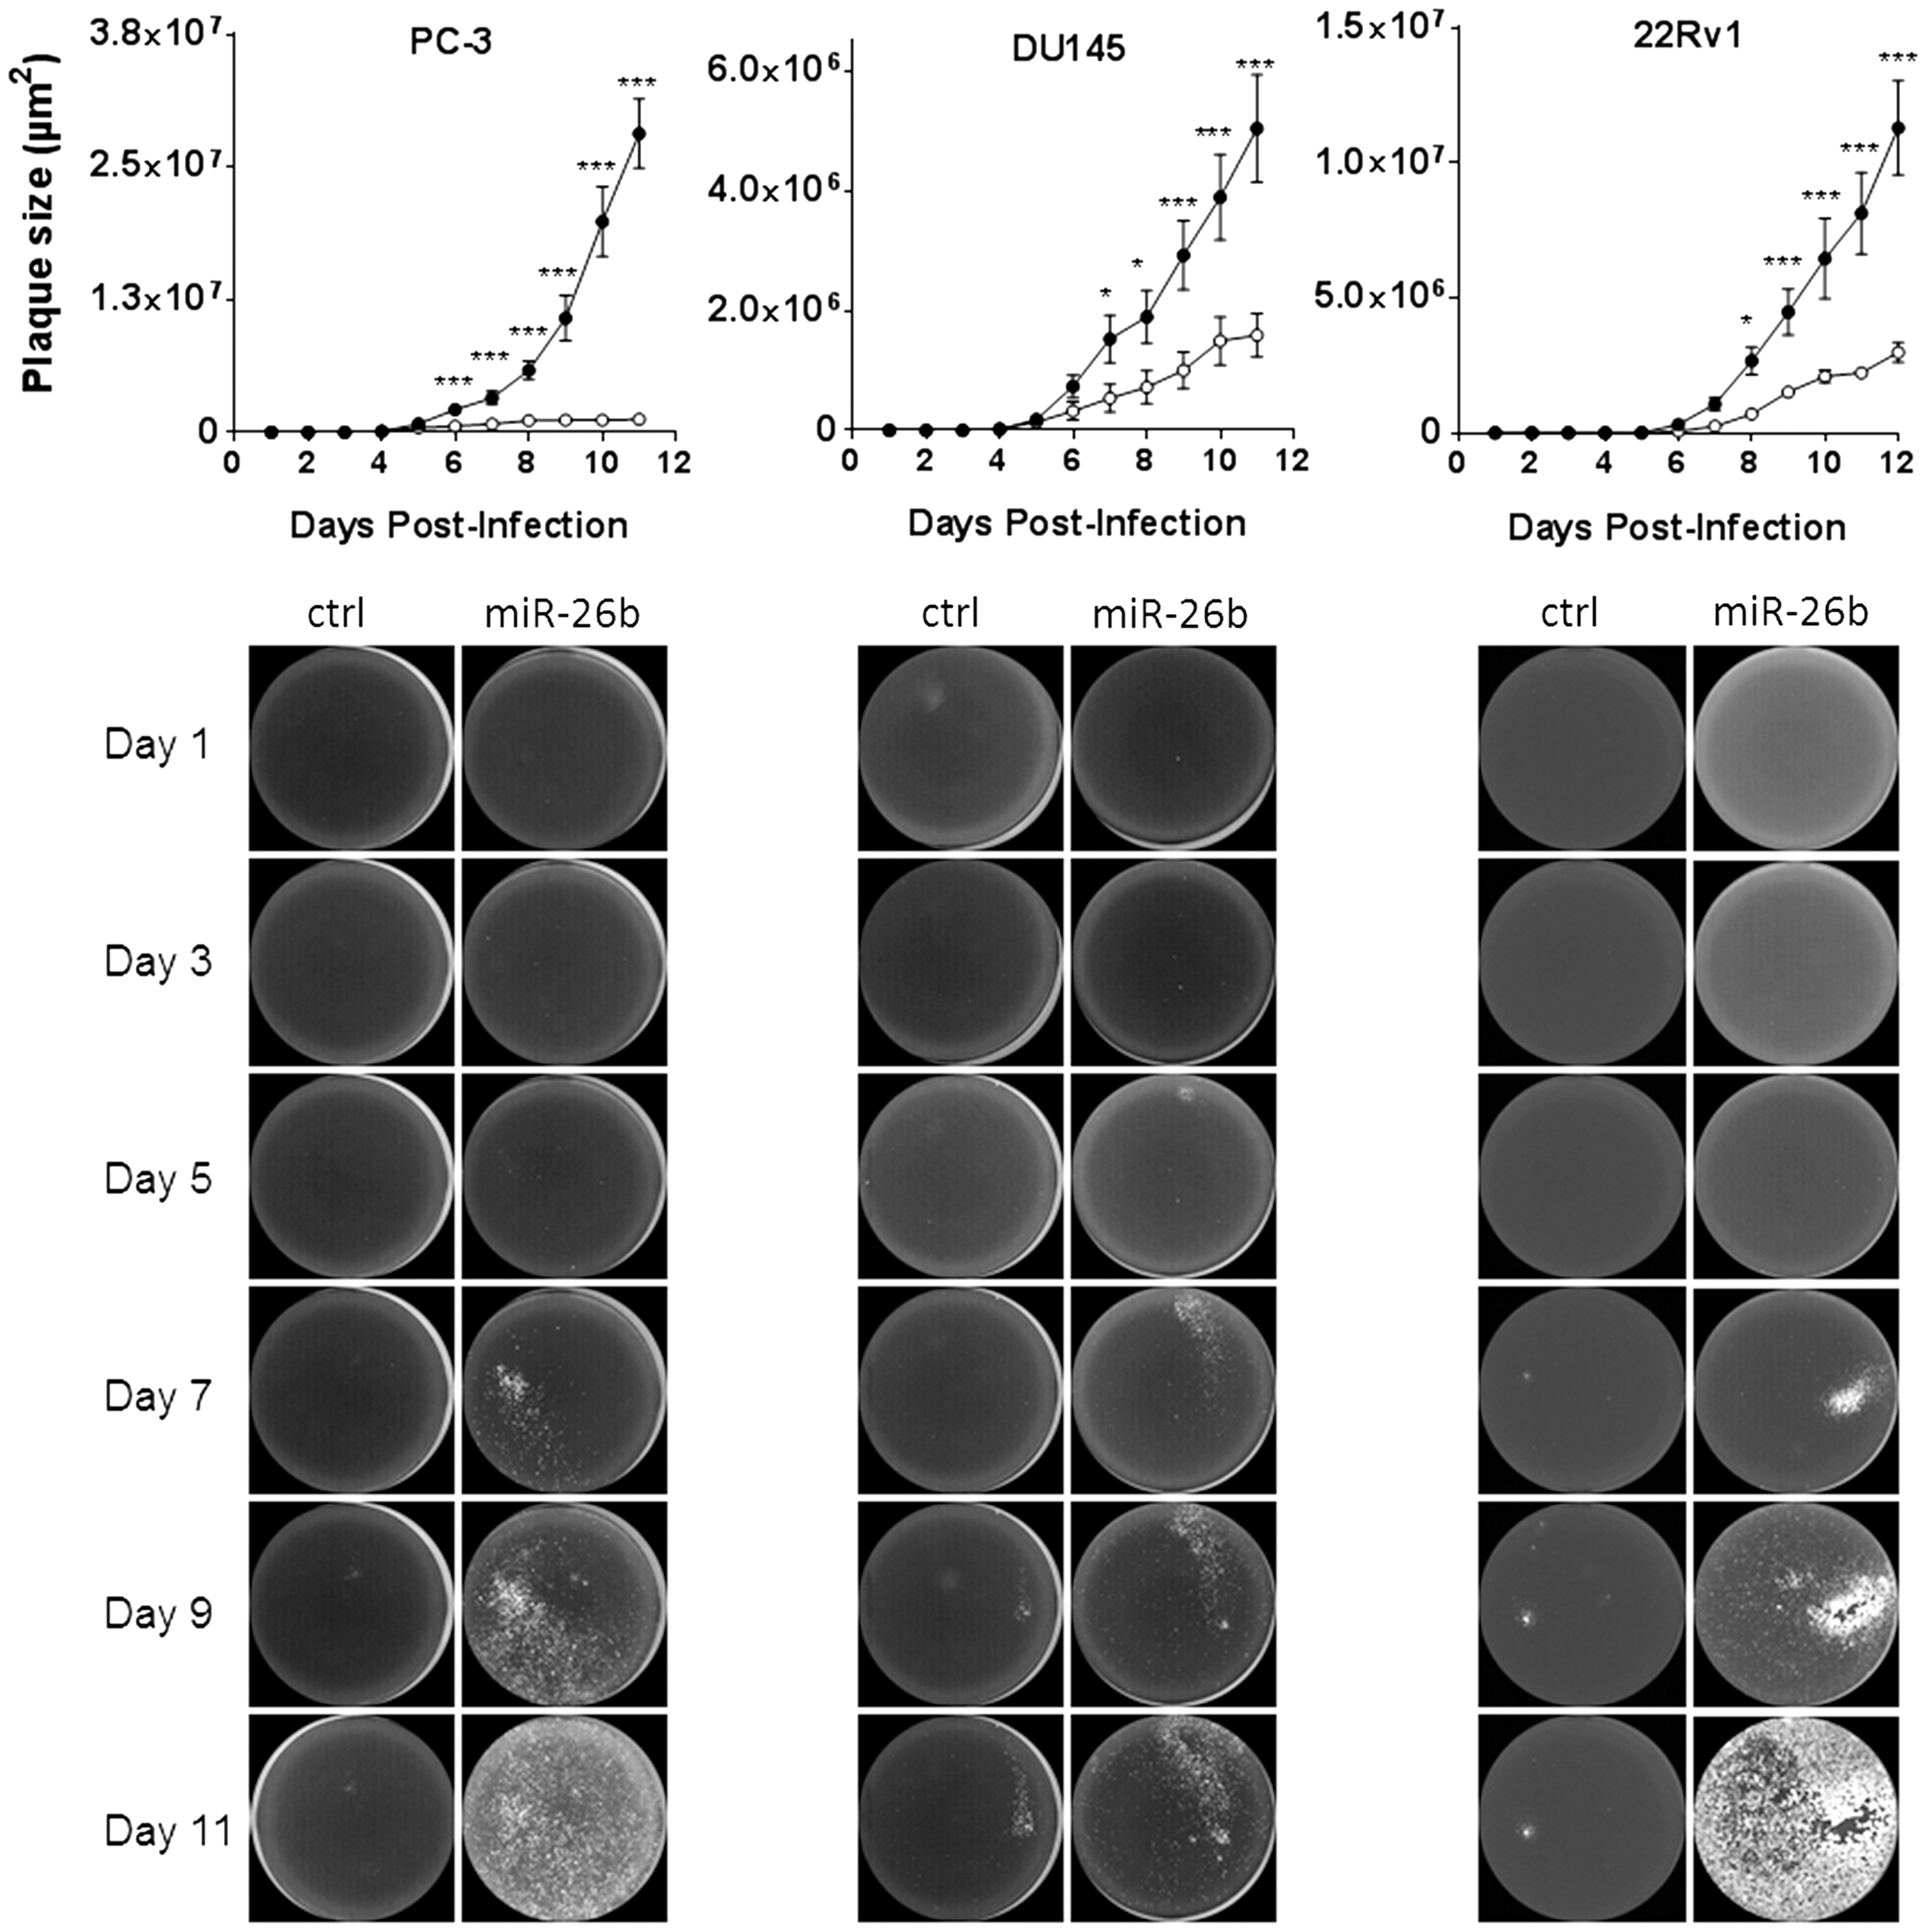
Human miRNA-26b increases adenovirus plaque size in prostate cancer cell cultures. PC-3, DU15, and 22Rv1 cells stable transduced with a retroviral vector expressing miR-26b or miR-Vec empty vector control were infected with AdΔ24.CMV-GFP at low MOI, and cultures were subjected to GFP fluorescence laser scanning until 11 days after infection. Images were analyzed for fluorescent plaque size using ImageJ. Pictures show representative examples of fluorescent plaques analyzed at different days. Graphs depict average fluorescent area sizes ± SD of 20 plaques followed longitudinally on each cell line. *p < 0.05; ***p < 0.001.
MiR-26b inhibits adenovirus-induced NF-κB signaling
To obtain insight in the mechanism of miR-26b-induced adenovirus propagation in prostate cancer cells, the study looked for possible links between validated miR-26b gene targets and adenovirus biology. Interestingly, two studies reported that miR-26 suppresses anti-apoptotic NF-κB signaling via its targets HMGA1, MALT1, TAB3, and TAK. 38,39 Furthermore, inhibition of NF-κB was reported to enhance the cytotoxicity of an oncolytic adenovirus. 40 Therefore, it was envisioned that adenovirus propagation could perhaps be enhanced in prostate cancer cells through miR-26b-dependent NF-κB inhibition. To investigate this, NF-κB signaling was measured in PC-3 cells in response to miR-26b mimic transfection and Ad5 infection. As can be seen in Fig. 6, Ad5 infection caused a dose-dependent induction of NF-κB activity. At low MOIs, this was reduced by miR-26b. Hence, miR-26b counteracted an Ad5-induced cellular pro-survival response. However, as this effect was incomplete and not observed in cells with profound NF-κB activation due to high-dose Ad5 infection, miR-26b probably has other effects on adenovirus propagation as well.

MiR-26b inhibits adenovirus-induced NF-κB signaling in PC-3 cells. PC-3/NF-κB-Luc reporter cells were transfected with miR-26b mimics (black bars) or non-targeting siCONTROL#1 (white bars), and infected with Ad5 at the indicated MOI. Luciferase activity was measured 24 h post infection. Control cultures were treated with 10 ng/mL of tumor necrosis factor alpha for 4 h before luciferase measurement. Data shown are the mean results ± SD of a typical experiment performed in triplicate. Significance of differences between conditions with siCONTROL#1 and miR-26b: *p < 0.05.
Global analysis of host miRNA expression in adenovirus-infected cells
To study natural host responses to Ad5 infection at the miRNA level, endogenous miRNA expression was determined in PC-3 cells before and after infection with Ad5 by massively parallel sequencing (MPS). In total, 1,061 sequences representing unique known mature human miRNAs according to miRBase v19 were identified (Supplementary Table S7). Ad5 infection decreased the total number of reads, which was already evident 6 h post infection and was more prominent at 24 h post infection. This was not unexpected because adenovirus-encoded virus-associated RNAs (VA-RNAs) are processed by the host cell RNAi machinery, thereby competing with endogenous miRNA biogenesis. 41,42 High levels of processed VA-RNAs were detected in Ad5-infected cells (see the Supplementary Data File “Hodzic-Supplementary Data File VA-RNA”). In the late phase of infection, three small RNA species mapping to the Ad5 VA-RNA region together constituted >8.5% of total cellular small RNA content. Specific changes in miRNA expression were therefore determined on normalized data. Thirty-three miRNAs were found differentially expressed before and after Ad5 infection (more than a threefold change; p < 0.05; Fig. 7A and Supplementary Table S8). The few miRNAs that were found induced upon Ad5 infection were miRNAs with very low abundance in control cells. In contrast, suppressed miRNAs included species with a wide range of abundances. To investigate if these changes were specific for PC-3 prostate cancer cells or also induced by Ad5 infection in genetically distinct cells, the same analysis was done on U87MG glioma cells. In these cells, 1,011 unique mature human miRNAs were identified, of which 57 were modulated by Ad5 infection (Supplementary Tables S7 and S8). Interestingly, 12 human miRNAs were suppressed upon Ad5 infection in both cell lines (Supplementary Table S8). The most profound effect was observed for hsa-miR-222-5p, which was >10-fold suppressed upon Ad5 infection in both cell lines.
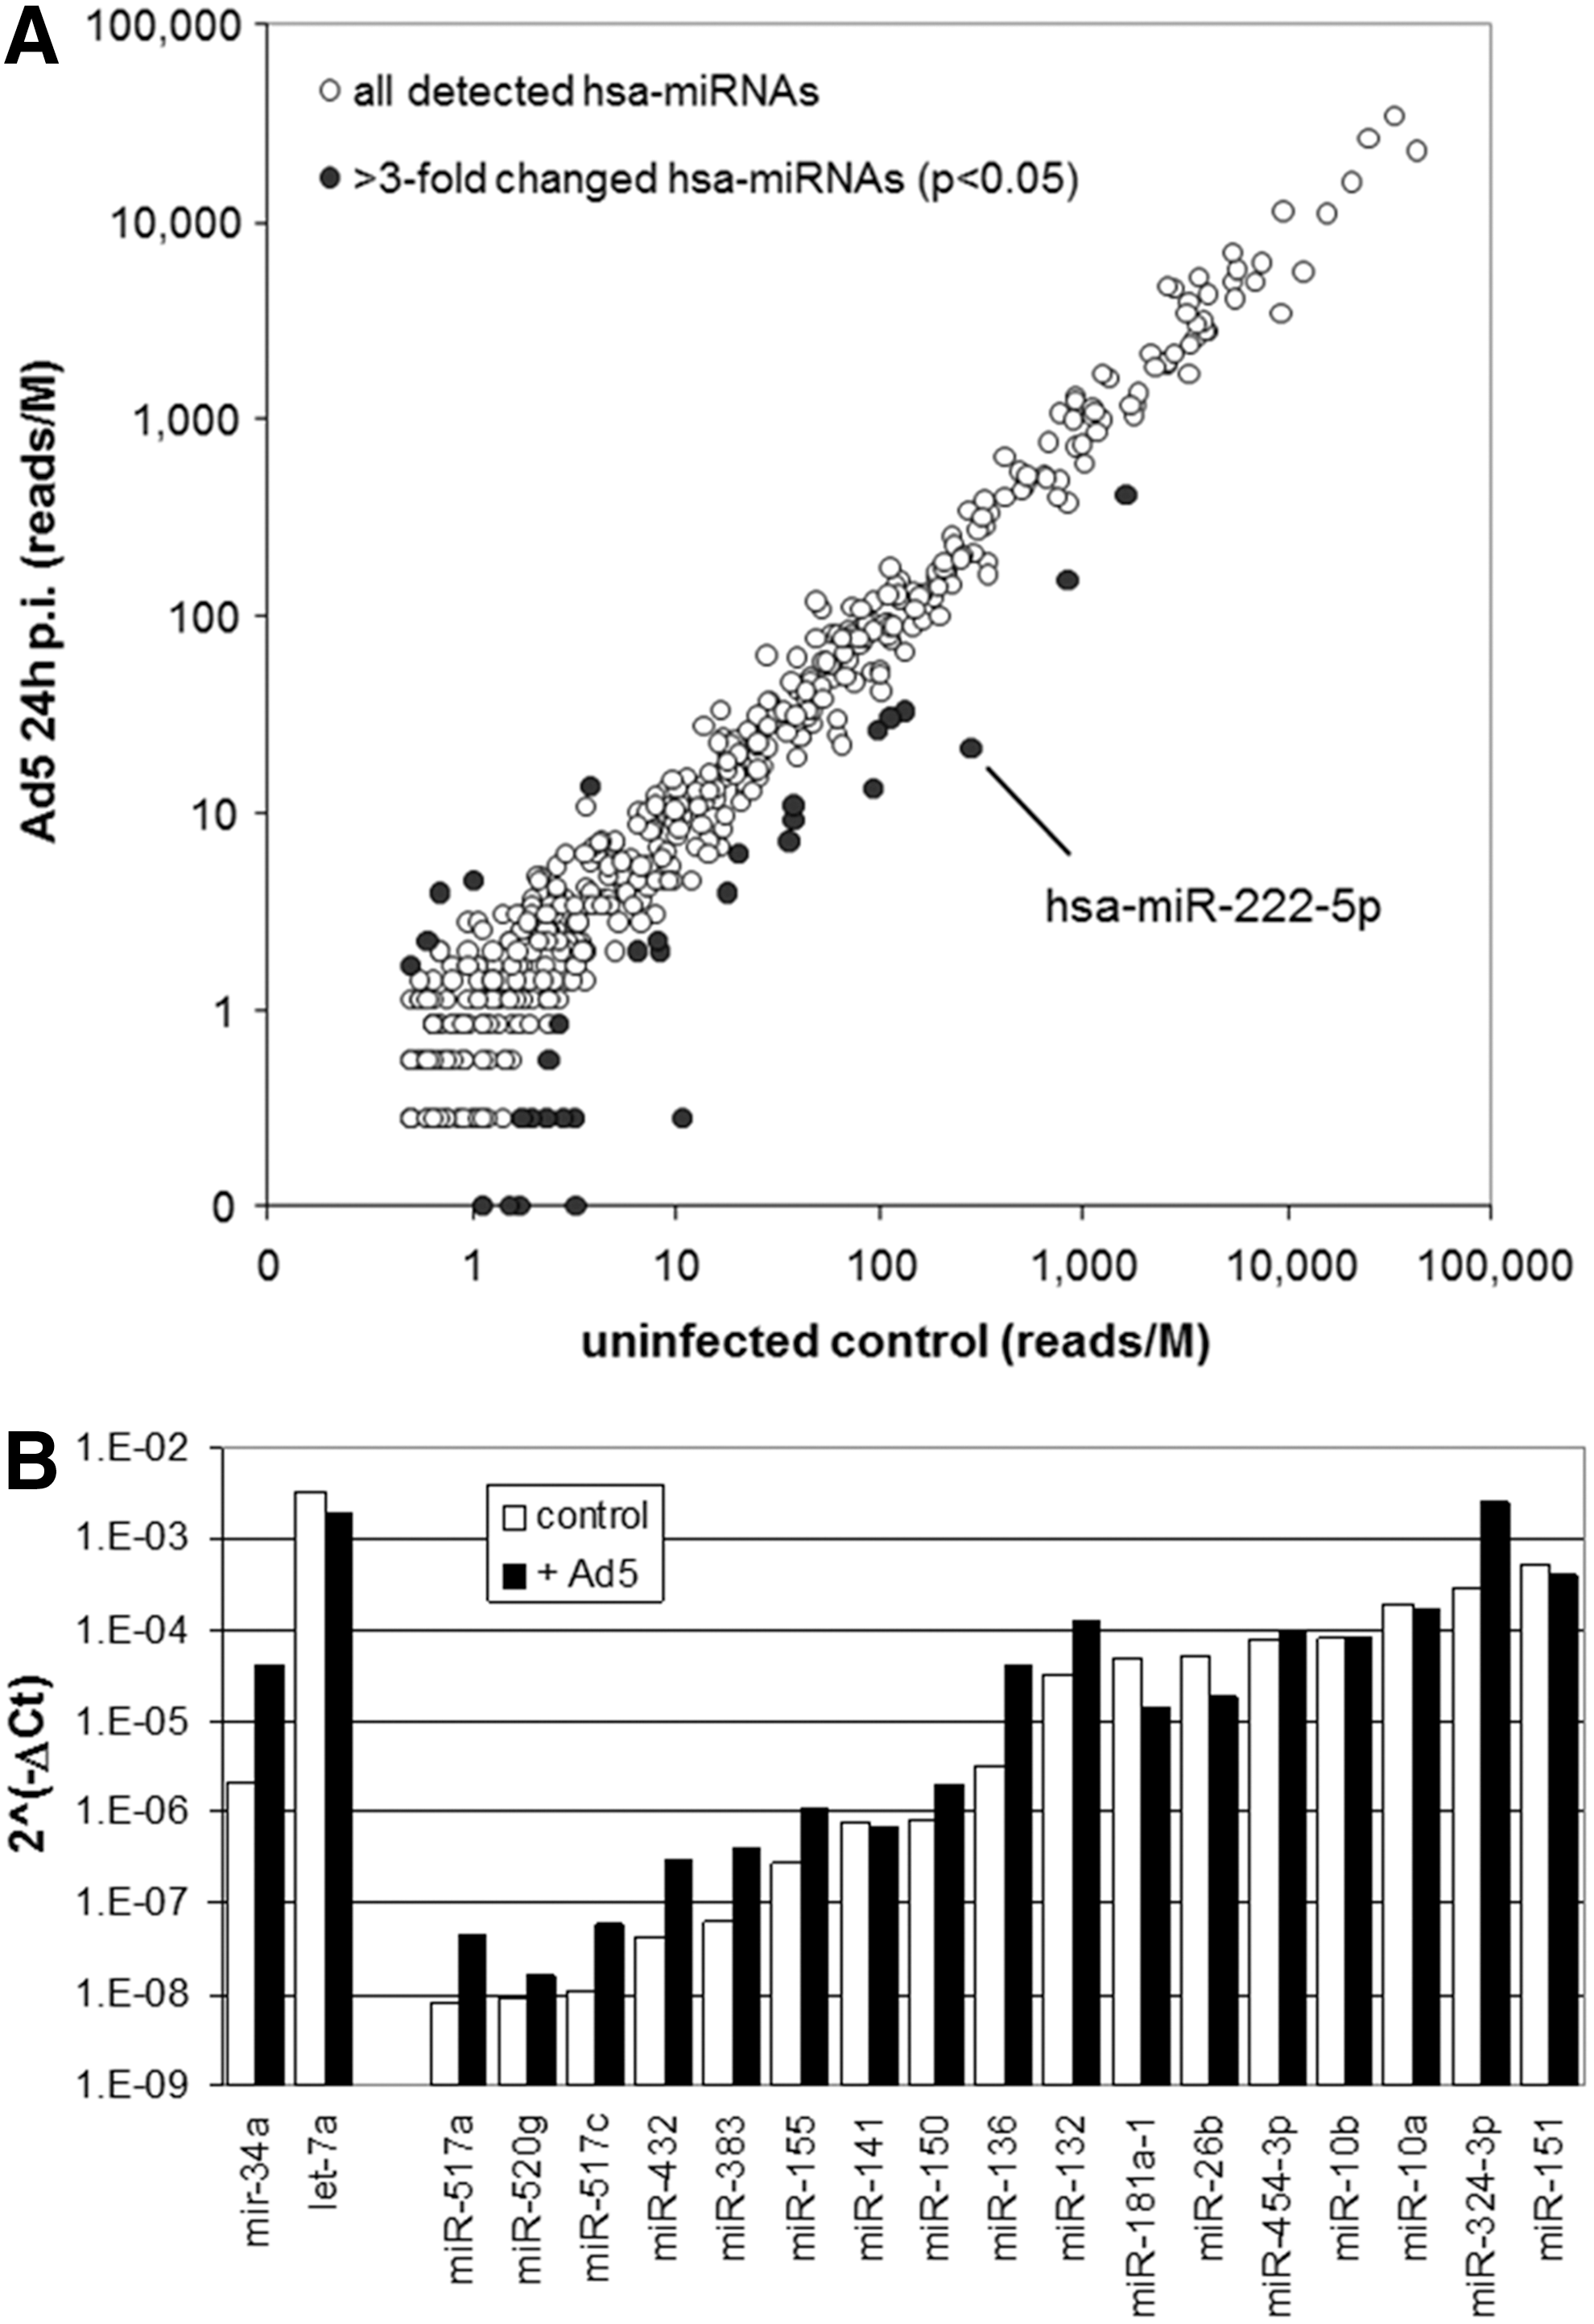
Modulation of human miRNA expression in adenovirus-infected PC-3 cells. (
The MPS data of the 17 miRNAs that were identified to promote Ad5-induced PC-3 cell death in the functional screen revealed that these were either not expressed in PC-3 cells at detectable levels or their expression was not significantly changed by Ad5 infection. To confirm the MPS results independently, expression of these 17 miRNAs was also determined in PC-3 cells before and after Ad5 infection using a real-time PCR method. Let-7a and miR-34a, confirmed by the MPS experiment to be high and low expressed in PC-3 cells, respectively, were included as controls; and U6 small-nucleolar RNA was used as internal reference for normalization. The relative amounts of miRNAs that could be detected by MPS as well as real-time PCR were only fairly consistent (Supplementary Fig. S4). Figure 7B shows that eight tested miRNAs were induced by Ad5 infection (4- to 13-fold). Most of these were scarce miRNAs that were below detection or below the limit set for reliable quantification in the MPS experiment. The exceptions were the abundantly expressed hsa-miR-132-3p and hsa-miR-324-3p. Sensitization to Ad5-induced cell death by miRNA mimic transfection did not correlate with either baseline endogenous miRNA expression or induction or repression of endogenous miRNA expression upon Ad5 infection (Spearman rank correlation: r = −0.25 and r = 0.31, respectively). Interestingly, however, among the tested miRNAs, hsa-miR-26b and hsa-miR-181a-5p were unique in that their expression was reduced (approximately threefold) upon Ad5 infection, as measured by real-time PCR. Although MPS had not revealed a significant change in the relative presence of these miRNAs in PC-3 cells, MPS did show a significant decrease in hsa-miR-26a and hsa-miR-181a expression in U87MG cells and of hsa-miR-181b expression in both PC-3 and U87MG cells (see Supplementary Table S8). Hence, overall, the miR-26 and miR-181 families were found suppressed upon Ad5 infection. This is intriguing given the observation that miR-26b and miR-181a mimic transfection increased virus progeny release and miR-26b promoted virus propagation.
Discussion
This study analyzed human miRNA expression in Ad5-infected cells and performed miRNA mimic and inhibitor screens on human prostate cancer cells to identify miRNAs that affect adenovirus propagation. Apart from the fundamental knowledge gained in these studies, the findings might provide new therapeutic opportunities for effective treatment of cancer with oncolytic adenoviruses. This could be done, for example, by combined treatment with an oncolytic adenovirus and a miRNA mimic. Alternatively, and preferably, a mimic could be incorporated in the adenovirus genome and expressed upon delivery to cancer cells. Of note, oncolytic adenoviruses have already been used as effective delivery platforms for short hairpin RNA molecules. 43 –45 Thus, therapeutic expression of miRNA precursor molecules from the adenovirus genome during replication in cancer cells seems feasible.
Ad5-infection was associated with a general reduction of host cell miRNA expression. On top of this nonspecific interference with miRNA biogenesis, several miRNAs were found specifically reduced in two different Ad5-infected cell lines. These miRNAs could thus perhaps be involved in antiviral host responses that are selectively suppressed by Ad5. Interestingly, most prominently suppressed miR-222 was also found downregulated in cytomegalovirus-infected lung fibroblasts, Epstein–Barr virus–positive B-cell lymphomas, human papillomavirus type 16–positive head and neck squamous carcinoma cell lines, Kaposi sarcoma–associated herpesvirus (KSHV)–infected endothelial cells, and hepatitis B virus–positive hepatocellular carcinoma cells. 46 –50 Other examples of miRNAs with reduced expression in Ad5-infected cells that were previously also found suppressed in cells infected with different viruses were miR-27, miR-100, miR-155, and miR-181. 47 –49,51 In contrast, induction of miRNA expression was rare. Remarkably, the subset of miRNAs found to sensitize PC-3 cells to Ad5-induced cell death was enriched for miRNAs with low endogenous expression in PC-3 cells and increased expression upon Ad5 infection. In this respect, it is interesting to note that miR-132 was among these miRNAs. Hsa-mir-132 was previously found induced upon infection of human monocytes with KSHV, herpes simplex virus-1, or human cytomegalovirus. 52 This suppressed innate antiviral immunity, thus facilitating viral replication. It is tempting to speculate that the repression of miR-222 and induction of miR-132 expression by Ad5 observed herein could be new examples of the striking parallels in virus–host cell interactions that have been discovered between different viruses. 53,54
Functional screens allowed miRNAs that stimulated Ad5-induced cell death to be identified. Several of these miRNAs interfered with late adenovirus gene expression and/or viable virus progeny. Thus, in cells with high expression of these miRNAs, premature cell death appears to interfere with completion of the adenovirus life cycle. Nevertheless, delayed exogenous expression of these miRNAs could perhaps potentiate oncolytic adenovirus-induced cell death without inhibiting adenovirus propagation. As expression of a miRNA precursor molecule from the oncolytic adenovirus genome is expected to result in delayed accumulation of mature miRNA duplex molecules compared to transfecting miRNA mimics, this could still be a viable option. However, flexibility in adenovirus administration and miRNA expression would be more attractive. In this respect, miR-10a could be considered for use in combination with oncolytic adenovirus because this miRNA did not inhibit adenovirus propagation and spread in prostate cancer cells and was among a set of miRNAs that sensitized PC-3 cells to Ad5-induced cell death without appreciably affecting cell viability per se. MiR-10a thus probably influenced adenovirus biology rather than host cancer cell biology, causing more effective cell killing.
Most importantly, miR-26b exhibited all properties that make this miRNA particularly useful in combination with oncolytic adenovirus. MiR-26b enhanced adenovirus-mediated cancer cell death, increased adenovirus progeny release, and promoted adenovirus propagation and spread. These observations were unexpected, as miR-26b was abundantly expressed in uninfected PC-3 cells, and Ad5 infection appeared to cause a modest reduction of this miRNA. On the basis of miRNA expression profiling, one would thus assume that miR-26b expression in PC-3 cells is not a limiting factor for adenovirus replication and could perhaps even be inhibitory. This illustrates that the relevance of host miRNAs for virus replication is difficult to deduce from expression profiling studies and prior knowledge of adenovirus biology. Instead, functional interrogation is required to reveal relevant virus–host interactions. Interestingly, miR-26 expression is downregulated in many tumor types, and miR-26 is considered a tumor suppressor miRNA in these cancers (reviewed by Gao and Liu 55 ). In the particular case of human prostate cancer, miR-26b expression was reported to be reduced, at least in part in response to myc oncogene expression, and transfection of miR-26b mimics into prostate cancer cell lines suppressed their proliferation. 56 Exogenous expression of miR-26b from an oncolytic adenovirus genome is thus expected to be safe and perhaps even therapeutic. In fact, systemic delivery of miR-26a, which shares the same seed sequence with miR-26b and is thus predicted to repress the same target genes, by means of a replication-defective adeno-associated virus vector was already shown to protect from disease progression in a mouse liver cancer model. 57 Exogenous expression of miR-26b could perhaps also contribute to cancer-selective replication of oncolytic adenovirus, as miR-26 expression is involved in blocking G1/S-phase progression via repression of CDK6 and cyclin E1 causing reduced phosphorylation of pRb. 58 This would be particularly relevant for oncolytic adenoviruses with selective replication properties depending on pRb pathway deregulation, such as viruses with the E1AΔ24-mutation. 31,59 In healthy cells with an intact pRb pathway, miR-26 expression is expected to inhibit S-phase entry, thereby further restricting adenovirus replication, while in cancer cells, miR-26 would exert the adenovirus propagation-promoting effect observed herein. Interestingly, it was found that miR-26b mimics reversed Ad5-induced NF-κB signaling. This could counteract the pro-survival response in infected cells, thus contributing to a more effective viral release and spread, providing at least partial explanation for the stimulatory effect of miR-26b on Ad5 propagation in cancer cells.
Taken together, miR-26b was identified here as the most promising candidate miRNA to be combined with oncolytic adenovirus treatment for prostate cancer and perhaps other cancer types. Studies defining optimal combination treatment schedules or expression cassette formats to be incorporated in the viral genome are warranted.
Footnotes
Acknowledgments
The authors thank Christie Vermeulen (Department of Medical Oncology, VUmc, Amsterdam) for help with the screen data processing, Paul Eijk (Department of Pathology, VUmc, Amsterdam) for setting up the MPS miRNA sequencing workflow, and Tarun Gupta, Hendy Kristyanto, Esther Gil Vazquez, and Max Klatser for acquisition of data as part of their student internships at the VUmc Laboratory Medical Oncology. This work was supported by the Stichting VUmc-CCA.
Author Disclosure
A.V. is employed by Dharmacon, and some materials used in this study are products sold by Dharmacon. No competing financial interests exist for the remaining authors.
References
Supplementary Material
Please find the following supplemental material available below.
For Open Access articles published under a Creative Commons License, all supplemental material carries the same license as the article it is associated with.
For non-Open Access articles published, all supplemental material carries a non-exclusive license, and permission requests for re-use of supplemental material or any part of supplemental material shall be sent directly to the copyright owner as specified in the copyright notice associated with the article.