
Abstract
The leptin gene was transferred into the liver of streptozocin- and high fat diet–induced type 2 diabetic (T2D) mice by hydrodynamic-based gene delivery. The food intake, water consumption, glucose concentration, and triglyceride and total cholesterol levels of T2D mice were significantly decreased. Meanwhile, plasma leptin was remarkably increased after gene transfer for 2, 3, 5, and 7 days, while plasma adiponectin was also significantly increased at day 2. To understand the mechanism of action of leptin on T2D mice, gene expressions related to glycometabolism and energy metabolism in the liver, epididymal adipose tissue, hypothalamus, and muscle were measured. The mRNA expression levels of adiponectin receptor 1 (ADR1), glucose transporter 4 (GLUT4), glucose-6-phosphase, and peroxisome proliferator-activated receptor γ in the liver, leptin, adiponectin, and hormone-sensitive lipase in adipose tissue, leptin, leptin-receptor, ADR1 in the hypothalamus, and ADR1, GLUT4, and insulin 1 in the gastrocnemius significantly increased. Moreover, the hepatic glycogen of the leptin-gene-treated group was significantly increased in comparison to the control group. Meanwhile, the significant decrease of forkhead box O1, adiponectin receptor 2, and peroxisome proliferator-activated receptor α in the liver, and agouti-related protein and proopiomelanocortin genes in the hypothalamus were also observed. In fat tissue and hypothalamus, leptin and adiponectin protein levels were also significantly increased, whereas the neuropeptide Y protein level was significantly decreased. These results indicated that the leptin gene transfer could improve the symptoms of T2D mice by regulating the leptin–hypothalamus signaling pathway and improving the insulin resistance of the peripheral tissues of T2D mice.
Introduction
W
Leptin is one kind of hormone derived from adipose tissue. It relates neuroendocrine and immune functions with nutritional status. 3 It is essentially produced by adipose tissue, and is also secreted at lower levels by the stomach, skeletal muscle, and placenta. 4 The weight-loss effects of leptin are regulated through the leptin receptor in the hypothalamus. 5,6 The leptin receptor is a member of the class I cytokine receptor family 7 –9 and is expressed in the hypothalamus to regulate food intake and body weight. It is also expressed in pancreatic β cells, endothelial cells, bone-marrow precursors, macrophages, and lymphocyte, and some evidence implicates leptin signaling in immune function. 7 –11 After leptin receptor activation, signal transducers and activators dimerize in the hypothalamus and translocate to the nucleus where specific gene responses are caused. These genes contain neuropeptides, which regulate food intake, body weight, and energy expenditure, such as neuropeptide Y (NPY) and agouti-related protein (AgRP). 12 –15
Since insulin was discovered at the beginning of the 20th century, the research emphasis of glucose metabolism regulation focused on insulin secretion and the action peripheral tissues such as muscle, the liver, and adipose tissue. For more than 40 years, research results explained that obesity is related to insulin resistance, and insulin resistance is a basic property of T2D. In fact, the brain plays an important role in controlling blood glucose, 16 especially given that leptin and insulin act on their respective receptors expressed in the brain to control glucose metabolism, energy balance, and autonomic function. 16 –18 Recently, some evidence has been reported that leptin is successfully used to treat insulin resistance and hepatic steatosis in patients with low circulating leptin levels. 19,20 Leptin can alleviate diabetes via inhibition of the hypothalamic–pituitary–adrenal axis. 21 Moreover, intracerebroventricular administration of leptin can normalize blood glucose levels in streptozocin (STZ)-induced diabetic rats. However, the same dose peripherally administrated did not lower the glucose level of STZ diabetic rats. 22 –25 Unfortunately, intracerebroventricular administration is dangerous and complex, and it is difficult to use in clinical treatment. Thus, the peripherally administered gene transfer method was used, with the expectation that a similar effect would be produced with low risk and cost.
In previous studies, leptin gene transfer was used with hydrodynamic-based gene delivery (HD) to investigate the effects of leptin on body weight, fibromuscular development, and lipid deposition in muscle. 26 –28 In the present study, the same method was used to study the anti-diabetic effect of leptin on T2D mice and the mechanism of action in vivo. Here, it is reported that leptin gene transfer improves the symptoms of T2D mice by regulating the leptin–hypothalamus signaling pathway and improving insulin resistance in peripheral tissues.
Materials and Methods
Experimental animals and construction of T2D mice
ICR male mice (aged 5 weeks) were used as experimental animals. They were kept at 23 ± 1°C with a 12 h/12 h light/dark cycle in a clean room. They were fed with a high-fat diet (SLRC, Shanghai, China) and water ad libitum for 5 weeks and continuously injected with STZ intraperitoneally at a dose of 40 mg/kg for 3 days after fasting. Next, the mice were continuously fed with a high-fat diet for 2 weeks, and fasting blood glucose was measured with a glucose meter (Andon Health, Tianjin, China). Mice whose blood glucose concentrations were >12 mmol/L were considered diabetic mice. Twenty diabetic mice for a single test were randomly divided into control and leptin-treated groups, and received gene transfer with HD. This experiment was repeated twice. In the experimental period, the mice were cared for under the Guidelines of Animal Experimentation outlined by the Committee of Experimental Animal Care, Zhejiang University (permit number: ZJU20160437).
Preparation and purification of pVRmob and pVR vector
The expression vector, pVRmob, was constructed by substituting the mouse leptin gene excised from pBluescript-mob (provided by Dr. J.M. Friedman, Rockefeller University, New York, NY) for the mouse erythropoietin gene in pVRmEPO (provided by Dr. J.M. Leiden, University of Chicago, Chicago, IL) through restriction and ligation reactions. This vector contained the cytomegalovirus promoter, bovine growth hormone gene polyadenylation signal, and kanamycine gene. Preparation and purification of the plasmid were performed as in a previous study. 26 Briefly, Escherichia coli containing pVRmob vector or pVR empty vector was amplified in liquid broth in a shaker at 37°C overnight. Subsequently, the large plasmid DNA was prepared, and bacterial endotoxins were removed with an Endo Free Plasmid Maxi Kit (Qiagen, Shanghai, China). Then, the plasmid DNA concentration was measured using a nucleic acid and protein analyzer (Eppendorf, Hamburg, Germany).
HD
As described in a previous study, 25 μg of DNA (pVR empty vector, pVRmob expression vector) was smoothly injected into the tail vein of each mouse, finishing this process within 10 s. 26,27 During the following week, the food intake, water consumption, body weight, and fasting glucose concentration of the mice were recorded. At designated time points, blood was taken for plasma leptin, adiponectin, and other biochemical indicator analyses. By the end of the experiment, treated mice were killed by neck dislocation, and the liver, heart, kidney, epididymal white fat, pancreas, and hypothalamus were taken, weighed, and stored at −30°C for analysis.
Enzyme-linked immunosorbent assay
Plasma samples at 0, 2, 3, 5, and 7 days after gene transfer by HD were obtained by centrifuging the blood at 13.8 × 10³ g at room temperature for 20 min and storing at −30°C until analysis. Plasma leptin and adiponectin, the leptin of adipose tissue and the hypothalamus, were measured using commercially available mouse leptin (Westang Bio-Tech, Shanghai, China) and adiponectin (Cusabio Biotech Co. Ltd, Wuhan, China) enzyme-linked immunosorbent assay kits according to the manufacturer's protocol.
Detection of fasting glucose and plasma biochemical indexes
At 0, 2, 4, 5, 6, 7, and 9 days, mice were fasted overnight, and the fasting glucose of the mice was measured with a glucometer (Andon Health, Tianjin, China). At the end of the experiment, blood was collected from the mouse orbit using a capillary tube, centrifuged at 0.9 × 10³ g for 15 min, and the supernatant was obtained as serum. The plasma samples were sent to Hangzhou Dian Medical Test Center (Hangzhou City, Zhejiang Province, China) for the measurement of the plasma glucose, alanine transaminase (ALT), aspartate transaminase (AST), total cholesterol (TC), high-density lipoprotein (HDL), and low-density lipoprotein (LDL) using assay kits (Roche, Basel, Switzerland).
Determination of glycogen
Liver glycogen was measured using a glycogen assay kit following the manufacturer's instructions (Nanjing Jiancheng Bioengineering Institute, Nanjing, China). First, approximately 100 mg of liver sample was mixed with alkaline solution at a ratio of 1:3 and placed in a boiling water bath for 20 min. The 1% tracer reaction solution of liver was prepared by adding 9 mL of distilled water after the reaction mixture was cooled. Subsequently, the optical density of samples was measured with a chromogenic agent and a microplate reader at a wavelength of 620 nm. The glycogen in the liver can be calculated using the formula in the manufacturer's instructions.
Real-time polymerase chain reaction analysis
Approximately 50 mg of liver, epididymal white fat, extensor digitorum longus, and whole hypothalamus were used to extract RNA with Trizol reagent (Beijing CoWin Biotech Co. Ltd., Beijing, China) according to the manufacturer's instructions. For the synthesis of cDNA, 2.5 μg of total RNA was reversed by using a cDNA hifi kit (Beijing CoWin Biotech Co. Ltd.). The transcript levels were quantified by CFX96-Touch (Bio-Rad, Hercules, CA) and SYBR Premix EX Taq™ (Takara, Otsu, Japan). The primers (Sangon Biotech Co. Ltd., Shanghai, China) used in this study are given in Supplementary Table S1 (Supplementary Data are available online at
Western blot analysis
Protein samples from the hypothalamus or epididymal adipose tissue were treated and analyzed via electrophoresis, as described in a previous study. 28 In the current experiment, 80 μg of each hypothalamus sample or 10 μg of each fat sample was loaded in each well and then run at 120 V for 40 min. Proteins were transferred onto polyvinylidene difluoride membranes and then blocked with 5% nonfat milk for 1 h. The first antibodies used in this study included anti-adiponectin, anti-NPY (Cell Signaling Technology, Boston, MA), and anti-GAPDH (Beijing ComWin Biotech Co. Ltd., Beijing, China). The second antibody was either horseradish peroxidase–conjugated anti-rabbit or mice immunoglobulin G (Beijing ComWin Biotech Co. Ltd.). An enhanced chemiluminescence reaction (Beijing ComWin Biotech Co. Ltd.) was used to develop the bands, which were examined through density analysis by using Image J software (National Institutes of Health, Bethesda, MD).
Statistical analysis
Data are expressed as the mean ± standard error of the mean. Statistical treatment of the data was done by two-tailed multiple t-tests with a Bonferroni correction using the analysis of variance of SPSS biostatistics software. A p-value of <0.05 was considered as a significant difference between each group.
Results
Effects of leptin gene transfer on fasting glucose, bodyweight, food intake, water consumption, and organ weight of mice in vivo
The change of fasting glucose, body weight, food intake, and water consumption levels of T2D mice are shown in Fig. 1A–E. Fasting glucose in the leptin-treated group significantly decreased from day 2 to day 9 (Fig. 1A and B; p < 0.05 and p < 0.01). The food intake and water consumption levels of the mice were significantly decreased and maintained for 7 days (Fig. 1C–E; p < 0.05, p < 0.01, and p < 0.001). However, the body weight of the T2D mice was not affected by leptin gene transfer (Fig. 1D). These results suggest that leptin gene transfer could lower blood glucose concentration and improve the symptoms of T2D mice, such as polydipsia and polyphagia.
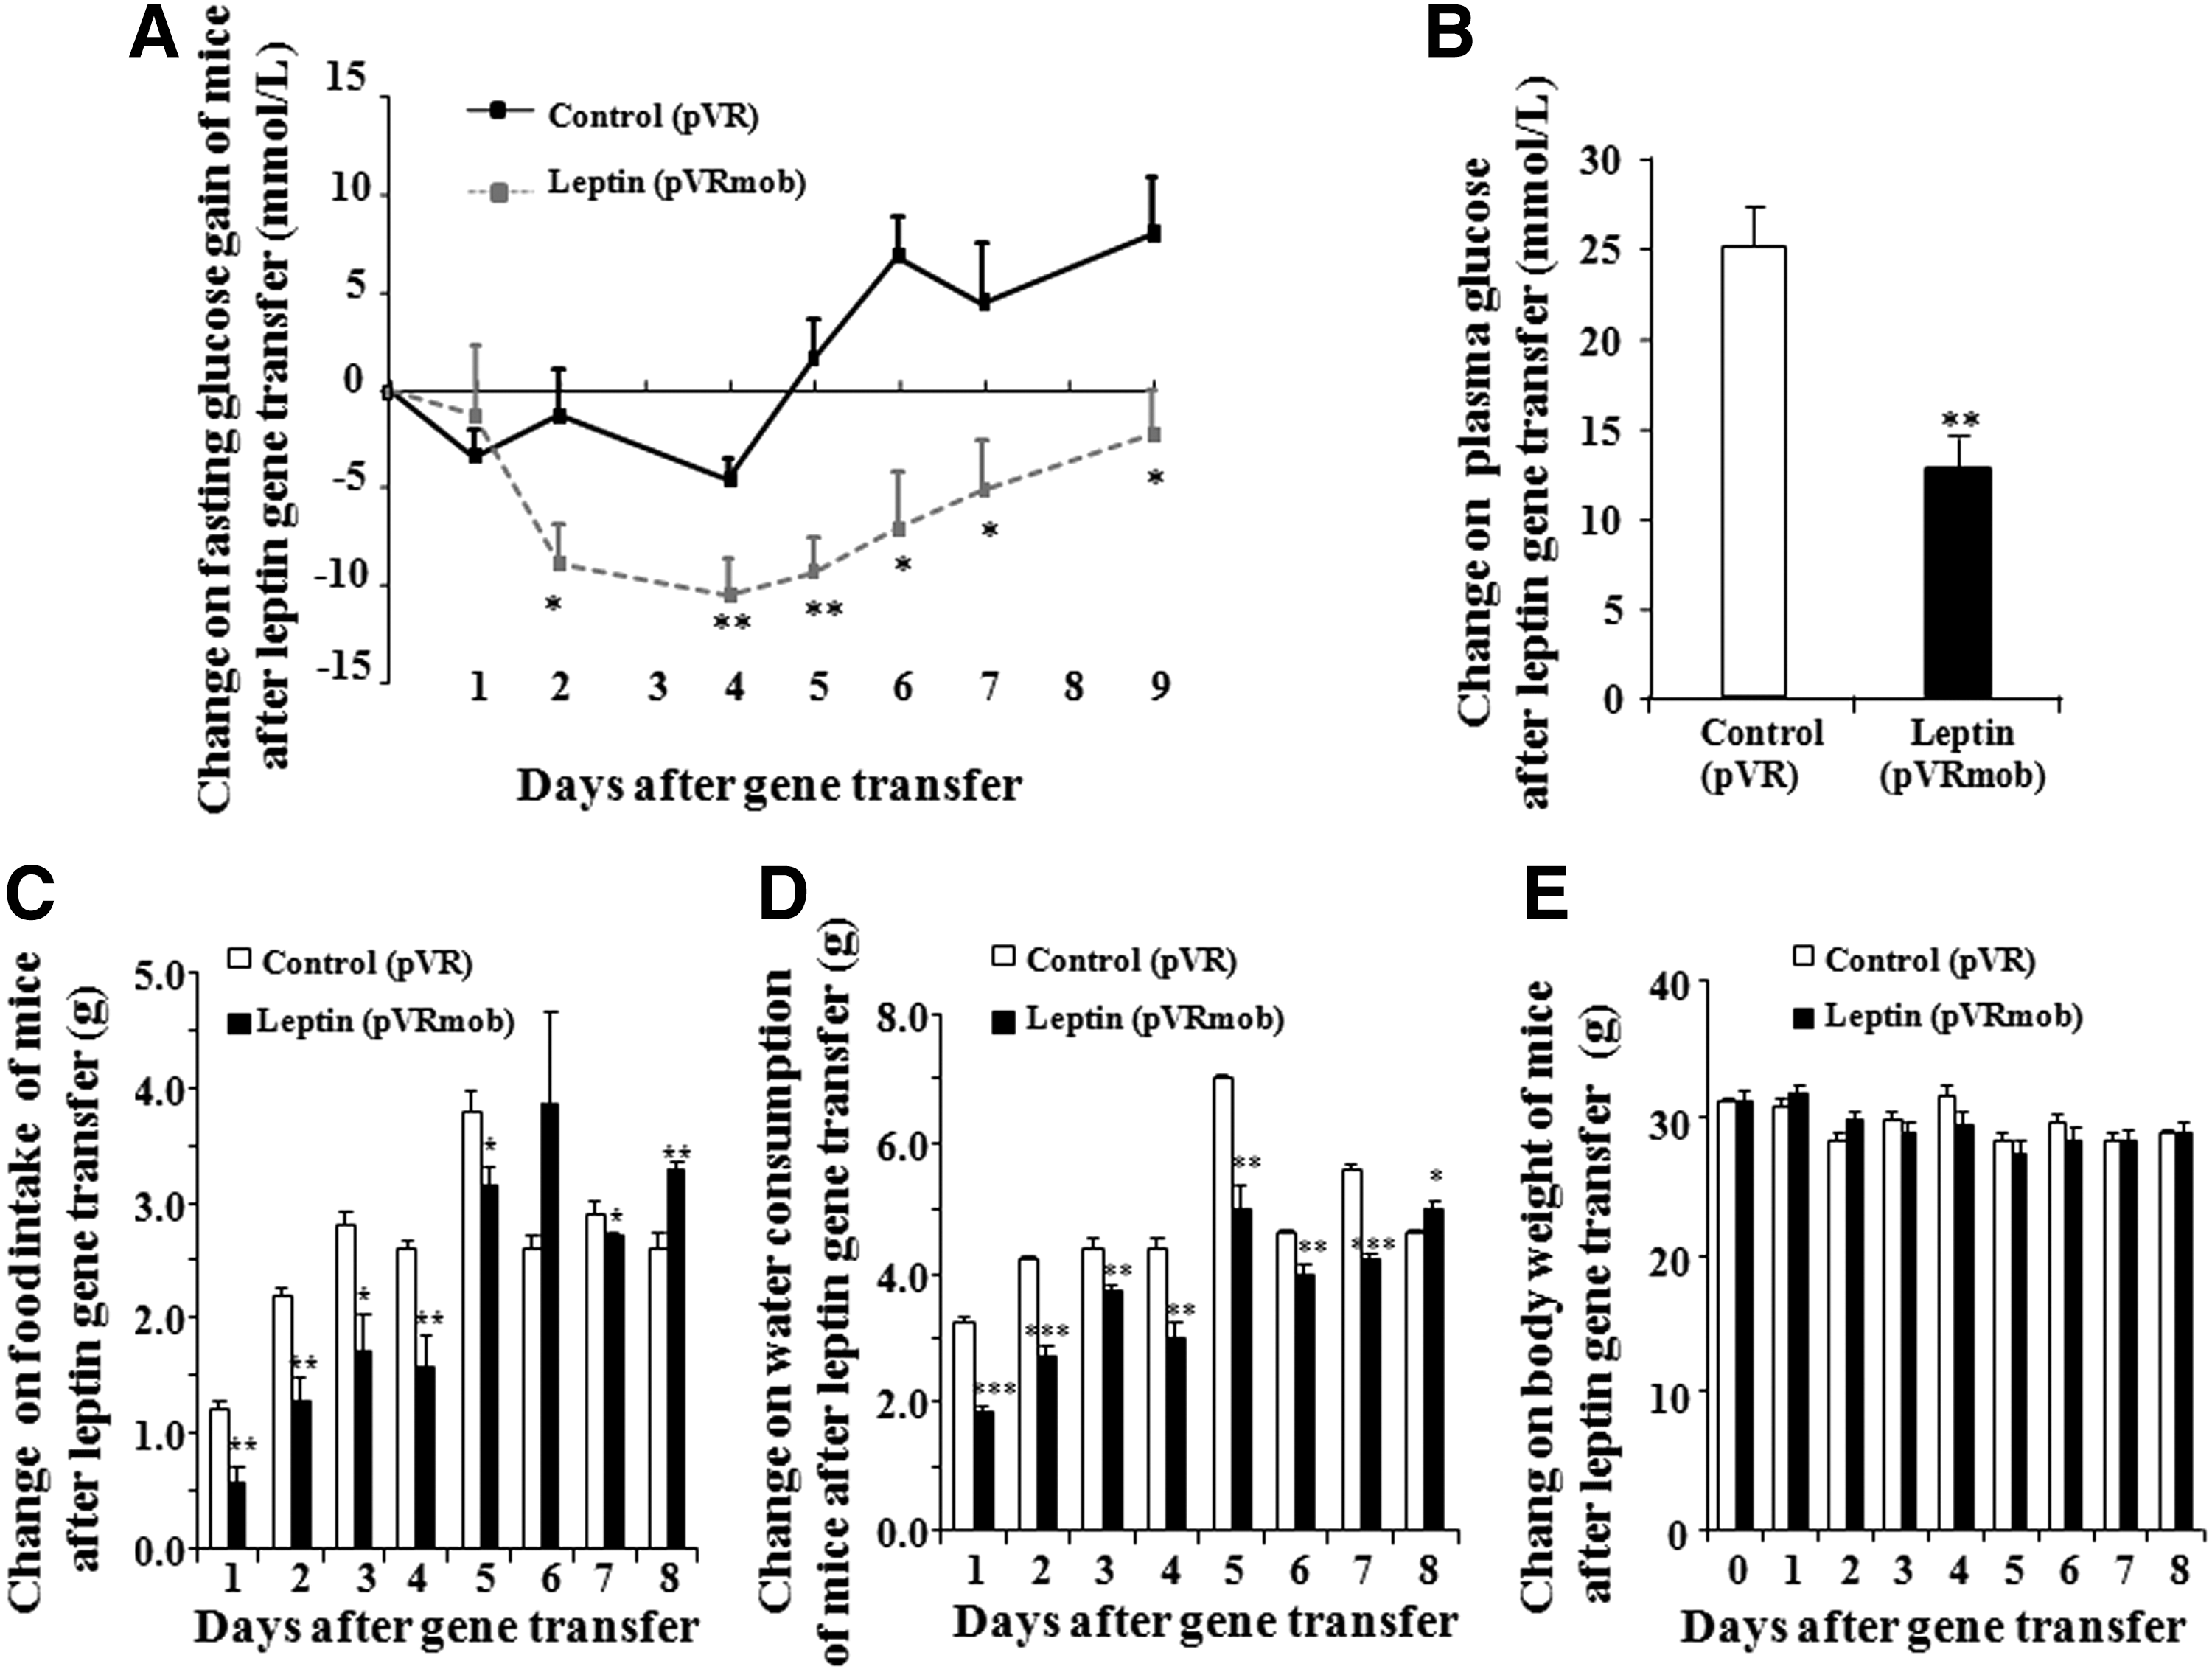
Effects of leptin gene transfer on the clinical symptom of type 2 diabetes (T2D). Changes in the fasting glucose level
The weights of the heart, liver, spleen, pancreas, kidney, and white fat of T2D mice after leptin gene transfer are shown in Supplementary Table S2. No differences were found between the leptin gene transfer and control groups. These results suggest that gene transfer by HD has no distinct side effects on the main organs of T2D mice.
Effects of leptin gene transfer on plasma leptin, adiponectin, and other biochemical indicators
The change of plasma leptin and adiponectin after leptin gene transfer is shown in Fig. 2A and B. At 2 days after gene transfer, an apparent increase in leptin concentration was observed in the leptin-treated group, and this continued to increase until day 7 (p < 0.05 and p < 0.01). A significant increase in plasma adiponectin was also observed in the leptin-treated group on day 2, and this remarkably decreased afterwards (p < 0.05). The changes in ALT, AST, triglycerides (TG), TC, LDL, and HDL after leptin gene transfer are described in Fig. 2C and D. Glucose (Fig. 1B) and TG and TC (Fig. 2D) levels in the leptin-treated group significantly decreased (p < 0.01 and p < 0.01). These results indicate that leptin gene transfer not only lowers blood glucose, but also reduces the TG and TC of diabetic mice. In addition, AST and ALT in the leptin-treated group were significantly increased in comparison to the control group (p < 0.01 and p < 0.05). This result showed that foreign gene expression in the liver can trigger immunoreactions of T2D mice.
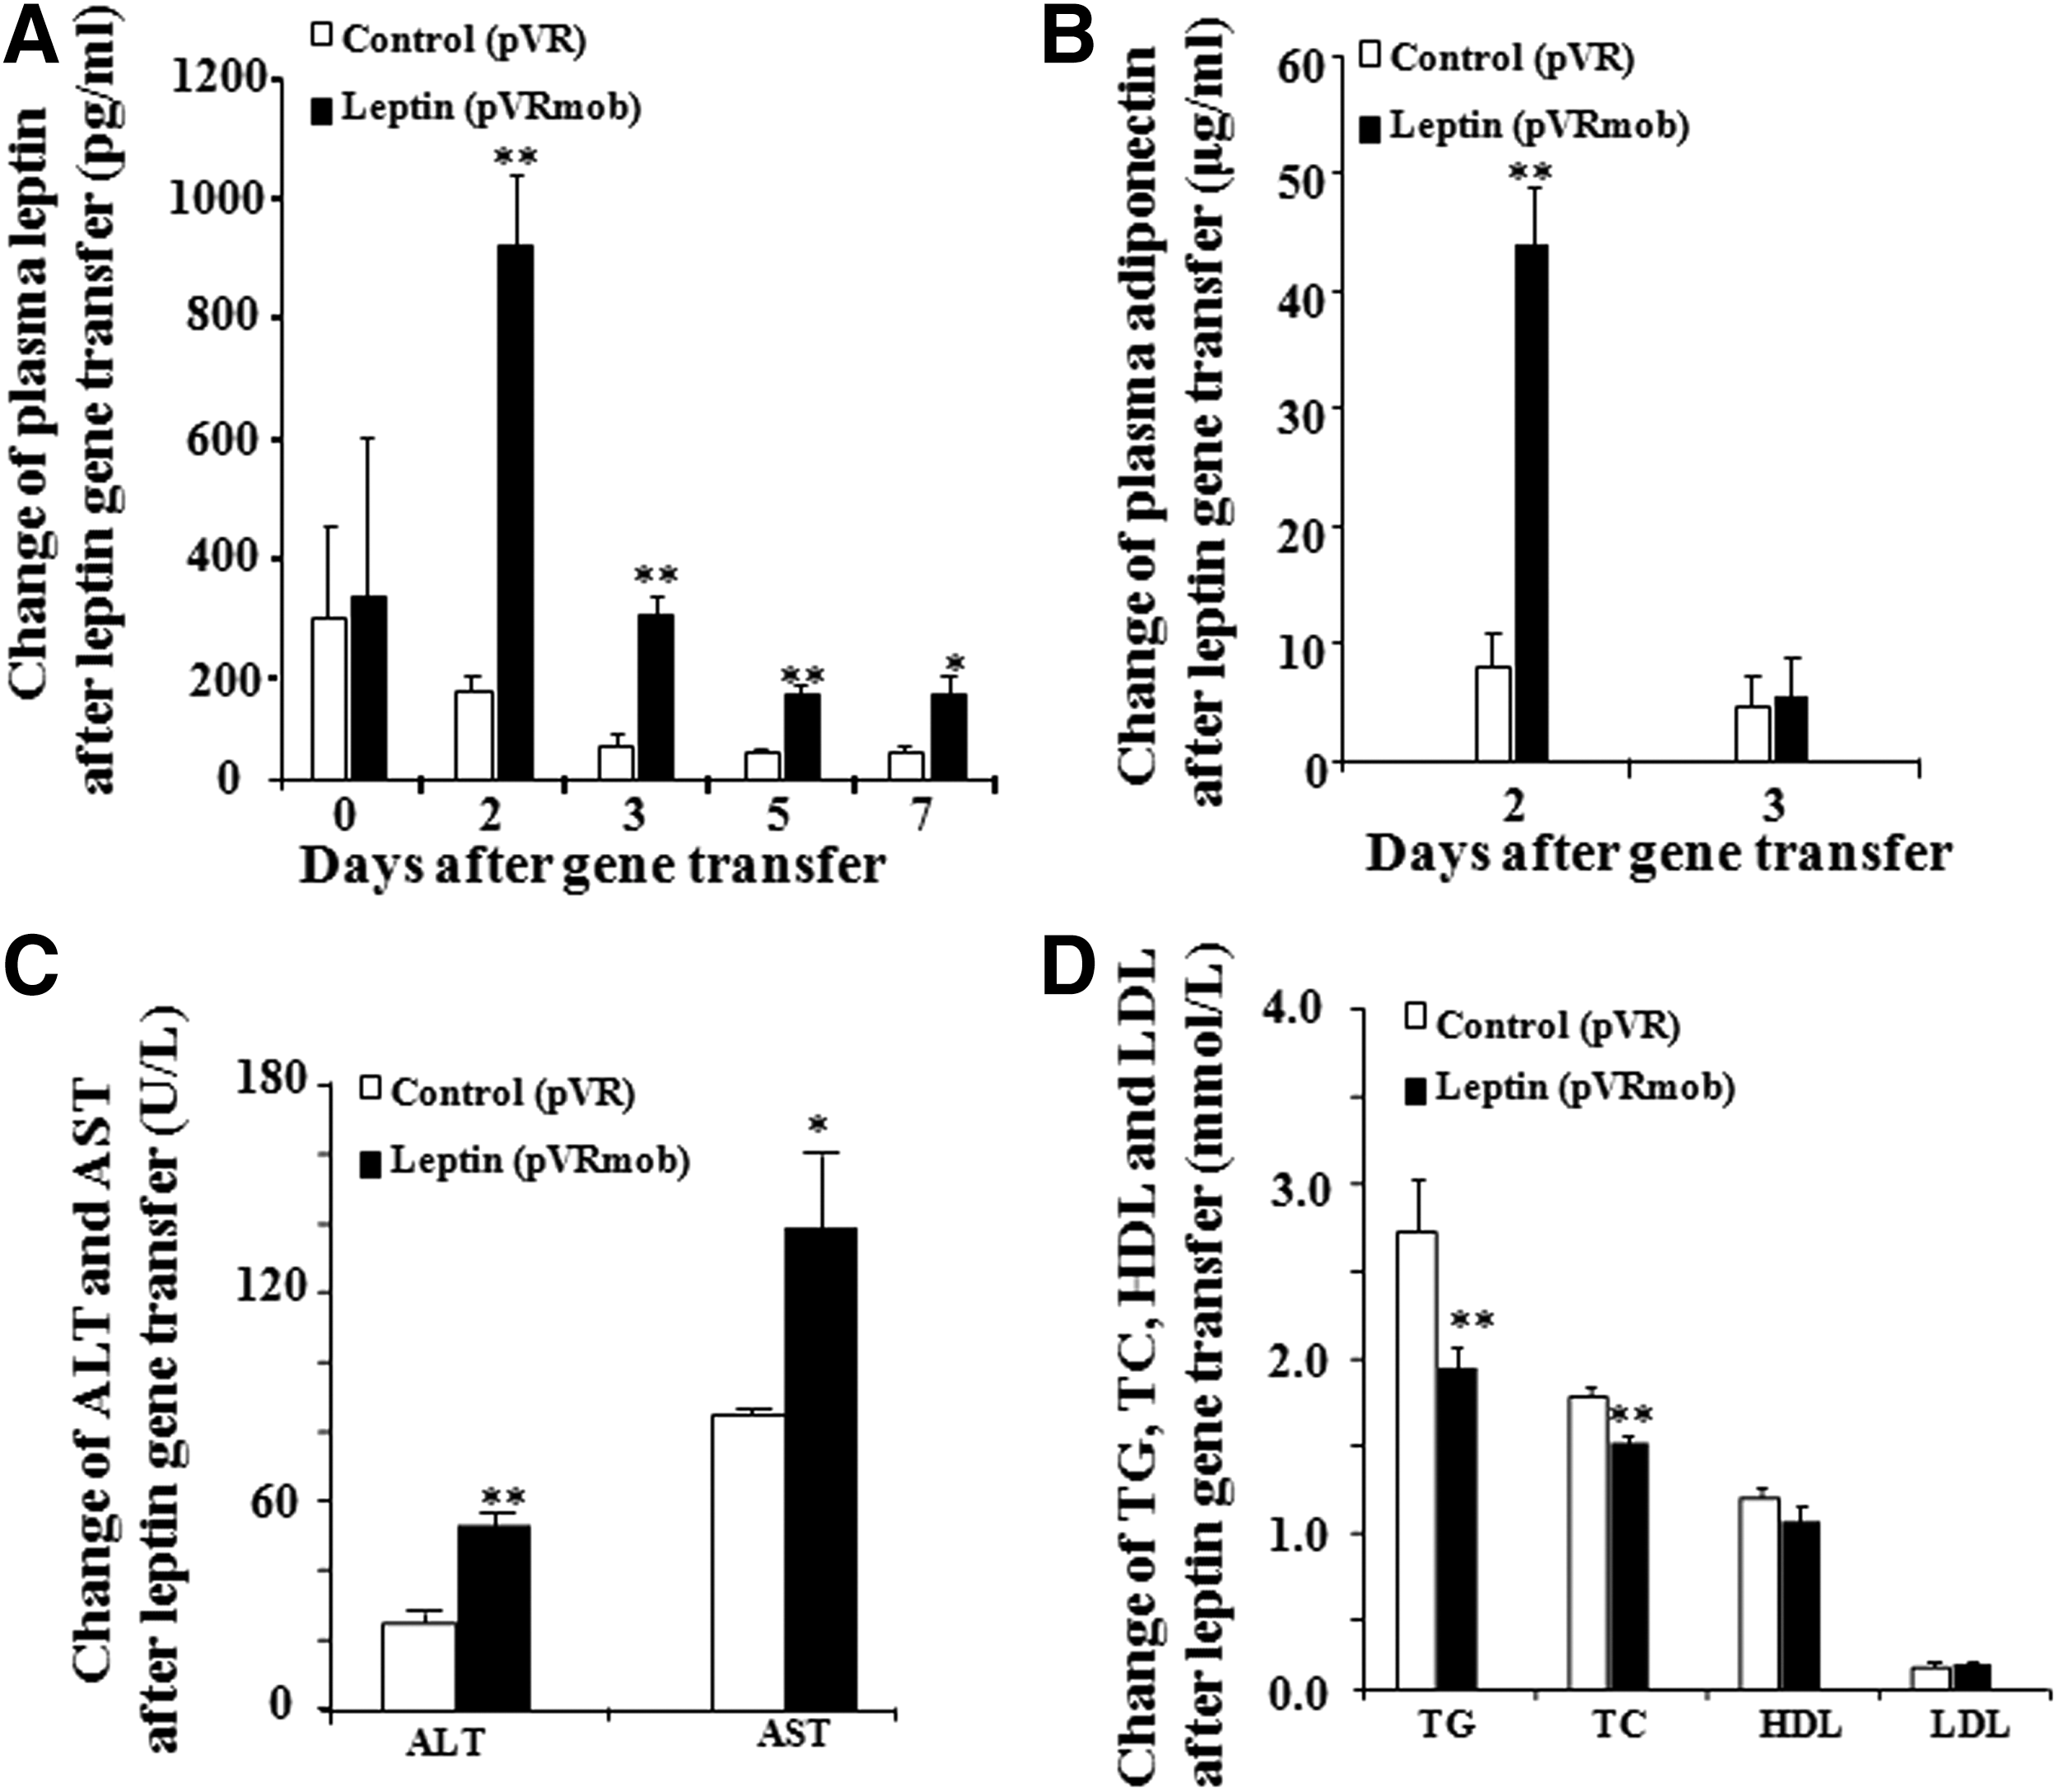
Effects of leptin gene transfer on plasma leptin, adiponectin, and other blood biochemical parameters. Change in plasma leptin
Effects of leptin gene transfer on the hypothalamus
The changes of gene expression in the hypothalamus after leptin gene transfer are shown in Fig. 3A. The mRNA expression levels of leptin, leptin receptor, and the ADR1 gene were significantly increased by 310.85%, 37.8%, and 266.70%, respectively (p < 0.05, p < 0.01, and p < 0.001). The gene expressions of proopiomelanocortin (POMC), NPY, and AgRP in the hypothalamus were significantly decreased by 58%, 50%, and 50% (p < 0.05, p < 0.05, and p < 0.05), respectively. Furthermore, the protein levels of leptin and adiponectin in the hypothalamus were significantly increased (Fig. 3B and C; p < 0.01 and p < 0.05). Meanwhile, the NPY protein level was significantly decreased (Fig. 3C; p < 0.05). These results suggest that leptin gene transfer reduced food intake and regulated glucose metabolism by regulating the leptin/leptin-receptor/NPY/AgRP signaling pathway.
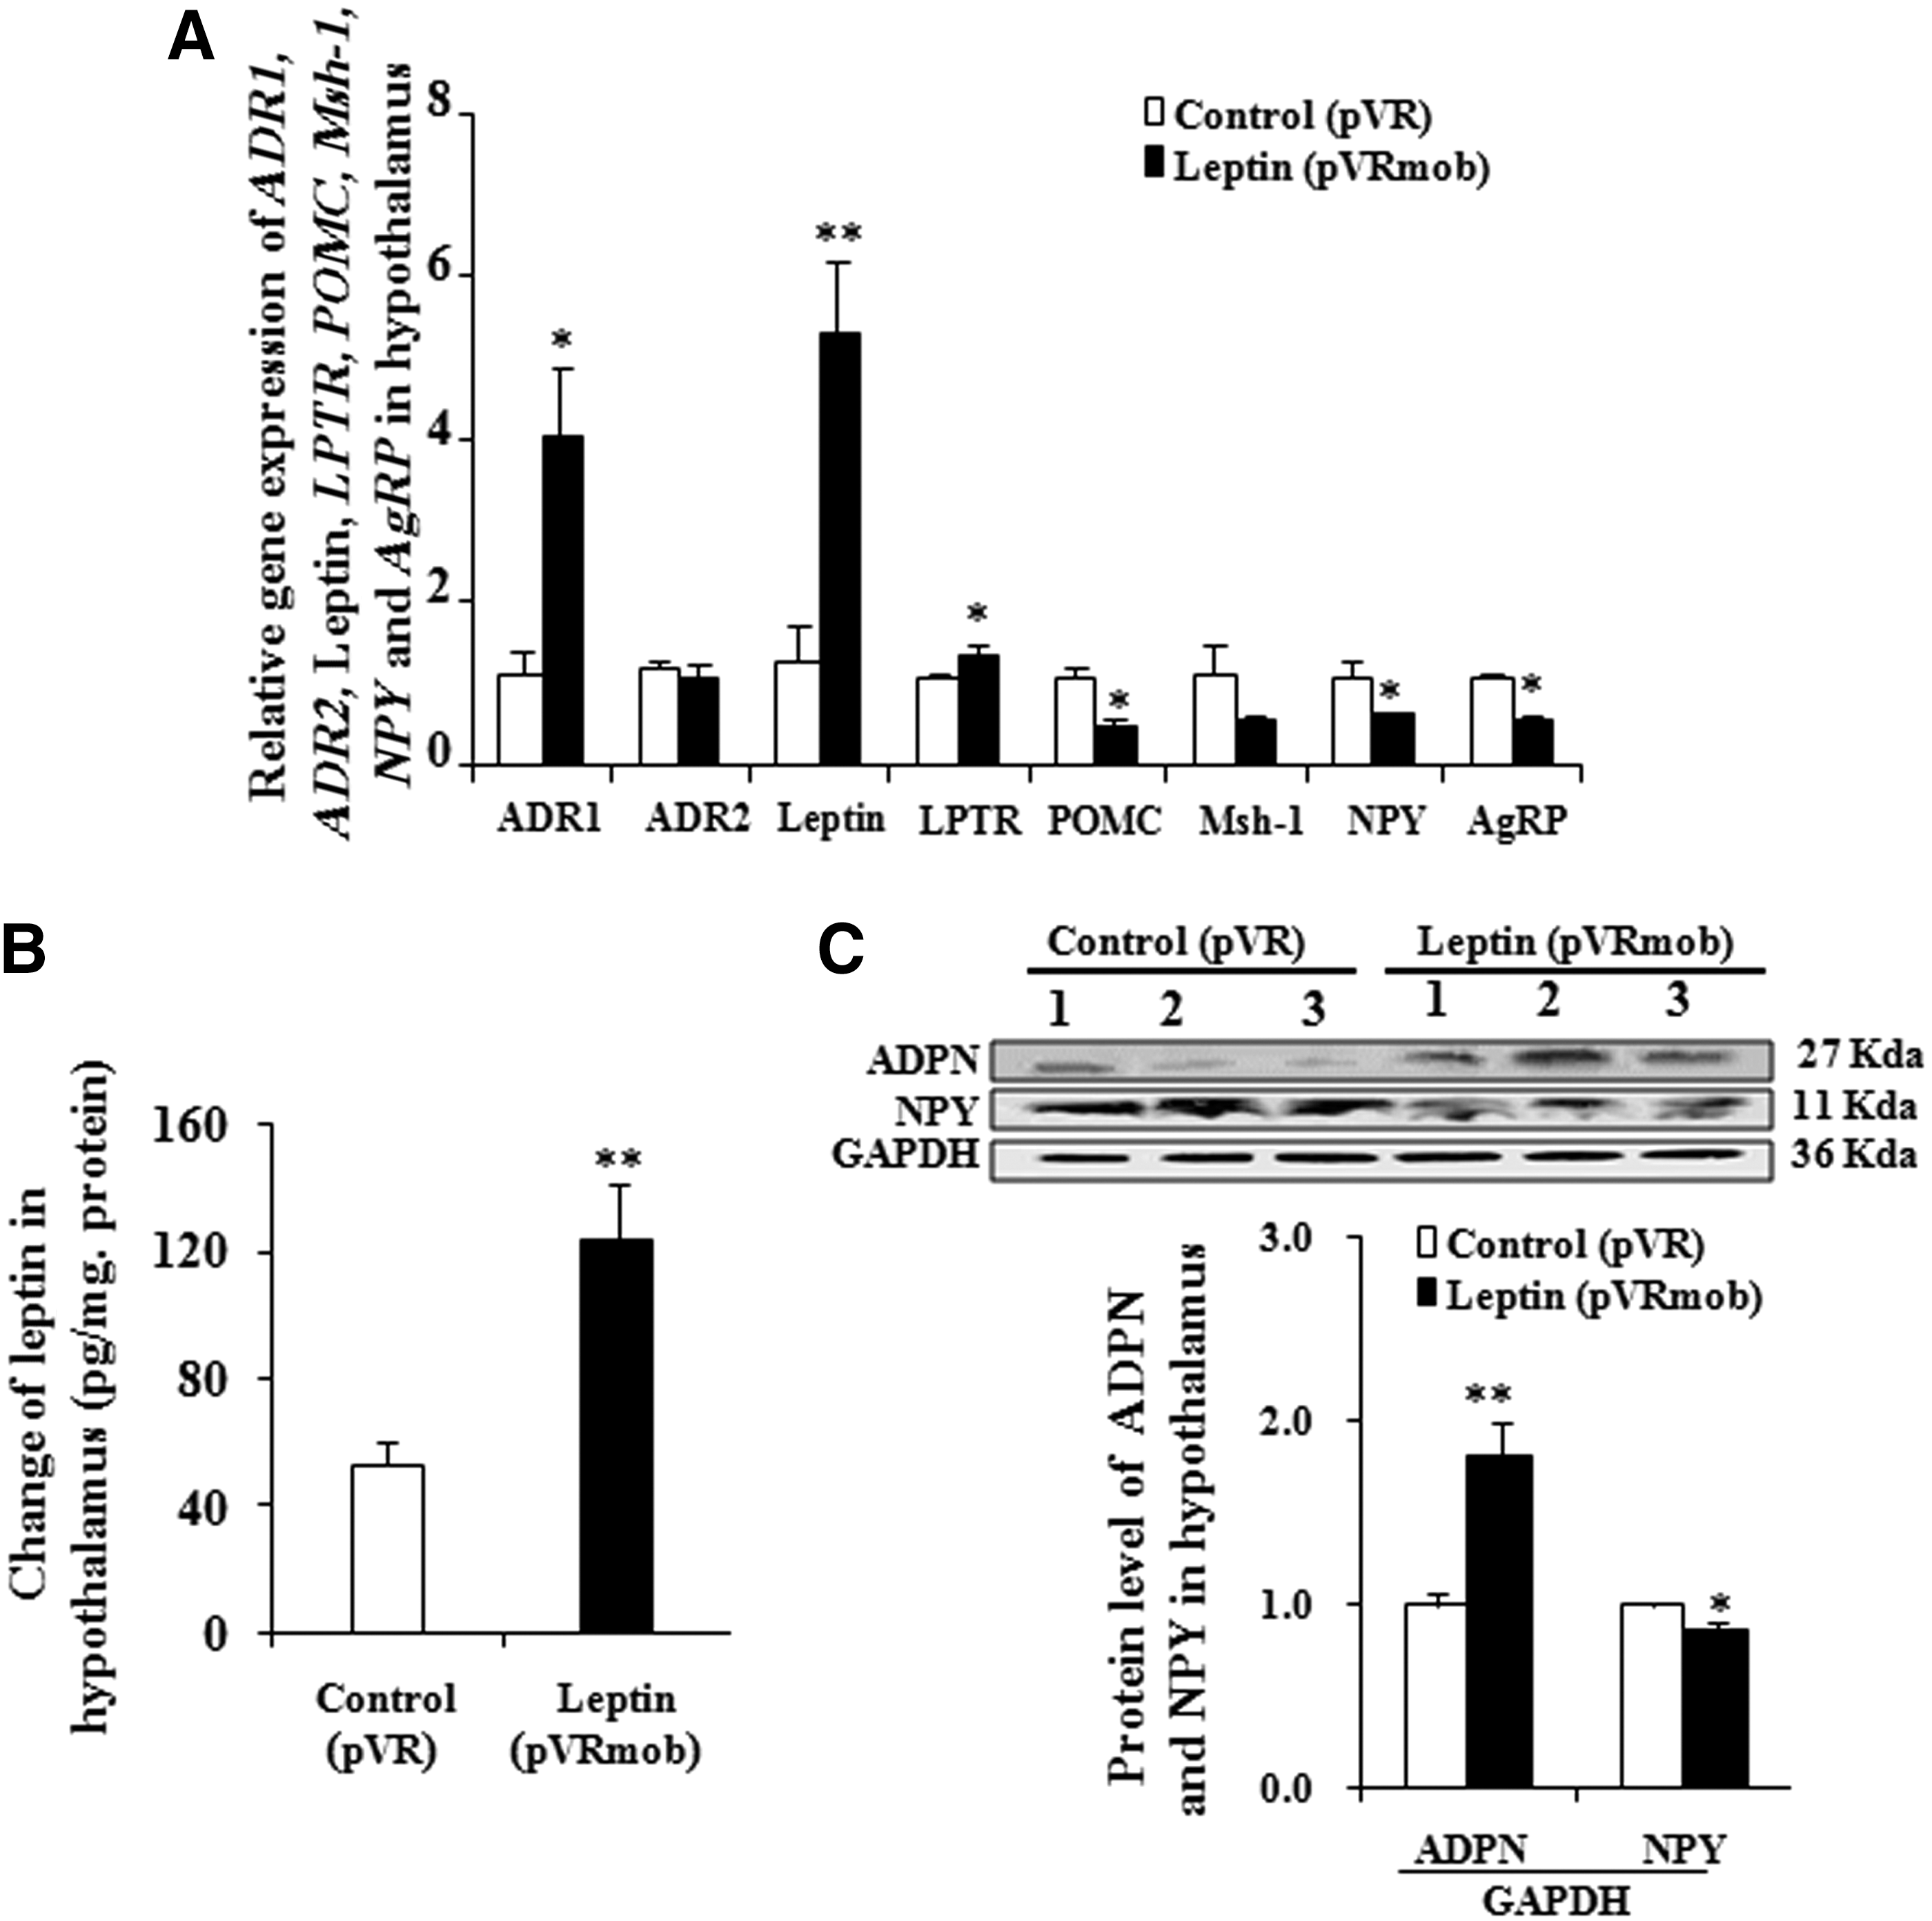
Effects of leptin gene transfer on the hypothalamus. Changes in the gene expression in the hypothalamus
Effects of leptin gene transfer on glycogen and gene expression in the liver
The change of glycogen in the liver after leptin gene transfer in vivo is shown in Fig. 4A. The liver glycogen in the leptin-treated group was significantly increased compared to the control group (p < 0.05). The gene expression levels of glucose-6-phosphase (G-6-pase), glucose transporter 4 (GLUT4), glucokinase (GK), ADR1, adiponectin receptor 2 (ADR2), forkhead box O1 (FOXO1), and peroxisome proliferator-activated receptor-α and -γ (PPAR-α and -γ) in the liver are shown in Fig. 4B. FOXO1, ADR2, and PPAR-α gene expressions significantly decreased (p < 0.05). However, the mRNA abundance of G-6-pase, GLUT4, ADR1, and PPAR-γ were markedly increased (p < 0.05 and p < 0.01). These results verified that leptin gene transfer reduced glucose concentration by promoting hepatic glycogen synthesis and modulation of PPAR-γ/adiponectin and GLUT4 signaling transmission.
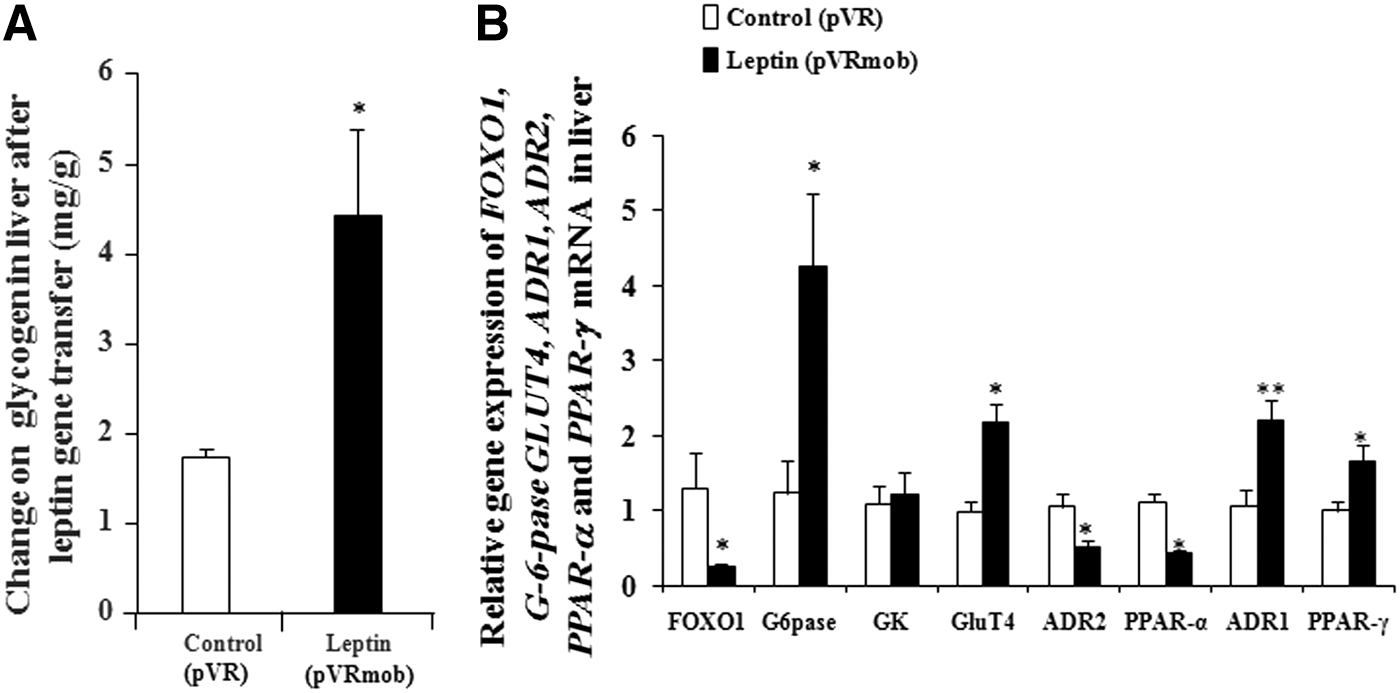
Effects of leptin gene transfer on the glycometabolism of the liver. Changes in glycogen
Effects of leptin gene transfer on white adipose tissue and the gastrocnemius
The change in the leptin, adiponectin, hormone-sensitive lipase (HSL), and UCP1 gene expression in epididymis fat tissue is presented in Fig. 5A. Leptin gene transfer leads to a significant increase of 251.25%, 312.83%, and 133.63% in mRNA abundance for leptin, adiponectin, and HSL gene expression, respectively (p < 0.05, p < 0.05, p < 0.05, and p < 0.05). At the same time, UCP1 gene expression was obviously decreased (p < 0.05). Moreover, the protein levels of leptin and adiponectin were also significantly increased in the leptin gene transfer group (Fig. 5B and C; p < 0.01 and p < 0.05). These results indicate that leptin gene transfer improved the energy metabolism disorder induced by diabetes.
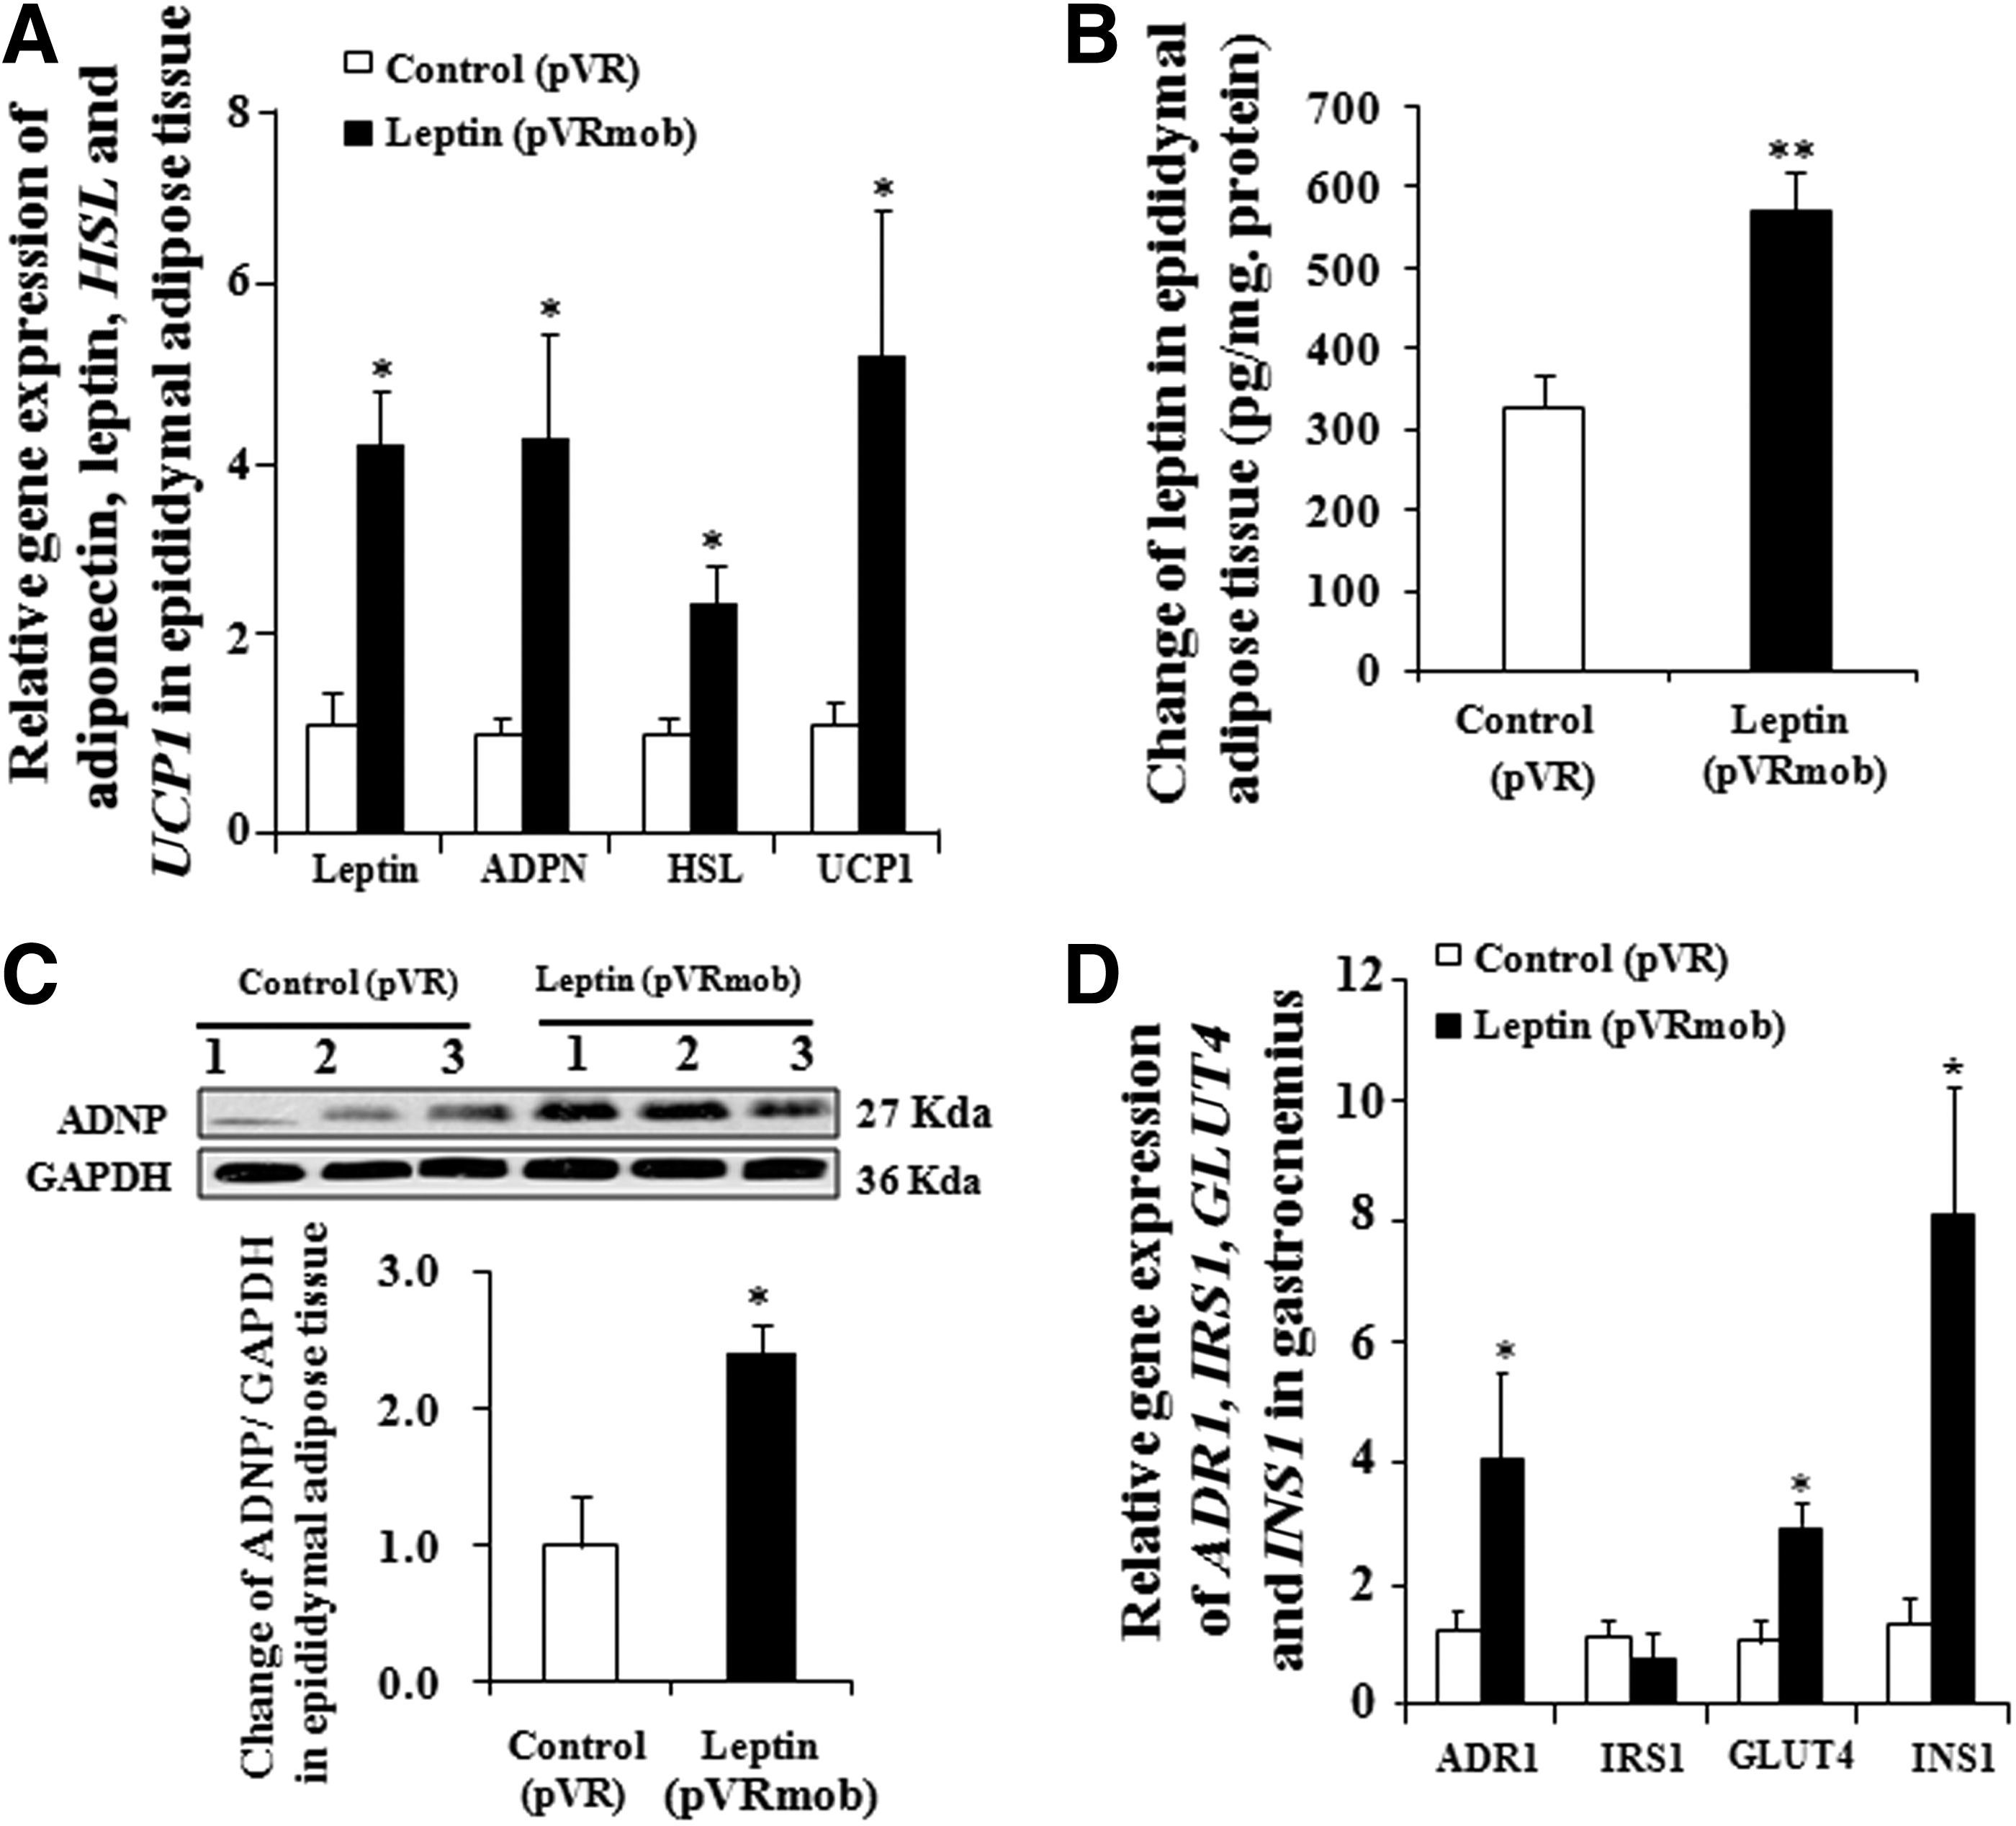
Effects of leptin gene transfer on adipose tissue and the gastrocnemius. Changes in the gene expression in epididymal adipose tissue
The change in the ADR1, IRS1, GLUT4, and insulin 1 (INS1) gene expression in the gastrocnemius is presented in Fig. 5D. The gene expressions of ADR1, GLUT4, and INS1 in the leptin transfer group were significantly increased (p < 0.05, p < 0.05, and p < 0.05, respectively). These results confirmed that leptin gene transfer improved insulin resistance in the gastrocnemius via GLUT4 and insulin signaling transmission.
Discussion
In a previous study, it was found that the foreign mouse leptin gene was successfully overexpressed in the liver of mice in vivo and secreted into the blood by HD. 26 Therefore, the HD method was used to transfer the leptin gene into STZ- and high fat diet–induced T2D mice. Symptoms of T2D mice, such as hyperglycemia, polydipsia, polyphagia, and polyuria (Fig. 1), were significantly improved after leptin gene transfer. These results agree with other reports. 22 –25 The remarkable change in plasma leptin (Fig. 2A) indicated the leptin gene had been successfully transferred, overexpressed in the liver, and secreted into the blood, consistent with previous studies. 26 –28 Therefore, peripherally administered high-dose leptin could lower glucose levels in T2D mice.
During gene transfer by HD, it was found that the gene transfer success and survival rates of HD were very high and could reach 90% in normal mice. However, in similar conditions, the mortality of T2D mice was higher than that of normal mice (only a 70% survival rate). At this point, it is possible that T2D mice have lower resistance to instantaneous high pressure and shock caused by HD. Therefore, transfection reagents such as liposome could be used or the nano-vector changed in order to reduce the side effects of HD, resulting in an increased survival rate of T2D mice after gene transfer in the future.
In this study, a significant reduction of food intake of T2D mice after leptin gene transfer (Fig. 1C) was observed, as in previous studies. 26 –28 However, the weight-reducing effects of leptin were not observed in T2D mice. Moreover, the decrease in blood glucose (Fig. 1A and B) and water consumption of T2D mice after leptin gene transfer (Fig. 1D) in a pathological state were alleviated. These results indicate that the plasma leptin produced by leptin gene transfer was mainly used to lower plasma glucose and improve polydipsia of T2D mice.
Adiponectin is another adipocytokine, produced and secreted by adipose tissue, that improves insulin sensitivity in diabetic animal models. 29 Moreover, it plays a pivotal role in glucose homeostasis and metabolism. Lower adiponectin levels can predict the future development of T2D. 30,31 To understand the correlation between leptin and adiponectin in T2D mice, the change of adiponectin in fat tissue and plasma adiponectin in T2D after leptin gene transfer was investigated. The significant increase of adiponectin gene expression and protein in adipose tissue (Fig. 5A and C) and plasma adiponectin in T2D mice (Fig. 2B) after leptin gene transfer demonstrated that the leptin gene transfer not only increases adiponectin in white adipose tissue but also the plasma adiponectin concentration. Adiponectin might play an important role in the anti-diabetic effect of leptin gene transfer in T2D mice.
The hypothalamus is a key site in the brain that not only integrates energy homeostasis, 32 but also affects glucose homeostasis by controlling the excess secretion of insulin and glucagon. 33 Leptin and adiponectin regulate food intake and energy expenditure by targeting the receptors in the hypothalamus. 21,34 In this study, the remarkable increase of leptin, leptin-receptor, and ADR1 gene expressions and leptin and adiponectin protein in the hypothalamus (Fig. 3A–C) after leptin gene transfer revealed that the plasma leptin and adiponectin crossed the blood–brain barrier, arriving at the brain, regulating appetite, energy, and glucose metabolism-related genes such as POMC, Msh-1, NPY, and AgRP genes by activating their receptors and downstream signaling pathways. 35 The significant reduction of AgRP gene expression and NPY protein in Fig. 3A and 3C showed that leptin improved polyphagia of T2D mice via the leptin/leptin receptor/NPY/AgRP signaling pathway.
The liver is an important organ which regulates glycometabolism and energy metabolism. GLUT, GK, G-6-pase, ADR, PPAR-α, PPAR-γ, and FOXO1 play important roles in mediating hepatic glucose production. 36,37 Thus, the changes in these genes in the liver were explored. The increase in GLUT4, ADR1, and PPAR-γ gene expressions, hepatic glycogen, and the reduction of ADR2, PPAR-α, and FOXO1 gene expressions in this study indicate that leptin gene transfer reduced the blood glucose level by increasing glucose transport, hepatic glycogen synthesis, and the ADR1/PPAR-γ signaling pathway. Interestingly, it was found that leptin gene transfer in the liver could cause the sharp increase in G-6-pase gene expression in T2D mice (Fig. 4B). It is possible that the sharp decrease in blood sugar induced compensative and negative-feedback regulation of T2D mice.
In addition, reduction of GLUT4 transposition and inhibition of glucose transport are essential factors in inducing insulin resistance in the muscle tissue of T2D mice. 38 The increase in GLUT4, ADR1, and INS1 gene expression in muscle tissue after leptin gene transfer, as shown in Fig. 5D, shows that leptin improved insulin resistance of the muscle by enhancing GLUT4 and adiponectin signaling transmission.
Taken together, the present study reveals that leptin gene transfer by HD in vivo can ameliorate the symptoms of T2D mice by regulating the leptin–hypothalamus signaling pathway and insulin resistance of peripheral tissues.
Footnotes
Acknowledgments
This study is partly supported by the Project of Zhejiang Provincial Science and Technology Department (no. 2015C33132), the Project of Zhejiang Provincial Education Department (no. Y201329934), the Doctoral Fund of Ministry of Education (no. 20130101110093), and the International Science and Technology Cooperation Program of China (no. 2014DFG32690).
Author Disclosure
All authors declare that no competing financial interests exist.
References
Supplementary Material
Please find the following supplemental material available below.
For Open Access articles published under a Creative Commons License, all supplemental material carries the same license as the article it is associated with.
For non-Open Access articles published, all supplemental material carries a non-exclusive license, and permission requests for re-use of supplemental material or any part of supplemental material shall be sent directly to the copyright owner as specified in the copyright notice associated with the article.