
Abstract
The 2014 Ebola outbreak in West Africa highlighted the worldwide public health threat posed by this virus and the urgent need for an Ebola vaccine. A novel recombinant adenovirus type 5 vector-based Ebola vaccine (Ad5-EBOV), based on the 2014 Zaire Guinea epidemic strain, was developed in China. A good safety profile and robust immune response elicited by Ad5-EBOV were confirmed in phase 1 and phase 2 clinical trials. Nonetheless, clinical studies of this Ebola vaccine are still at an early stage and there are still no solid efficacy data for humans. For efficacy evaluation and quality control of Ad5-EBOV, the cellular and humoral immune responses in BALB/c mice vaccinated with Ad5-EBOV were examined at various time points. ELISpot and flow cytometric analysis showed that EBOV glycoprotein (GP)-specific T cell responses were detectable early in the first week after infection and by week 4 had increased to maximum levels, which lasted through week 6. During week 1, high titers of EBOV GP-specific antibodies were found (geometric mean [GM], 1783). These titers peaked at week 10 (GM, 26,214) and lasted to 6 months (GM, 1,351). The titer of neutralizing antibodies based on pseudovirus assays also increased over time to peak at 1:16 in one mouse and 1:8 in nine mice during week 6, before decreasing to zero by week 12. These results suggest that BALB/c mice can be used to evaluate the effectiveness of Ad5-EBOV, and that the cellular immune response and humoral immune response can be used as indicators to evaluate vaccine effectiveness. Rapid determination of such methods and indicators is critical for the evaluation of Ebola vaccine efficacy, and can provide effective quality control for Ad5-EBOV.
Introduction
E
Vaccination is a conventional and effective approach for preventing and controlling infectious diseases. Although Ebola vaccine research began soon after the virus was identified, most vaccine candidates have been tested at preclinical levels, using animals. 6 The 2013–2016 West African Ebola outbreak highlighted the need for an effective Ebola virus vaccine. 7 Several Ebola vaccine candidates have shown effective and rapid protection against lethal EBOV challenges in rodents and NHPs. 8 –12 As an emergency response to the largest EVD epidemic, the development of vaccines for Ebola was accelerated with the launching of fast-track and specially approved Ebola vaccines for clinical trials. 13 Eight vaccines are now at various stages of clinical trials. 14
A novel recombinant adenovirus type 5 vector-based Ebola vaccine (Ad5-EBOV) that expresses the 2014 EBOV glycoprotein (GP) was developed in China. As an emergency response to the largest Ebola disease epidemic, special approval of this vaccine for phase 1 and 2 clinical trials was granted, based on preclinical studies that showed complete protection against Ebola virus challenge in guinea pigs and cynomolgus macaques after immunization with Ad5-EBOV (our unpublished data). Results of phase 1 and 2 clinical trials showed that this vaccine had good safety and immunogenicity. 10,15 However, clinical studies of Ebola vaccine are still in the early stages, and confirmation of vaccine efficacy in humans is unavailable because of the low rates of EVD. 16 In the meantime, alternative approaches can be used to ensure that safe and effective Ebola vaccines are available for future outbreaks. Foremost, the development of quality control systems to gauge vaccine effectiveness is critical. Although challenge–protection studies with wild-type EBOV in NHPs usually provide the necessary evidence to infer Ebola vaccine efficacy, such studies require special protective measures such as biosafety level 4 (BSL-4) facilities because of the high pathogenicity and mortality of Ebola virus infection. 17 BSL-4 studies are obviously not suitable for the performance of quality control studies for Ebola vaccines in national control laboratories. Here, we aimed to establish an immunogenicity evaluation system in mice to assess the specific cellular and humoral immune responses elicited by Ad5-EBOV.
Materials and Methods
Reagents
The Steady-Glo luciferase assay system (Cat. No. E2510) and anti-mouse IgG (H+L), horseradish peroxidase (HRP) conjugate (Cat. No. W4021) were purchased from Promega (Madison, WI). ELISA plates (96-well, Cat. No. 3590) were from Corning (Corning, NY). The mouse IFN-γ ELISpot set (Cat. No. 551849) and mouse IL-2 ELISpot set (Cat. No. 551282) were from BD Biosciences (San Jose, CA). TurboFect transfection reagent (Cat. No. R0531) was from Thermo Fisher Scientific (Waltham, MA). EBOV envelope glycoprotein (EBOV-GP) fragment LV9, EBOV-GP capture antigen (H38, amino acids 393–556, Zaire, 2014), and pseudovirus were generous gifts from Lihua Hou (Beijing Institute of Biotechnology, Beijing, China). The recombinant adenovirus type 5 vector-based Ebola vaccine (Ad5-EBOV) was from CanSino Biologics (Tianjin, China).
Immunizing mice with Ad5-EBOV
BALB/c female mice (4–6 weeks old) were provided by the Institute of Laboratory Animal Resources (National Institutes for Food and Drug Control, Beijing, China). A total of 92 BALB/c mice were randomly divided into two groups. The vaccine group was composed of 56 mice that were immunized intramuscularly with 2 × 10⁸ infectious units (IFU) of Ad5-EBOV per mouse, whereas the control group consisted of 36 mice that were immunized with 200 μl of phosphate-buffered saline (PBS). All mice were handled according to protocols approved by the Laboratory Animal Care and Use committee of the National Institutes for Food and Drug Control, and conformed to national guidelines on the ethical use of laboratory animals.
Splenocyte dissociation
During each of the six consecutive weeks after immunization, six mice from the vaccine and control groups were sacrificed and splenocytes were collected. Under aseptic conditions, the splenocytes were ground against a 200-mesh sieve in 1 × mouse lymphocyte separation medium (Cat. No. DKW33-R0100; Dakewe Biotech, Shenzhen, China) and then resuspended in universal serum-free medium (DKW34-EU0100; Dakewe). The dissociated splenocytes were counted and kept on ice until used in ELISpot assays and flow cytometric analyses.
Enzyme-linked immunospot assay
The number of splenocytes secreting IFN-γ or IL-2 was measured with the BD ELISpot mouse IFN-γ set and BD ELISpot mouse IL-2 set, respectively. All procedures were completed strictly in accordance with instructions provided with the immunohistochemical reagents. A total of 200,000 splenocytes per well was incubated with 4 μg of EBOV-GP specific peptide (LV9) for 18 hr at 37°C and 5% CO2. An equal volume (4 μl) of RPMI 1640 medium was added to untreated negative control wells, and 0.05 μg of concanavalin A (ConA) was used as a positive control. IFN-γ- or IL-2-positive cells were visualized as spots on ELISpot membranes and counted with an ELISpot plate reader (UVSpot; Cellular Technology, Cleveland, OH) with spot-forming cells (SFCs).
Flow cytometric analysis
The number of CD4+ or CD8+ cells producing IFN-γ and IL-2 was also assessed by flow cytometry. Splenocytes were isolated as described above and seeded at 106 cells per well in RPMI 1640 medium (Cat. No. SH30809.01; HyClone/GE Healthcare Life Sciences, Piscataway, NJ) with 10% fetal bovine serum (FBS). Cells were stimulated for 12 hr with 4 μg of LV9 at 37°C with 5% CO2, and 5 μg of brefeldin A (BFA) (Cat. No. 420601; BioLegend, San Diego, CA) was added 6 hr before the experiment end point to block IFN-γ and IL-2 secretion. The cells were then collected into a tube and stained with PE/Cy7-conjugated anti-mouse CD4 (Cat. No. 100422; BioLegend) and PE/Cy5-conjugated anti-mouse CD8a (Cat. No. 100710; BioLegend), followed by a 20-min incubation in the dark. Intracellular cytokines were detected after a 30-min incubation with PE-conjugated anti-mouse IL-2 (Cat. No. 503808; BioLegend) and FITC-conjugated anti-mouse IFN-γ (Cat. No. 505806; BioLegend) in the dark. At least 50,000 events were analyzed with a BD LSRII flow cytometer and Summit software (BD Biosciences).
Detection of EBOV glycoprotein (ZGP)-specific IgG by ELISA
Sera were harvested from 10 mice in the vaccine group at 0, 1, 2, 4, 6, 8, 10, 12 and 24 weeks after vaccination. ELISA plates (Corning) were coated with 40 ng of EBOV-GP capture antigen (H38, amino acids 393–556, Zaire, 2014) diluted in PBS (0.05 mol/liter, pH 9.6). Plates were washed with PBS plus 0.1% Tween 20 and then blocked for 2 hr with PBS plus 2.0% bovine serum albumin (BSA) at 37°C. For this study, serum samples were assayed at 4-fold dilutions in PBS plus 0.2% BSA until the end-point titer was reached. Diluted samples were incubated with capture antigen at 37°C for 60 min. Plates were then washed and incubated with anti-mouse IgG conjugated to HRP (Invitrogen, Carlsbad, CA) at a 1:3000 dilution at 37°C for 60 min. The plates were washed again before HRP substrate was added and incubated at room temperature for 20 min. Plates were read with a Multiskan Ascent ELISA microplate reader (Mettler, Toledo, OH) at 450 nm. Samples were scored as positive if absorbance at 450 nm (A 450) was >0.1 and the P/N ratio was >2.1, where P and N are the A 450 values of the diluted serum after immunization and the serum before immunization at the same dilution with P, respectively. The serum titer was defined as the reciprocal of the highest positive serum dilution.
Neutralizing antibody assay
Sera were harvested from 10 immunized mice at 0, 2, 4, 6, 8, 10, and 12 weeks after vaccination, heat-inactivated at 56°C for 30 min, and stored at −20°C. A pseudovirus-based neutralization assay was used to test for neutralizing antibodies induced by Ad5-EBOV vaccine. Briefly, HEK293 cells were seeded into 96-well plates at 40,000 cells per well to generate a confluent monolayer on the day of infection. Serum samples (50 μl) from 1:2, 1:4, 1:8, and 1:16 dilutions were each mixed with 50 μl of pseudovirus, which was diluted to a 10,000 fluorescence signal value, and incubated at 37°C for 1 hr. Subsequently, the 100-μl serum–virus mixture was added to the HEK293 monolayer and incubated at 37°C for 1 hr. Cells were fed with 100 μl of fresh minimal essential medium with 3% FBS and incubated for 48 hr before the cells were lysed and luciferase activities were measured with the Steady-Glo luciferase assay system (Promega), following the manufacturer's instructions. The neutralizing antibody (Nab) titer of a serum sample was considered positive at a dilution showing >80% reduction of firefly luciferase expression compared with the positive control. Positive controls were pseudoviruses that had been treated with serum at week 0 of immunization. Uninfected cells were used to determine the background fluorescence in the luciferase assay.
Statistical analysis
GraphPad Prism version 6.01 software (GraphPad Software, San Diego, CA) was used for data processing and for statistical analyses. A group or nonpaired t test was performed to calculate p values.
p < 0.05 was considered statistically significant (*), p < 0.01 was considered highly significant (**), p < 0.001 was considered extremely significant (***), and p < 0.0001 was considered to have the highest level of significance (****).
Results
EBOV GP-specific T cell responses
From ELISpot assays, IFN-γ SFCs from the vaccine group were 217.5 (95% confidence interval [CI], 143.0–298.5) at week 1, which peaked at 501.5 (95% CI, 373.5–657.0) at week 4, and then gradually diminished to 180.5 (95% CI, 136.5–234.0) by week 6. SFCs in the control group were all below 12 throughout the 6-week period (Fig. 1A and B). Statistically significant differences between the vaccine and control group were detected (Fig. 1A and B) and among the various weeks for the vaccine group, statistically significant differences between week 4 and the other weeks were seen (Fig. 1C).
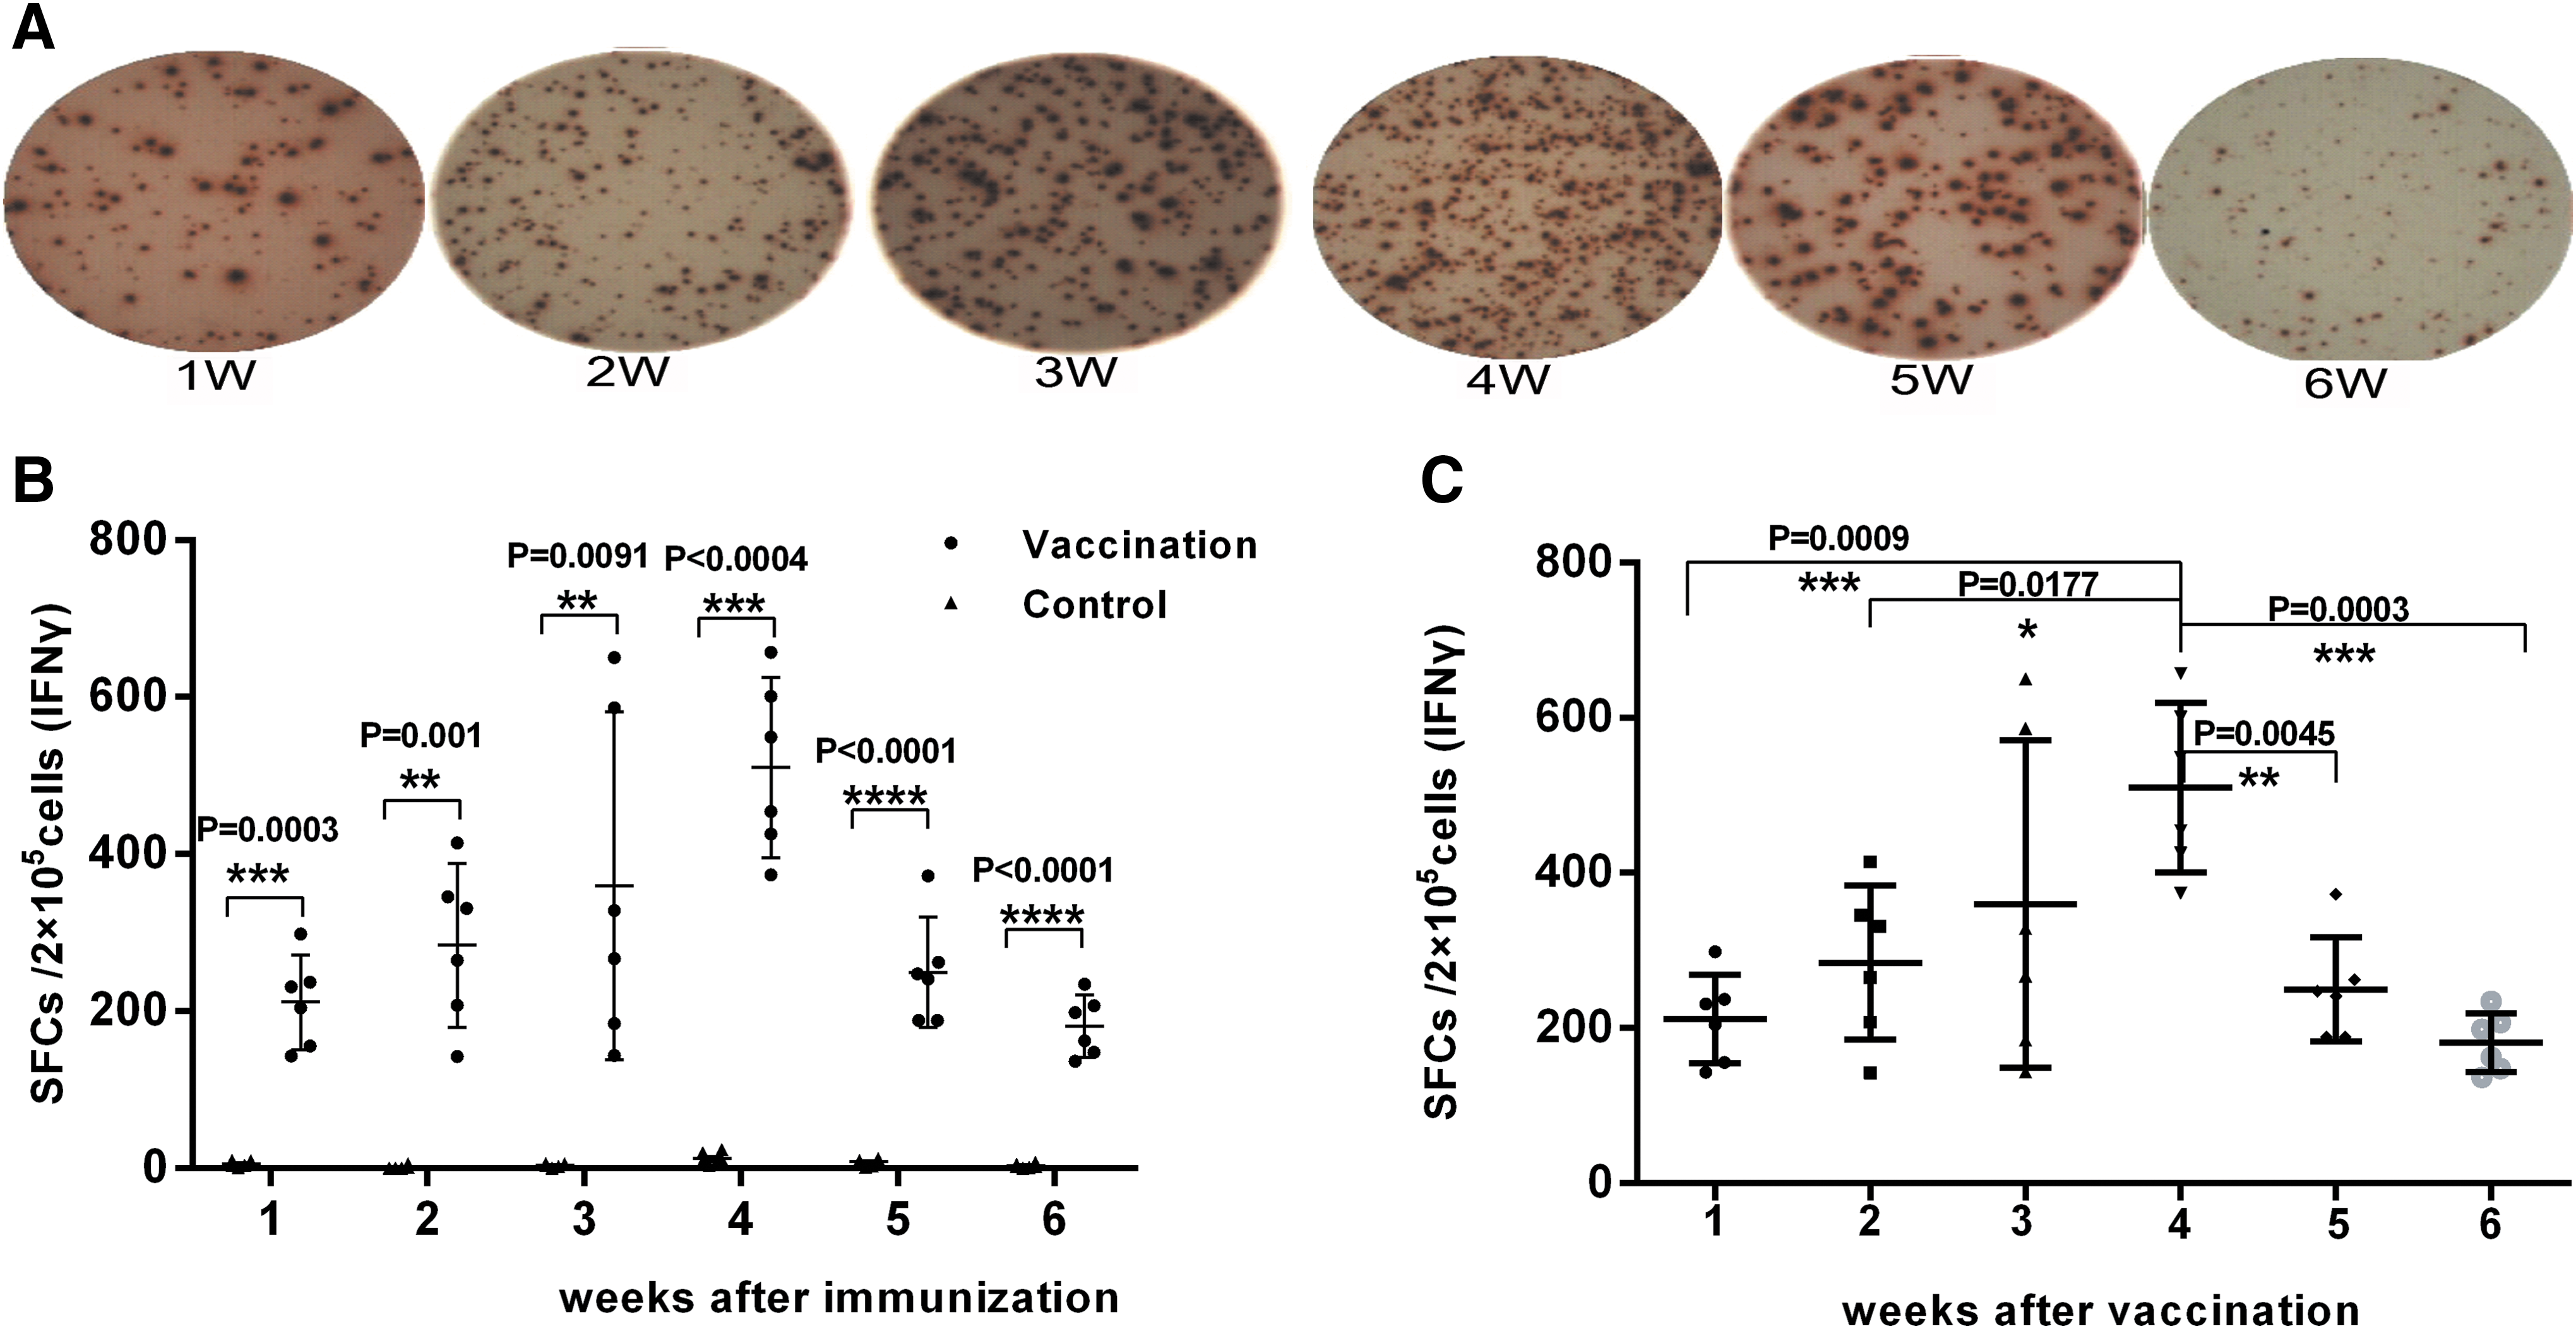
Enzyme-linked immunospot (ELISpot) assay for interferon (IFN)-γ expression.
IL-2 SFCs in the vaccine group were only 2.0 (95% CI, range 0.0–3.0) at week 1, but peaked during week 4 at 25.5 (95% CI, 8.0–33.5) before declining to 10.0 (95% CI, 4.5–17.5) at week 6 (Fig. 2A and B). The difference between the vaccine and control groups for IL-2 SFCs was significant at week 3 (p < 0.05), and this significant difference persisted to week 6 (p < 0.05) (Fig. 2A and B). Statistically significant differences among the various weeks in the vaccine group were detected between weeks 1 and 4 (Fig. 2C).
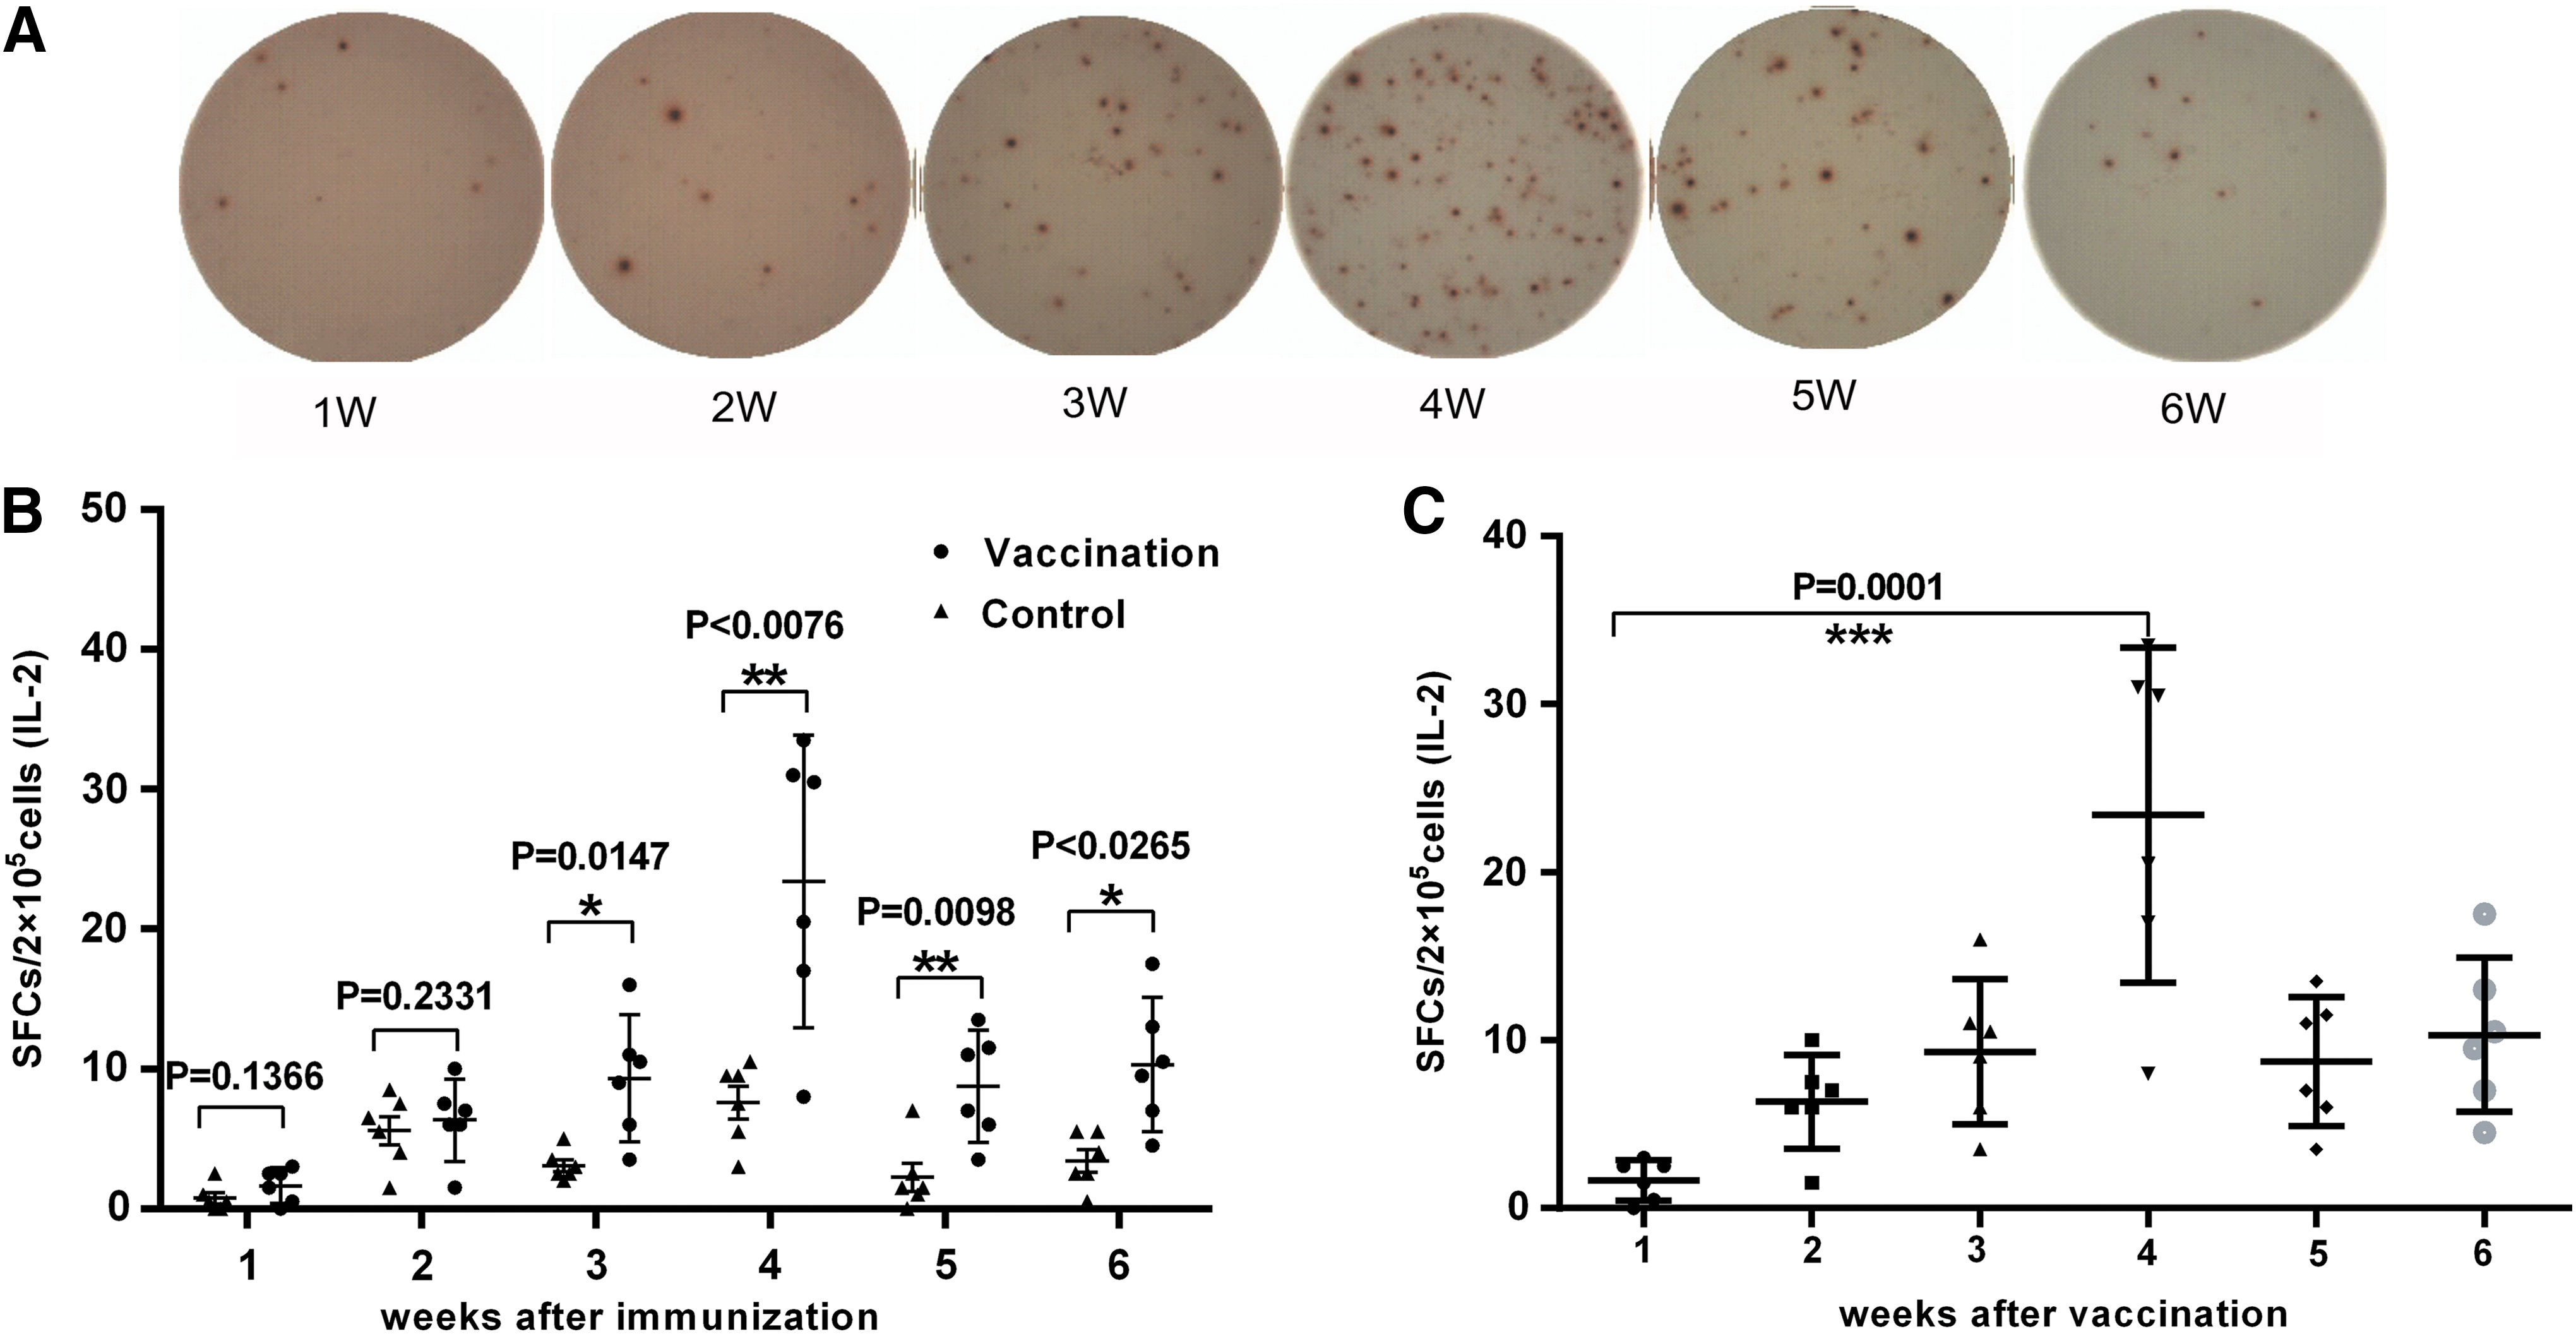
ELISpot assay for interleukin (IL)-2 expression.
EBOV GP-specific CD4+ T cell responses were examined as early as the first week by flow cytometric analysis. In week 1, the proportion of IFN-γ+CD4+ cells from the vaccine group was already significantly higher than in the control group (0.15%; p = 0.0011) and peaked at week 4 (1.01%; p < 0.0024). These increased levels lasted to week 6 (0.475%; p < 0.0001) (Fig. 3A). A similar trend was seen for IL-2+CD4+ cells, which also peaked at week 4 (1.11%; p < 0.0001) and were still present at week 6 (0.75%; p < 0.0001) (Fig. 3B). For EBOV GP-specific CD8+ T cell responses, after 3 weeks a statistically significant difference was observed in the proportion of CD8+IFN-γ+ (p = 0.0004) and CD8+IL-2+ cells (p = 0.0052) between the vaccine and control groups. Consistent with the ELISpot results, the fraction of CD8+IFN-γ+ and CD8+IL-2+ cells peaked at 0.87 and 0.56%, respectively, during week 4, and the difference between the vaccine and control group remained statistically significant through week 6 (p < 0.0001) (Fig. 3C and D).
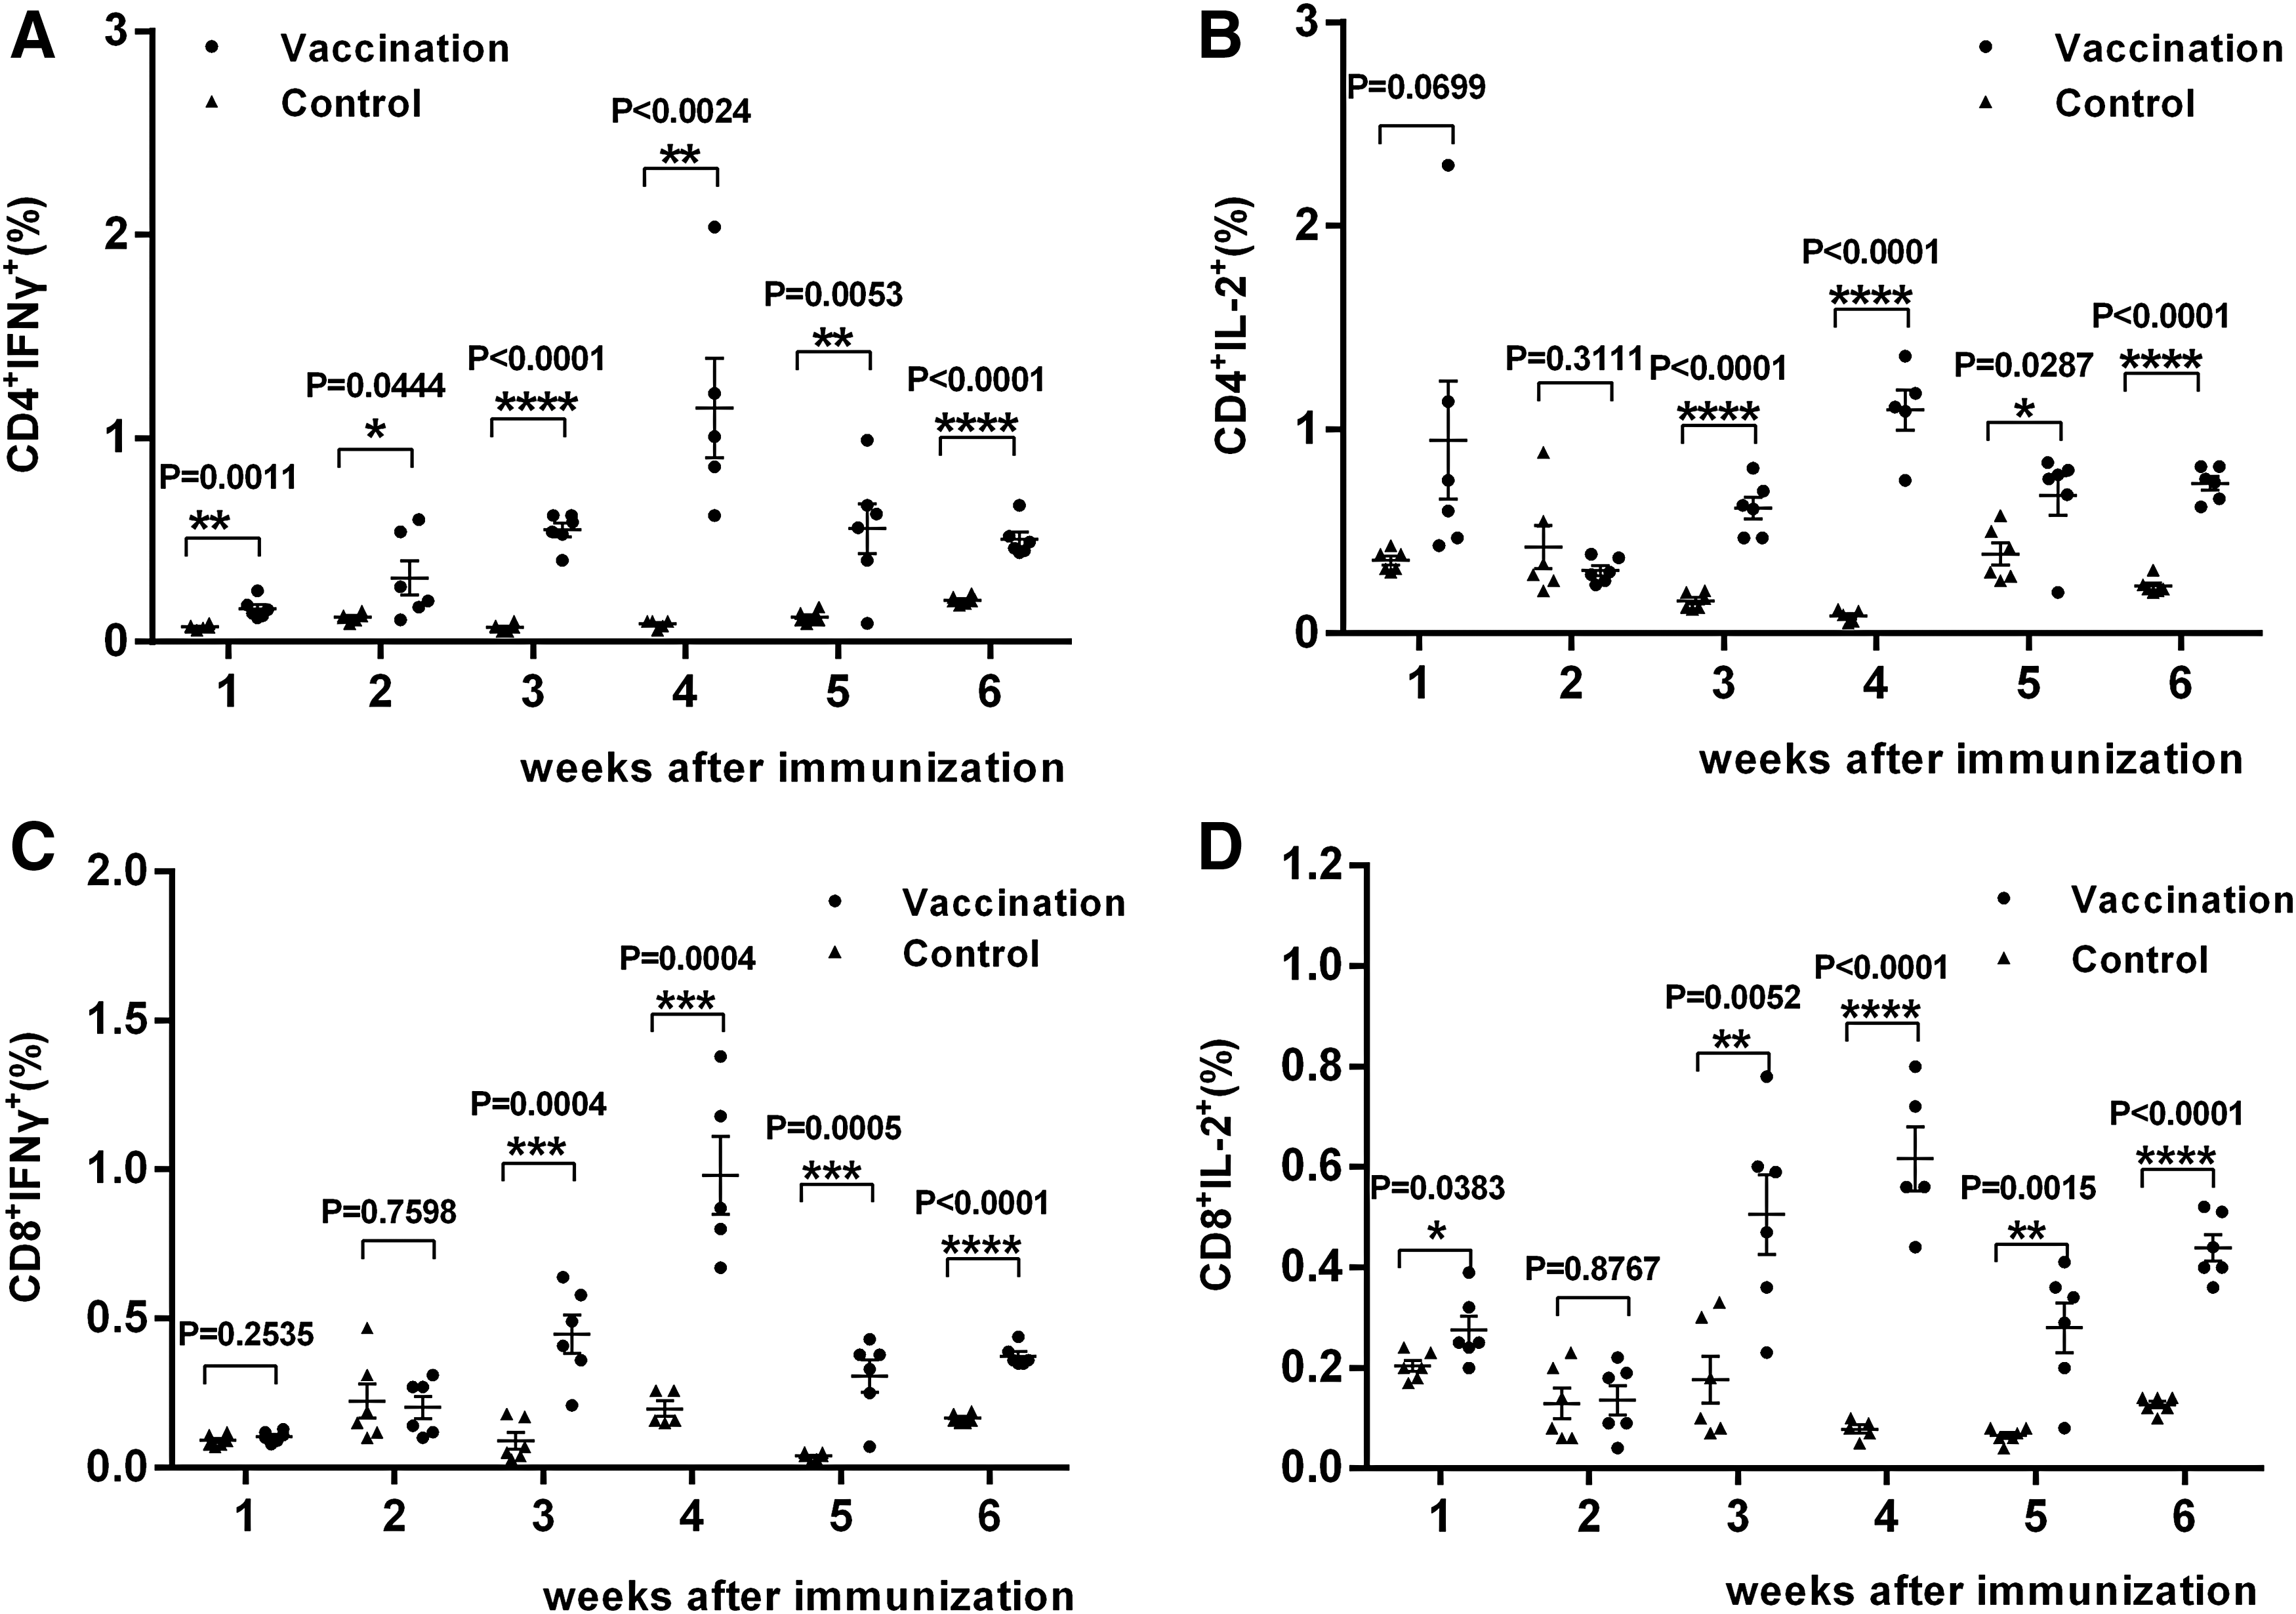
CD4+ and CD8+ T cell responses, as determined by flow cytometric analysis. The proportions of the indicated cell types were determined by flow cytometry, as follows:
Statistically significant differences among the various weeks in the vaccine group were also detected by flow cytometry, and again the most prominent difference was seen between the fourth week and the other weeks, and among all indicators, this difference was the most pronounced (Fig. 4).

Statistical difference over various weeks for the vaccine group. Statistical difference over various weeks for the indicated cell types by flow cytometry were analyzed, as follows:
Overall, the ELISpot and flow cytometry results were consistent. In both assays, cellular responses peaked at week 4 and continued through week 6 (Fig. 5). Although SFCs for both IFN-γ and IL-2 increased over time and peaked during week 4, the overall numbers of IL-2 SFCs were much lower than those for IFN-γ in the ELISpot assay (Fig. 5A). On the whole, specific-CD8+ cells responded relatively late and were present in fewer numbers compared with CD4+ cells, whereas CD4+ T cells showed high expression of both IFN-γ and IL-2 (Fig. 5B).
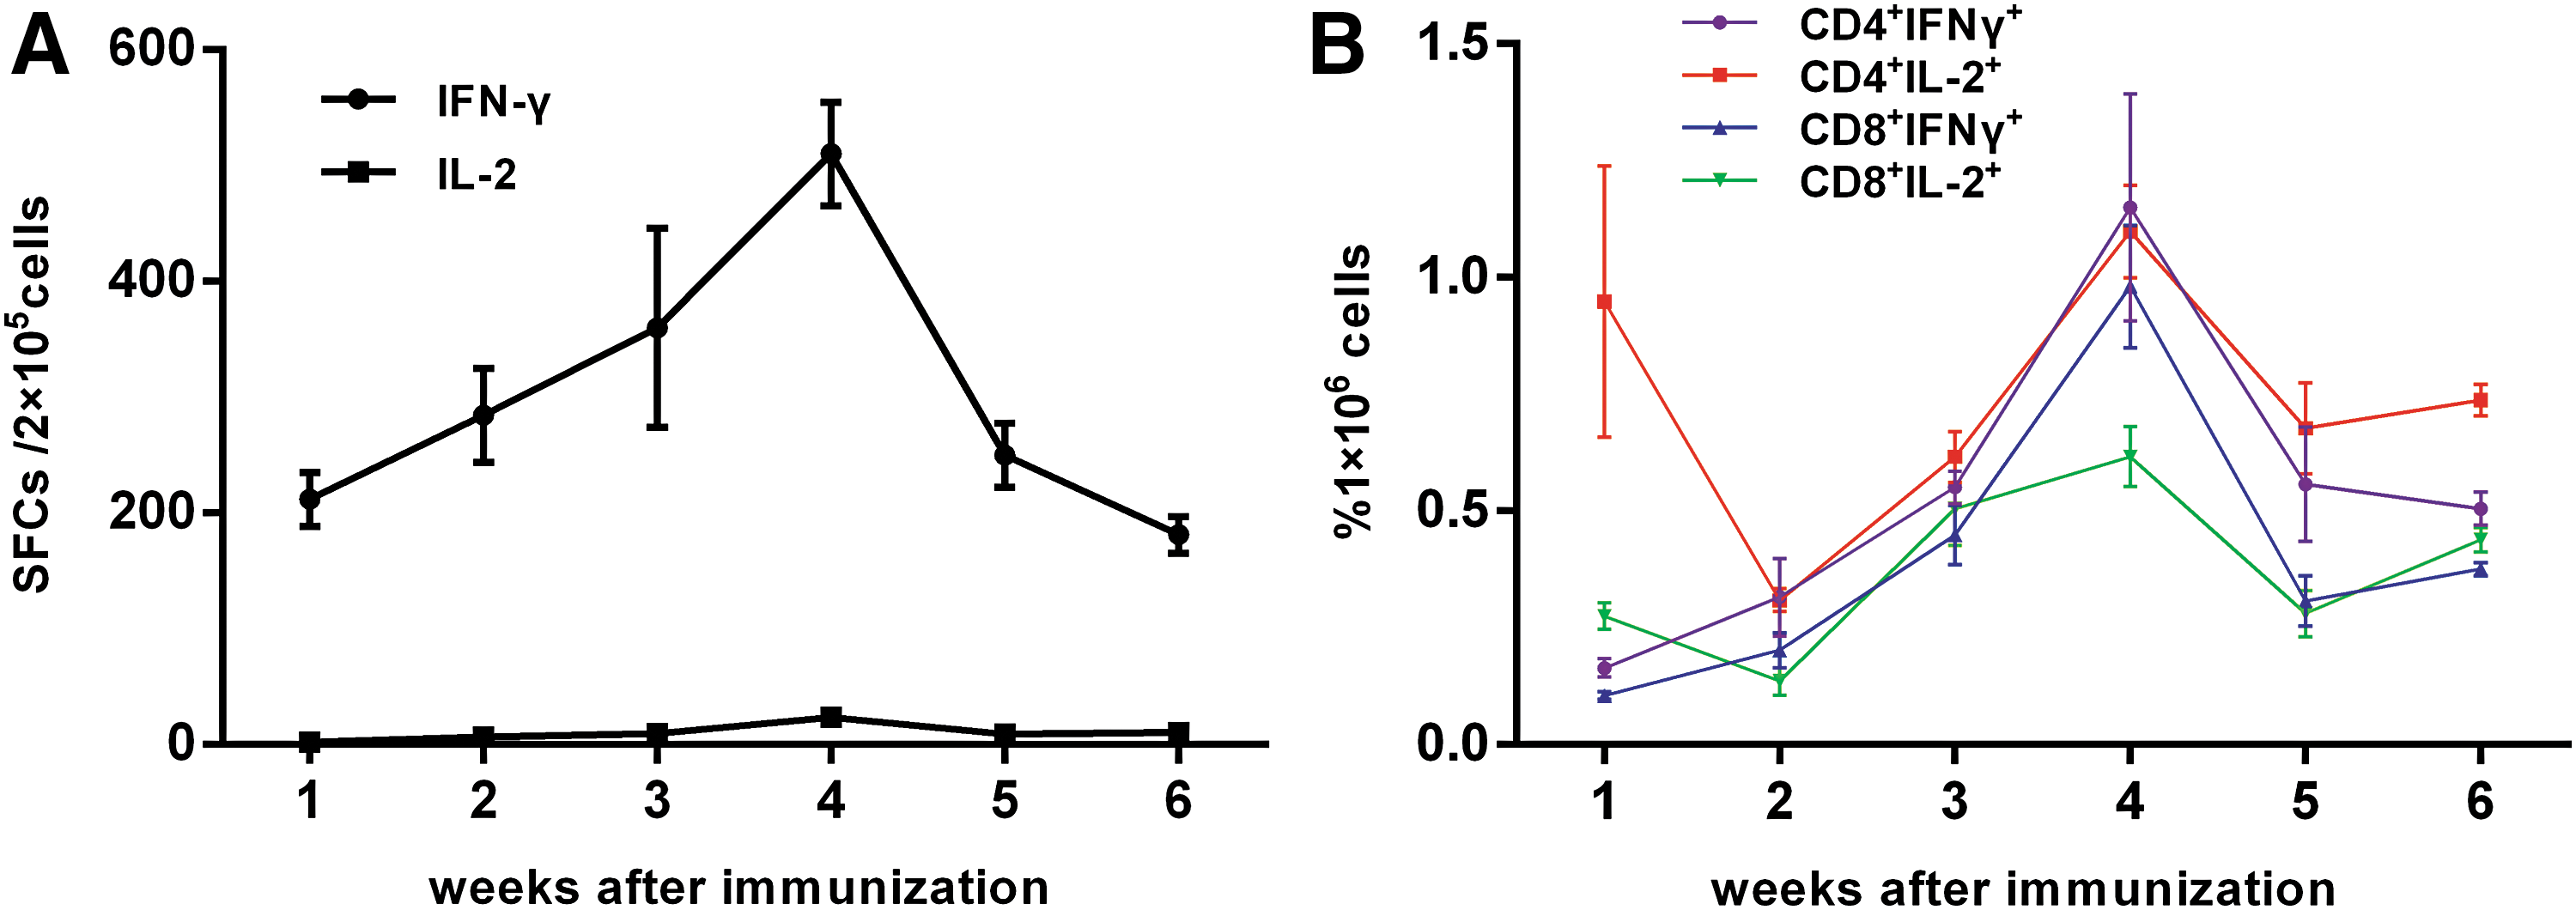
Summarized results from ELISpot and flow cytometry.
Humoral immune responses specific to EBOV GP
In the sera collected after immunization, robust ZGP-specific antibody responses were detected in all 10 mice from which samples were taken. The antibody titers gradually increased from week 1 to maintain a higher titer even to week 24 (Fig. 6A). ZGP-specific antibody titers were 5.0 log4 (95% CI, 4.0–7.0 log4) at week 1, peaked at 9.0 log4 at week 10, and then were maintained at 6.0 log4 (95% CI, 5.0–7.0 log4) (Fig. 6B).

ZGP-specific antibody responses measured by ELISA.
Meanwhile, there was no rapid production of high titers of EBOV NAbs, which were detectable only at week 2 after immunization, peaked at week 6, and then gradually declined to zero in all 10 mice by week 12 (Fig. 7A). Based on pseudovirus exposure results, NAb titers of the 10 immunized mice ranged from 1:2 to 1:8 in week 2, from 1:4 to 1:16 in week 4, from 1:8 to 1:16 in week 6, from 0 to 1:16 in week 8, from 0 to 1:2 in week 10, and was 0 for all at week 12 (Fig. 7B).

Detection of neutralizing antibodies (NAbs) in rAd5-EBOV-immunized mice.
Discussion
Vaccination is the most common and effective method for the prevention and control of infectious disease. Because EVD was previously largely confined to Africa and outbreaks typically occurred sporadically and lasted for a short period, progress on Ebola vaccine research and development had been slow. Because of its high infectiousness and high mortality, regulatory authorities have been cautious in granting approval of Ebola vaccines. Although several Ebola vaccine candidates have shown effective and rapid protection against lethal EBOV challenges in rodents and NHPs, 8 –12 none of these candidate approaches was approved for clinical trials before the 2014 outbreak. Trial initiation lagged for many reasons, including failures to perform safety and efficacy tests, disagreements over logistics and ethics, and data-sharing roadblocks. 18 The 2014 Ebola outbreak greatly impacted the world's public health security, and since then there has been unprecedented progress in Ebola vaccine development. Indeed, eight Ebola vaccine candidates are now in various stages of clinical evaluation. 14 Published studies showed that these candidate vaccines are well tolerated, safe, and elicit satisfactory immunogenicity in human beings. 10,19 –21 However, these clinical trials were not timely and were obviously initiated after the outbreak of the epidemic, which in turn hampered phase 2 and phase 3 clinical trials of the Ebola vaccine as the Ebola outbreak in West Africa wound down. Thus, the safety and efficacy of these vaccines still have not been fully and accurately evaluated, such that reliable Ebola vaccines may again be unavailable for future outbreaks.
Nonetheless, research on and development of Ebola vaccines should be sustained, and thus reliable and reproducible systems to evaluate vaccine performance are indispensable. Immunogenicity evaluation systems should be established as early as possible to facilitate the rapid and accurate assessment of vaccine effectiveness in national laboratories, as well as to analyze the correlation between immunologic results and the protective immunity provided by the vaccine. In terms of immunogenicity evaluation during quality control, the biological safety, operability, and 3R principles must also be considered in addition to vaccine biology and effectiveness.
Robust GP-specific memory T cell responses and high titers of ZGP-specific antibodies are of great significance for controlling EBOV infection after vaccination, as was shown by previous studies concerning the protective effects of Ebola vaccines. 22 –26
To evaluate the cellular and humoral immune response of Ad5-EBOV, we adopted BALB/c mice as an animal model and performed several assays that have been used in most clinical trials, 10,11,19 –21 including ELISpot, flow cytometry, ELISA, and assays of NAb activity. Our results suggest that cellular and humoral responses can be detected in BALB/c mice. The cellular response in mice was relatively slow and peaked at week 4, whereas the production of anti-GP antibody was rapid and persisted at high titers to week 24, although NAbs were present at lower titers. Comparing data from BALB/c mice with published data from phase 1 and phase 2 clinical trials of Ad5-EBOV, some similarities were noted. Acute and durable glycoprotein-specific antibody responses were all detected both in BALB/c mice and vaccinated subjects, whereas specific memory T cell responses appeared later before diminishing gradually. In general, BALB/c mice and the tested indicators should be appropriate to evaluate Ad5-EBOV efficacy.
BALB/c mice are an economical and easily accessible experimental animal, and the reagents used in our tests required no special protective facilities. As such, all assays could be carried out in a BSL-2 environment with minimal risk of biological hazards and techniques that require minimal specialized training or equipment. However, additional data will be needed to confirm the correlation between immunologic evaluation and protective immunity of the vaccine. As more data become available from clinical trials, we will expand our study to determine what level of cellular and humoral responses elicited in mice is appropriate to use for quality control, and to provide an important guarantee of recombinant adenovirus type 5 vector-based Ebola vaccine effectiveness. In the meantime, the level of immune responses we detected here in BALB/c mice will provide a good reference for quality control during future Ebola vaccine development, and results from this study can inform strategies for continued development of Ebola vaccines in China.
Footnotes
Acknowledgments
The authors thank Shipo Wu, Luo Yang, and Fang Chao for technical assistance and assistance with animal care. The authors also thank Lili Li for assistance in the preparation of the manuscript.
Author Disclosure
All authors declare that they have no conflicts of interest, and that this contribution has not been previously published. No competing financial interests exist.