
Abstract
Monitoring the fate of individual cell clones is an important task to better understand normal tissue regeneration, for example after hematopoietic stem cell (HSC) transplantation, but also cancerogenesis. Based on their integration into the host cell's genome, retroviral vectors are commonly used to stably mark target cells and their progeny. The development of genetic barcoding techniques has opened new possibilities to determine clonal composition and dynamics in great detail. A modular genetic barcode was recently introduced consisting of 32 variable positions (BC32) with a customized backbone, and its advantages were demonstrated with regard to barcode calling and quantification. The study presented applied the BC32 system in a complex in vivo situation, namely to analyze clonal reconstitution dynamics for HSC grafts consisting of up to three cell populations with distinguishable barcodes using different alpha- and lentiviral vectors. In a competitive transplantation setup, it was possible to follow the differently marked cell populations within individual animals. This enabled the clonal contribution of the different BC32 constructs during reconstitution and long-term hematopoiesis in the peripheral blood and the spatial distribution in bone marrow and spleen to be identified. Thus, it was demonstrated that the system allows the output of individually marked cells to be tracked in vivo and their influence on clonal dynamics to be analyzed. Successful application of the BC32 system in a complex, competitive in vivo situation provided proof-of-principle that its high complexity and the large Hamming distance between individual barcodes, combined with the easy customization, facilitate efficient and precise quantification, even without prior knowledge of individual barcode sequences. Importantly, simultaneous high-sensitivity analyses of different cell populations in single animals may significantly reduce numbers of animals required to investigate specific scientific questions in accordance with RRR principles. It is concluded that this BC32 system will be excellently suited for various research applications in regenerative medicine and cancer biology.
Introduction
R
Human immunodeficiency virus type 1–derived lentiviral vectors show a preference for integrating into transcribed gene regions but have a decreased tendency for promotor regions. 5,6,13,14 To date, there are no reports of integration site–related adverse effects for lentiviral vectors in clinical HSC gene therapy trials, 11,12,15,16 even though their principal potential to induce malignant transformation has been demonstrated in preclinical studies using strong virus-derived internal promoters. 17,18
To date, the recently introduced alpharetroviral vectors have been used in preclinical approaches, for example for transduction of HSCs, T cells, and natural killer (NK) cells. 19 –22 The integration profile of alpharetroviral vectors shows only weak preferences toward active genes and associated genomic features, thereby resulting in a relatively neutral integration pattern. 5,23 The additional availability of a self-inactivating system, even with high virus titers, the generation of a stable packaging line, 21,24 and the ability to transduce non-dividing cells 25,26 makes them an interesting alternative to the commonly used gamma- and lentiviral vectors. Clonal dynamics after gene therapy or in murine transplantation settings historically have been analyzed using vector integrations sites (VIS). These can be determined via ligation mediated (LM)-polymerase chain reaction (PCR) or linear amplification mediated (LAM)-PCR. 27,28 However, the methods are laborious and limited by technical and sensitivity aspects. 29,30 HSC transplantation models have been performed in which the respective vector construct was analyzed in a variety of bone marrow (BM)-derived cell populations and within mostly mature cell populations taken from peripheral blood (PB), the spleen, and the thymus. 31 –34 Still, the contribution of the respective clone to the marked population remains unclear, since the quantification of the clonal abundance via these methods is imprecise. 32,35
In recent years, unique sequence tags, referred to as genetic barcodes (BCs), have been inserted into retroviral vectors. BCs can be used to trace the clonal offspring of any transduced cell easily. 36 As such, BCs have, among others, been applied to quantify the dynamics of hematopoietic reconstitution, HSC contribution over time, as well as leukemia formation. 37 –44 These BC systems offer several advantages over VIS such as easy readout, high sensitivity, and independency from genomic surroundings as well as good quantification.
An advanced BC system was recently presented consisting of 32 variable positions (BC32), 45 theoretically creating up to 1.8 × 10¹⁹ different BCs. Sixteen pairs of variable positions are interspaced by nucleotide triplets with known sequences, thereby generating the (barcode-)backbone. Shuffling the triplet order creates different backbones that can be linked with defined other features of the vector such as different promoters or fluorescent proteins, enabling multiplexing. 41 Changing only the order of triplets but not their respective sequence retains the GC content between the different backbones. As all barcodes are flanked by modified Illumina-Adaptors for sequencing, a single PCR is sufficient for unbiased amplification of all backbones from the samples and their preparation for next-generation sequencing (NGS).
This study questioned whether this BC construct facilitates comparative in vivo studies addressing the individual contribution of differentially marked cell populations within one and the same animal. To address this question in a proof-of-principle approach, three lentiviral and two alpharetroviral vector constructs carrying specific barcode backbones in conjunction with different promoter types we generated: a strong spleen focus-forming virus (SFFV), an intermediate human elongation factor-1 alpha short (EFS), 46,47 or no (promotor-deprived [pd]) promoter. All of these self-inactivating vector constructs were expected to track an essentially undisturbed hematopoietic reconstitution, as only low transforming potential has been reported for the SFFV promoter, while no re-plating frequency could be detected for the EFS promoter or pd vectors. 17,23,31 To assess proof-of-principle for the suitability of the barcoding system for comparative analyses in single animals, the study made use of HSCs transduced with different alpha- and/or lentiviral vectors. Specifically, barcoded grafts were competitively used in a sensitive murine BM transplantation model 31 –33,48,49 to track individual cells in vivo and to analyze their potential impact on clonal dynamics. By detection of the different barcodes in the PB over time as well as in BM and spleen, it was possible to assess temporal and spatial distribution of clones.
Materials and Methods
Generation of barcoded retroviral vectors
Lentiviral gene ontology and the alpharetroviral vectors have been described earlier.
24,50,51
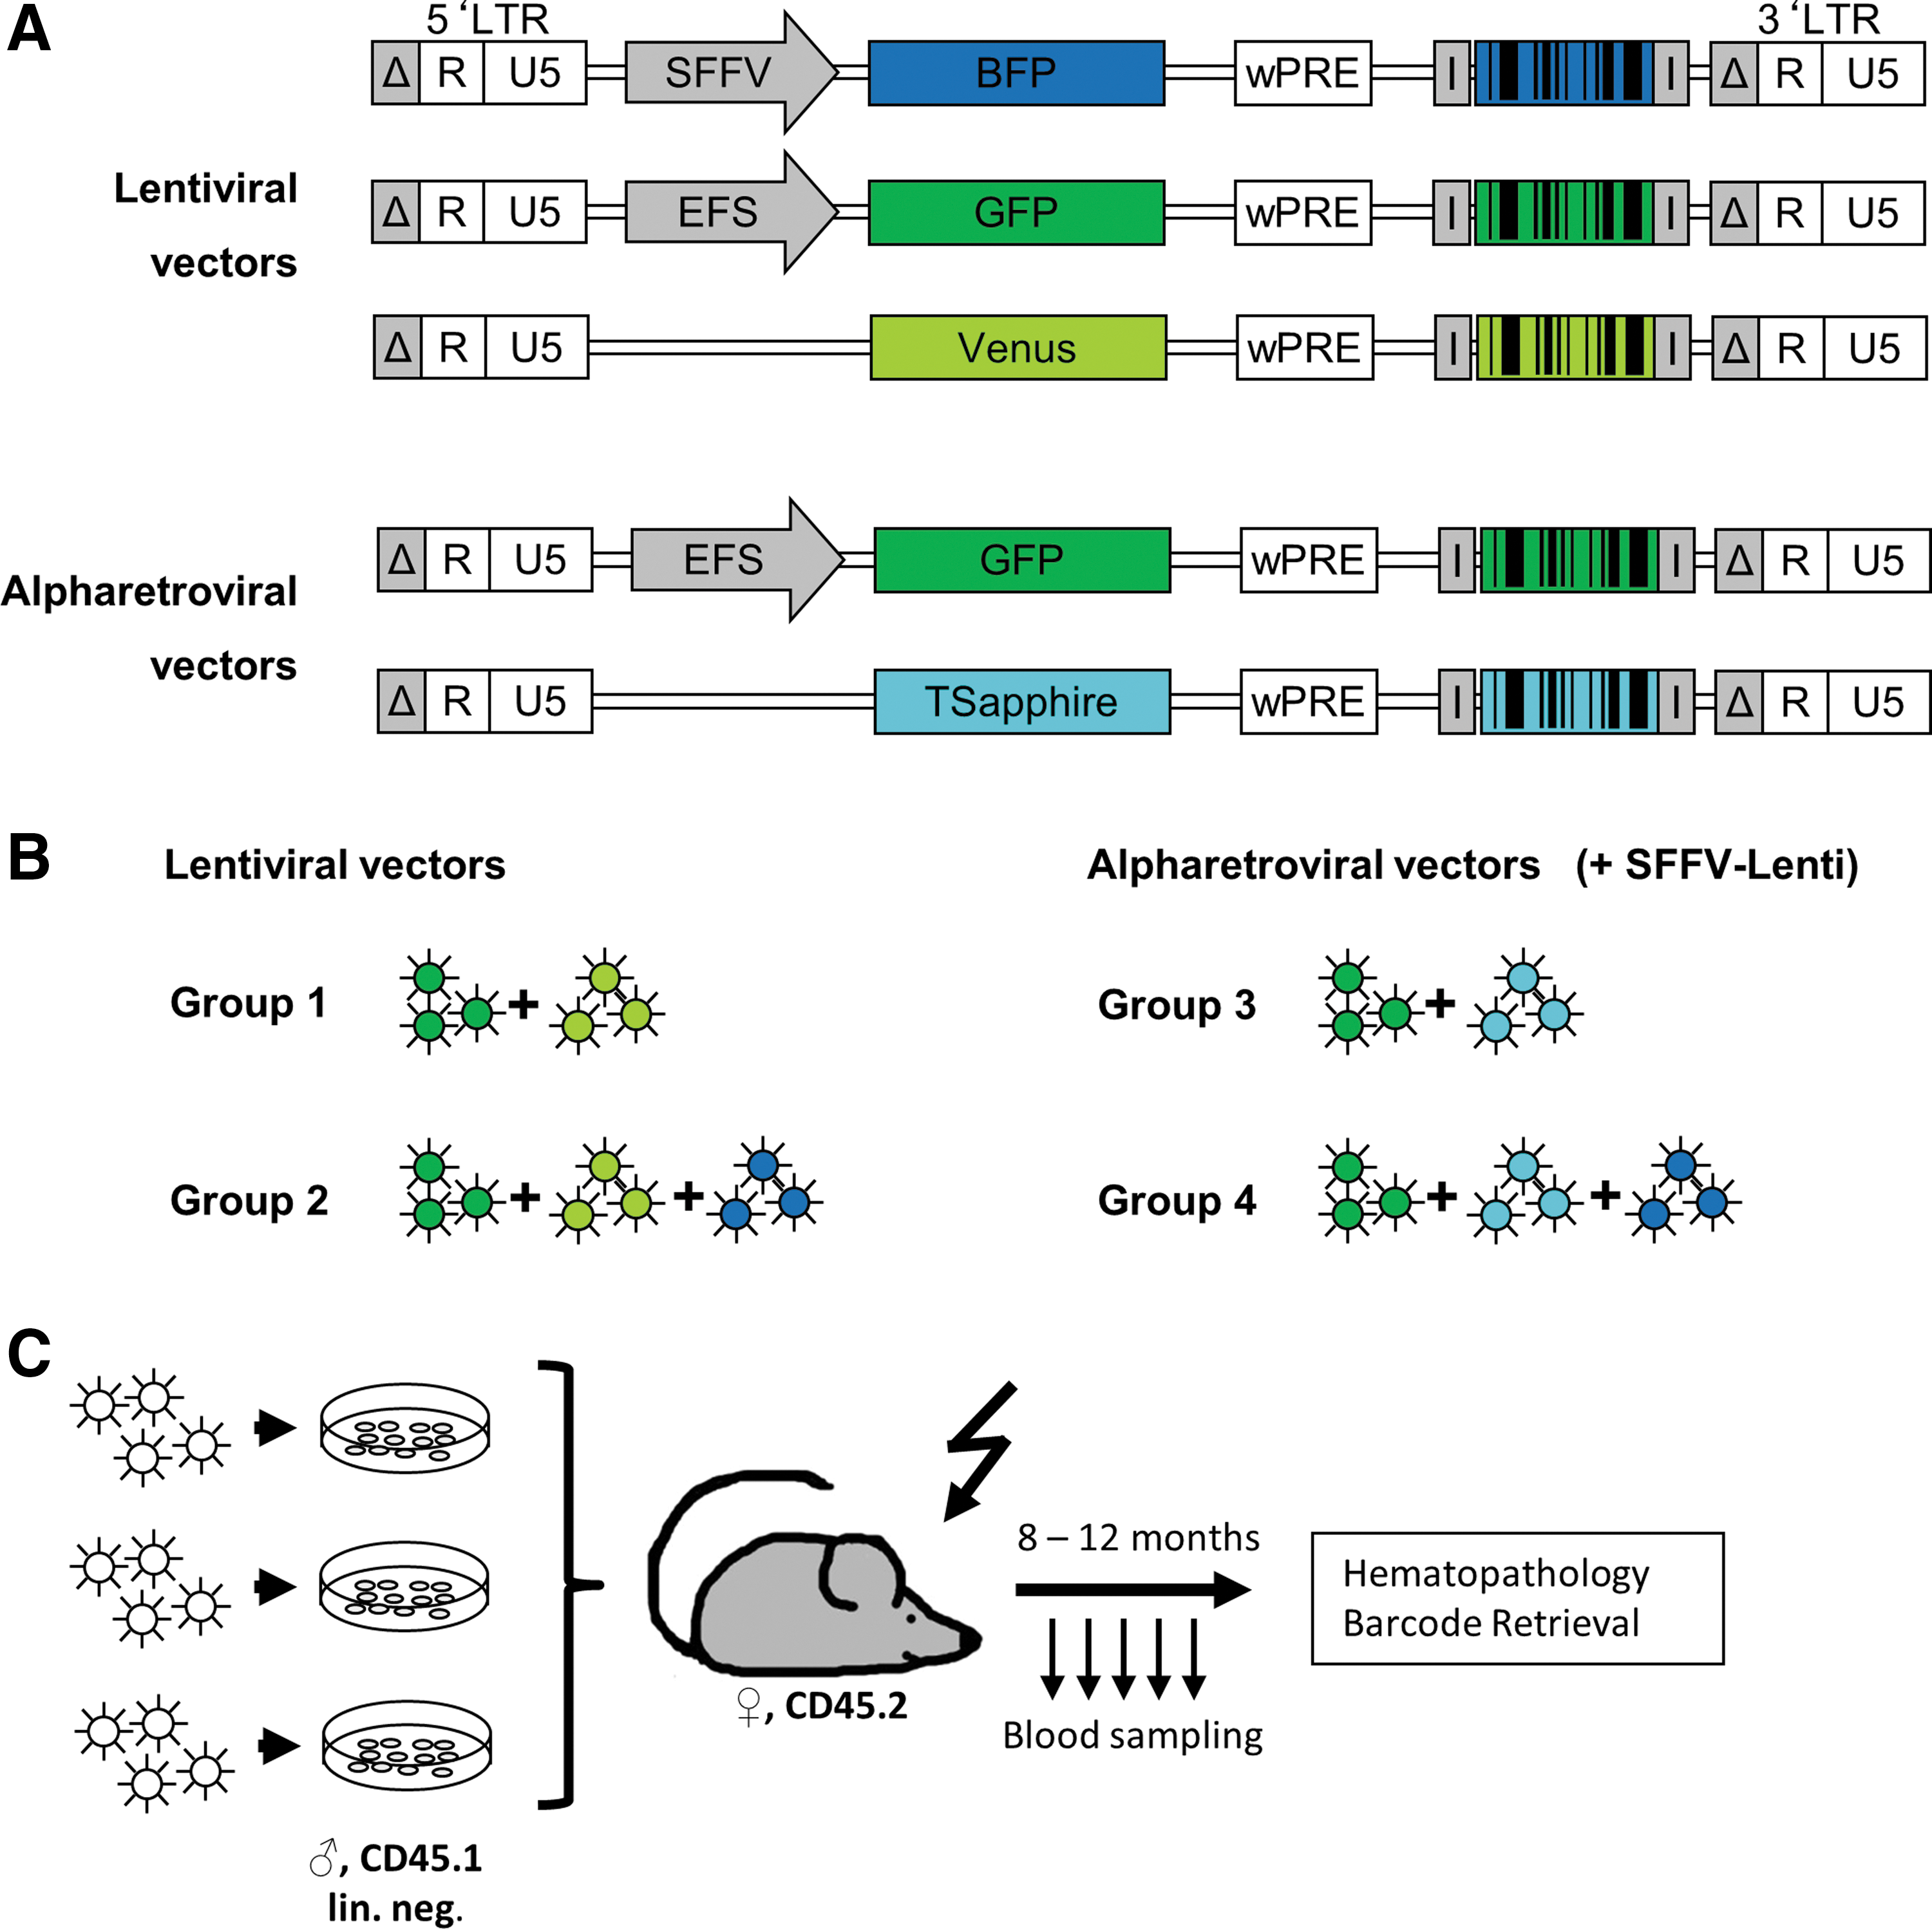
A barcode cloning site containing the truncated sequence for the Illumina-Indexed-Adaptor, as well as the unique restriction enzyme recognition sites for XbaI and XhoI, was inserted 3′ of the wPRE element. The barcode consists of 16 variable doubles, which are interspaced by nucleotide triplets with known sequences (Fig. 1), thereby generating the (barcode-)backbone. Promoters and fluorescent proteins (FP) were exchanged using the flanking, unique restriction sites present in both vector systems (Fig. 2). Double-stranded barcodes were created by a 10-cycle PCR on the single-stranded oligos (Supplementary Tables S1 and S2; Supplementary Data are available online at

General structure of the BC32 system. Schematic overview of the 32 wobble barcode (BC32) design. The barcode is inserted downstream of the wPRE element into the alpha- or lentiviral vectors and flanked by truncated adaptors used for next-generation sequencing. The barcodes consists of 35 variable positions (“N”), where each N is randomly determined during oligo synthesis and therefore represents 25% chance for each nucleotide. Pairs of those variable bases are intercepted by fixed nucleotide triplets (colored), defining a barcode backbone. Altering the sequence of those triplets allows generation of different barcoded backbones. Using a certain backbone in combination with another parameter, for example a Venus fluorescence protein, allows determination of the underlying construct by just analyzing the barcode sequence. The first three variable positions are used for solving the difficulty of cluster calling on the flow cell in low complex samples and are not used in sequence evaluation. Constructs were equipped with different fluorescent proteins and promoters (strong spleen focus-forming virus [SFFV], human elongation factor-1 alpha short [EFS], promoter-deprived [pd]). I: modified Illumina-Adaptors for sequencing.
Vector construction and experimental setup.
Production of viral vectors
Lentiviral supernatants were produced in HEK-293T cells, according to the published protocol. 50 Alpharetroviral particles were produced according to Suerth et al. 24 All vectors were pseudotyped with VSV-g. The supernatants were concentrated approximately 10-fold by overnight centrifugation (8,000 g at 4°C). Titer determination for promoter carrying constructs was done according to an established protocol. 51 As flow cytometry (FC)-based titration of promoter-deprived constructs was not possible, they were produced in parallel with their respective EFS-promoter counterparts and titers assumed to be similar (Supplementary Table S4).
BM preparation, stimulation and transduction
All animal procedures in this work were conducted in accordance with the regulatory guidelines and approval from the local authorities (Behörde für Gesundheit und Verbraucherschutz-Veterinärwesen/Lebensmittelsicherheit) and the University Medical Center Hamburg-Eppendorf (UKE). Food and water were available ad libitum.
BM cells were harvested from tibia, femur, and ilium of 8- to 10-week-old male, CD45.1, C57Bl/6 donor mice. Lineage depletion was performed, according to the manufacturer's instructions (Lineage Cell Depletion Kit, mouse; Miltenyi Biotec, Bergisch Gladbach, Germany). The lineage-negative cells were pre-stimulated in StemSpan™ (STEMCELL Technologies, Vancouver, Canada), supplemented with 20 ng/mL of murine thrombopoietin and murine insulin-like growth factor II, as well as 10 ng/mL of murine stem-cell factor and human fibroblast growth factor (IGF from R&D Systems, Minneapolis, MN; the others from PeproTech, Rocky Hill, NJ). 52 After 3 days of stimulation, cells were transduced by spinoculation, and polybrene treatment with the respective viral construct at multiplicities of infection (MOI) of 30–50 overnight. 32 Transduction efficiencies of FP-containing constructs were analyzed by FC after 3 days of in vitro culture.
Up to three of the independently transduced populations (Fig. 2b) were combined to compose one graft with a total of 400,000 lineage-negative cells the day following transduction. The grafts were transplanted into 8-week-old lethally irradiated (9.5 Gy; total body irradiation) female, CD45.2, C57Bl/6 recipients by intravenous injection. Starting 6 weeks after transplantation, monthly blood samples (2–3 drops) were taken by submandibular bleeding. Genomic DNA was extracted from all samples (QIAamp DNA Blood Mini Kit; Qiagen) for barcode analyses, and FC was used to determine chimerism as well as FP expression at selected time points. Animals were sacrificed 8–12 months post transplantation (Fig. 2c). To determine FP expression and barcode content, PB, BM, and spleen were harvested. The lineage-negative fraction of BM cells was also enriched by lineage depletion. Furthermore, the Gr-1+ or Ly.6G+ myeloid population, T cells (CD3e+), and B cells (B220+) were sorted (antibodies are listed in Supplementary Table S5). Genomic DNA from sorted subsets was extracted using the QIAamp DNA Micro Kit (Qiagen), according to the manufacturer's instructions.
Barcode retrieval and NGS
A total of 172 samples from 16 animals (four per group) were selected for NGS. Barcode amplification, multiplexing, as well as the bioinformatic processing for the BC32 system were described previously. 45 In the literature, “biologically relevant” clones are defined by an absolute threshold, commonly >0.5% total blood or BM contribution. 40,53,54 As the aim was to compare clonal dynamics of the different constructs, a relative threshold applicable over all vector constructs was required. Thus, all barcodes with frequencies <0.5% in the respective backbone were omitted. Furthermore, individual backbones with <800 reads were excluded, which also contributed <5% of total sample reads. These values were chosen based on the expectation of around 20–30 recovered barcodes per sample, thus 800 reads resembling 30–40 × barcode coverage. All further analyses were performed on this data set. The only exception was the barcode distribution analysis (Fig. 3), which was performed with a more sensitive barcode frequency threshold of 0.1%. In-depth analysis and graphical display of the data set were done with Microsoft® Excel or customized R scripts using available packages.
Transduction efficiency and fluorescent protein expression during observation time.
Results and Discussion
Competitive in vivo setup
In this proof-of-principle approach, the aim was to demonstrate the multiplexing capabilities of the BC32 system. Therefore, the clonal dynamics of hematopoietic reconstitution were investigated in an competitive transplantation setting with up to three different vector constructs in a sensitive murine transplantation model. 31 –33,49 Three barcoded lentiviral and two barcoded alpharetroviral vector constructs were designed (Fig. 1) equipped with different FPs and promoters. To compare the five different vector constructs, four competitive in vivo groups were set up, with 9-12 mice per group. Each group received transduced lineage-negative BM cells, independently marked with two or three different BC constructs (Fig. 1b). Group 1 received cells transduced with the lentiviral EFS-GFP or the pd-Venus constructs. The graft of group 2 contained cells transduced with either one of the two already mentioned vectors or the third lentiviral SFFV-BFP construct. Group 3 received cells transduced with the two alpharetroviral vectors, EFS-GFP or pd-TSapphire. The graft of group 4 represented a mix of three populations independently transduced with both alpharetroviral vectors and the lentiviral SFFV-BFP construct. The denomination of the animals in the following sections lists the group membership followed by the individual number, for example mouse 1.2 describes the second animal in group 1.
Measurable transduction of murine HSC/HPC with vectors containing promoters and successful engraftment
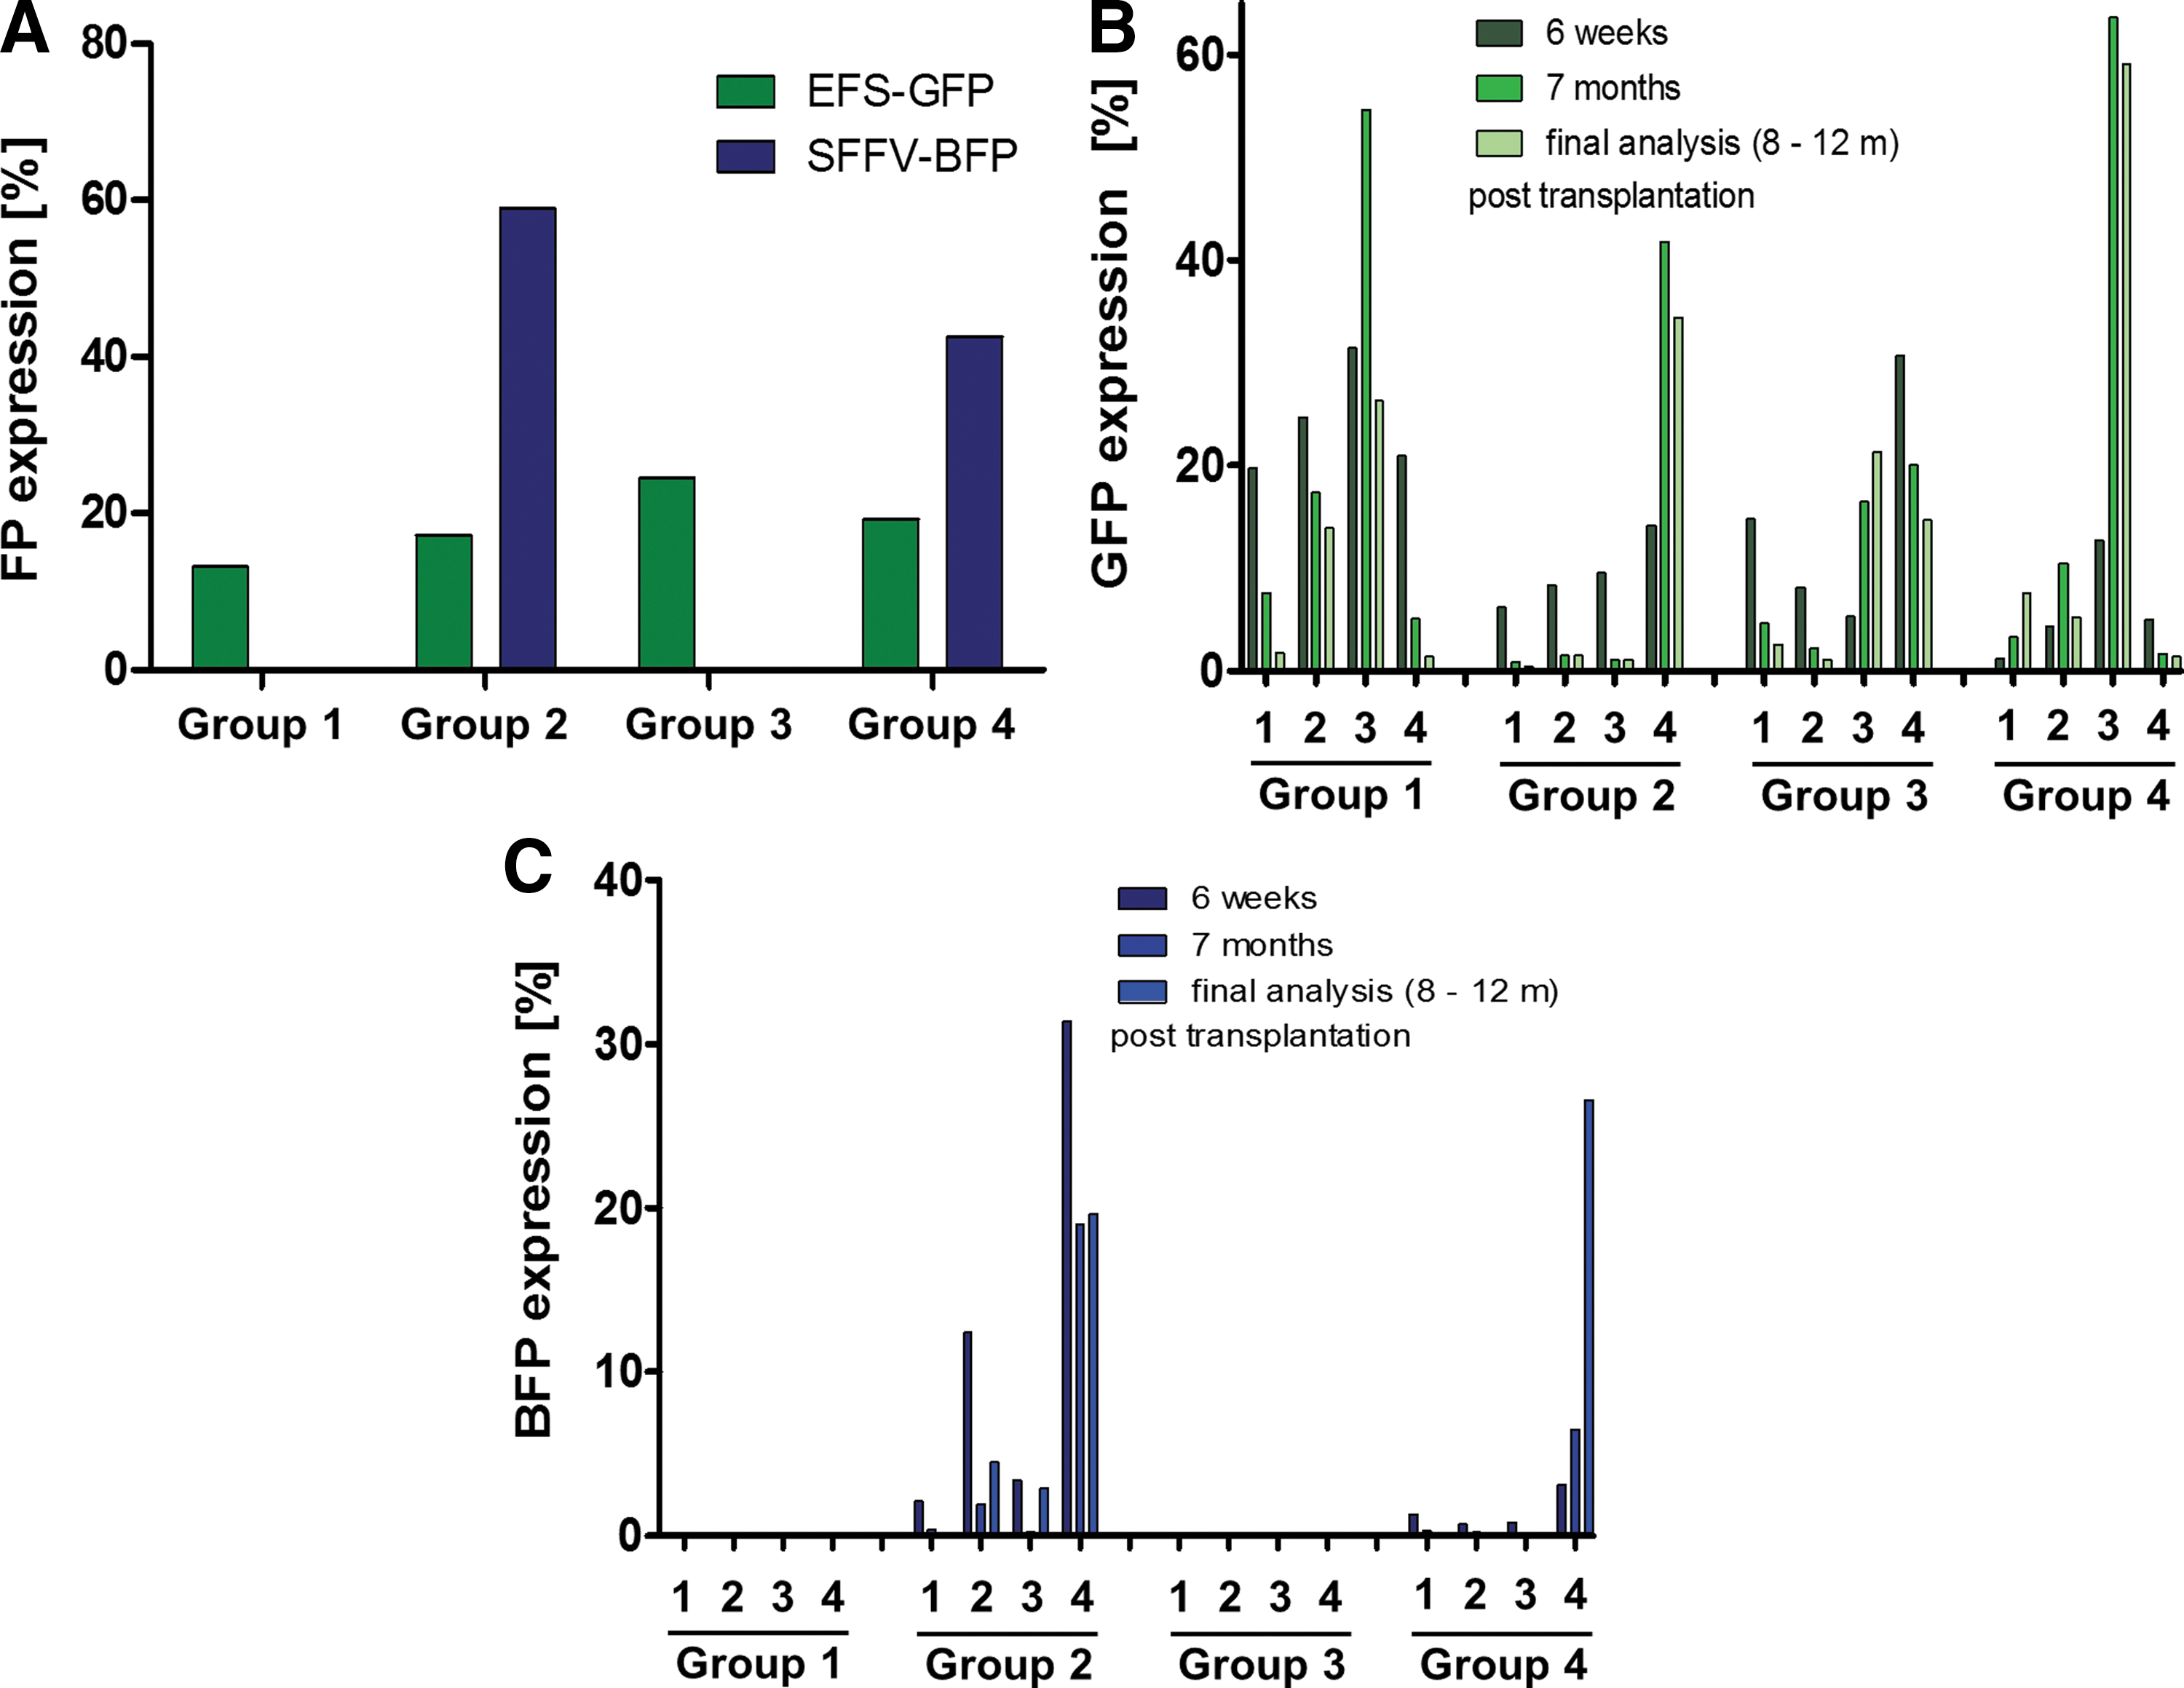
In order to avoid multiple barcode integrations per cell, barcoding experiments should aim for transduction efficiencies of <30%. 55 Transduction rates of the promoter carrying constructs were determined via FC 72 h post transduction. As Fig. 3a shows, transduction rates for the GFP vectors were around the targeted 15–20%. Unexpectedly, transduction rates for the BFP vectors were around two to three times higher, even though identical MOI were used.
FC analysis in PB samples 6 weeks after transplantation revealed a mean chimerism of 79.9% (range 68.1–87.3%), indicating efficient engraftment. Around 200 days after transplantation, a mean of 94.3% of the hematopoietic system was derived from donor cells (range 87.2–98.5%), thus demonstrating stable long-term engraftment. Although all animals initially received cells with similar transduction rates for all of the alpha- or lentiviral EFS-GFP vector constructs, FC at the late time points showed large deviations between individual mice. Four representative animals per group (based on FP expression) were chosen for in-depth clonal analysis. The percentage of GFP-expressing cells, measured in the first PB samples analyzed 6 weeks post transplantation, ranged from 1.2% to 31.5%. The proportion of GFP-expressing cells declined over time in the majority of the animals, but some exceptions were observed (mouse 1.3, 2.4, 3.3, and 4.1; Fig. 3b), where GFP expression levels at later time points were higher than the initial values. The same holds true for the lentiviral SFFV construct expressing the BFP protein. Again, strong deviations in the content of BFP-positive cells between the animals were detectable in the PB 6 weeks after transplantation (0.7–31.4%) and additionally during the observation time of 8–12 months (0.1–26.6%; Fig. 3c).
Appearance of single barcodes in the samples: quality control
To assess the clonal contribution of vector-marked cells in the respective samples, one PCR was performed per sample for barcode retrieval from the genomic DNA. By applying Illumina-Index-primers, the obtained PCR products could be used directly for sequencing. Overall, 710–1,768 barcodes were recovered for each specific construct (Fig. 4). Even though the specific barcode sequences present in the libraries a priori were not known, the backbone-coding capabilities of the BC32 system as well as the competitive setup allow for a good estimation of background contamination levels. These are a critical parameter for any barcoding experiment. 53 As Fig. 4 demonstrates, on average 93.6% of recovered barcodes were uniquely detected in only one animal. Around 4.6% of barcodes were found in two animals, and 1.7% of barcodes were present in three or more animals. These findings agree with the experimental setup, in which up to four animals received the same grafts and thus potentially the same barcode sequences. Single barcodes incidentally found in more than four animals presumably represent background or NGS flow-cell contaminations. This is also illustrated by the observations that the read counts were very low and most of the “spilled” barcodes carried “wrong” backbones (e.g., Venus-barcodes in animals not receiving Venus cells). After applying the quality control filter to exclude low read count samples and barcode backbones described in the methods section, the analyzed samples displayed a mean background contamination level of 0.19% (range 0–13.8%). Of note, only two samples (one with <10,000 total reads only) showed high levels of contamination (13.8% and 4.6%), probably related to cross-contamination during sample preparation. A total of 86% of samples displayed <0.2% false-positive reads. Consequently, nearly all of the false-positive barcodes were discarded by excluding low-frequency barcodes (see Methods section). In addition, the barcodes in the data set displayed an average Hamming distance (different positions between two barcodes) of 24 after bioinformatic correction of PCR and sequencing errors. 45 This ensured clear discrimination and assignment of barcodes and minimized the likelihood of combining unrelated barcodes.
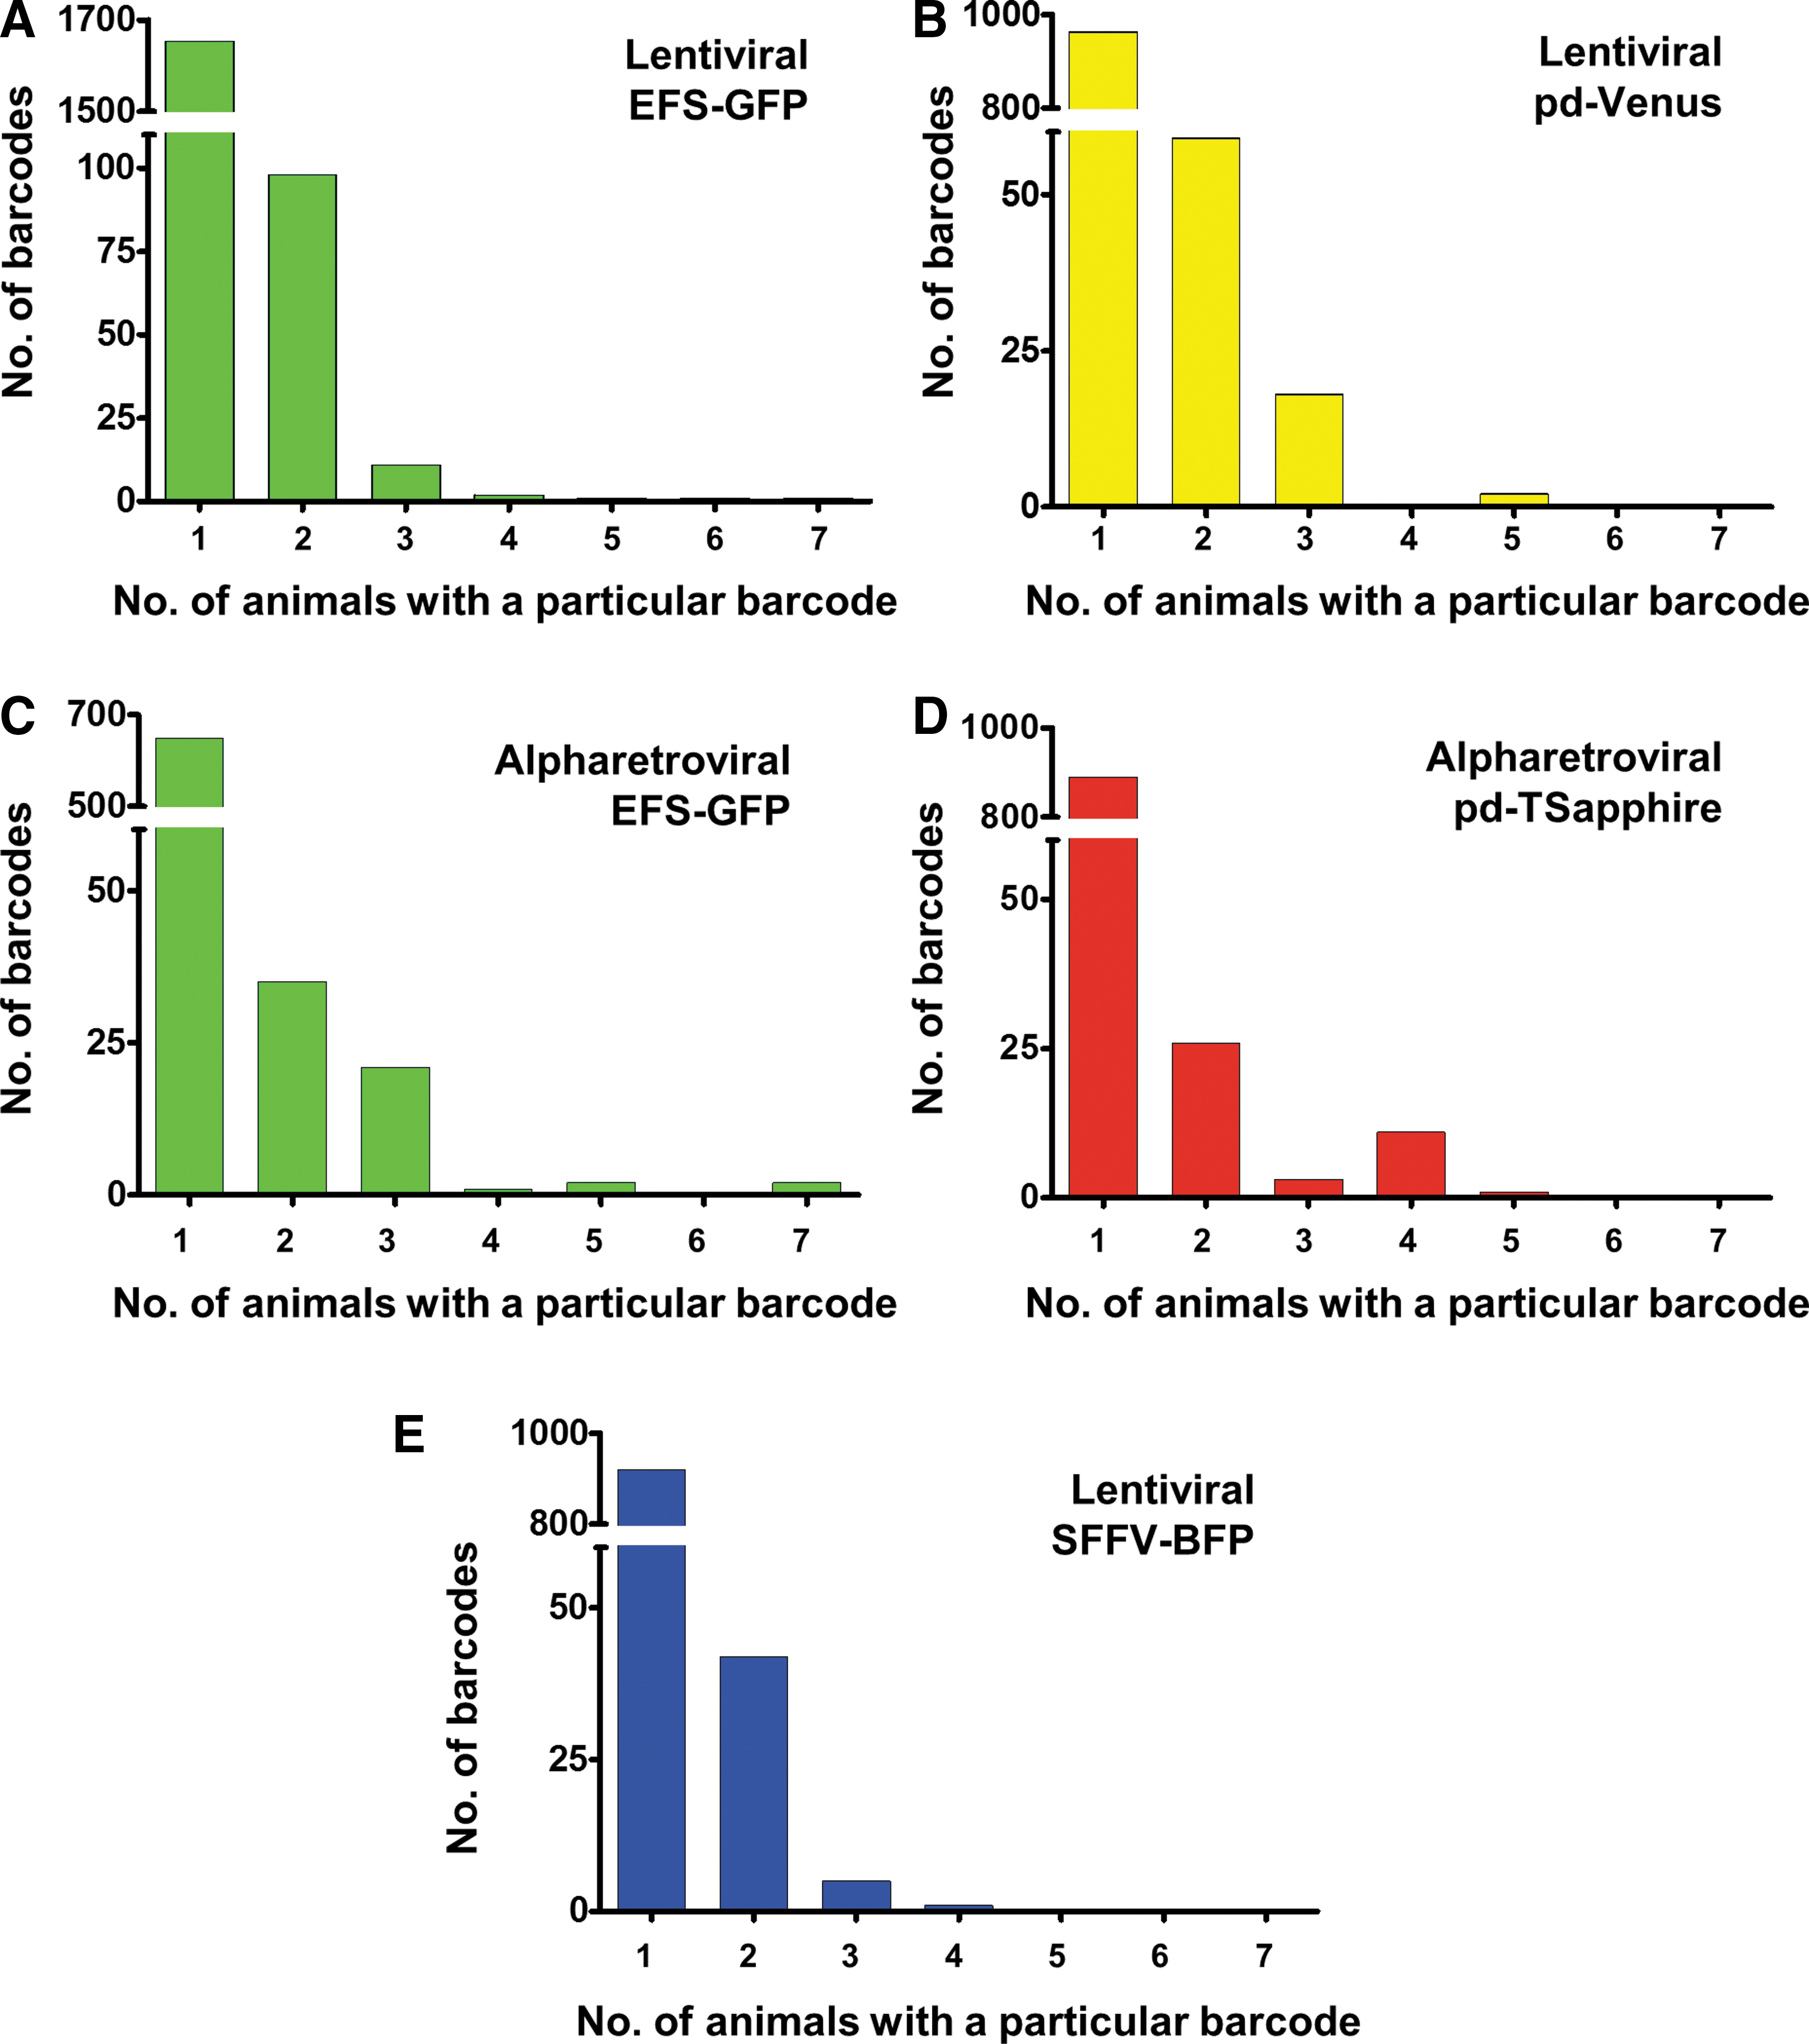
Incidence of particular barcodes in different animals. Unique barcodes were counted and analyzed in all animals. Incidence of
In summary, the design of the BC32 combined with a competitive setup allowed background contamination to be estimated, which could then be filtered with appropriate thresholds. It thus provides a robust system for marking cell populations while still ensuring an adequate complexity for separation of distinct barcodes.
Barcode distribution and clonal dynamics
Next, the barcode distribution was analyzed per construct in each sample. For each experimental group, the barcode content in PB, BM, and spleen was determined at the final analysis and additionally sequenced three to five PB samples, taken during the entire observation period. Furthermore, to obtain deeper insights into the different compartments of the PB, the lineage-negative fraction from the BM and sorted CD3+ T cells, B220+ B cells, and the Gr-1+ or Ly.6G+ granulocytes/macrophages out of the spleen samples were analyzed. Barcode analysis revealed around 30 different barcodes per backbone in each sample, thus 60–90 clones in total, which is in line with other reports in comparable settings. 42,44 An oligo- to polyclonal picture was obtained for the clones that contributed to hematopoietic reconstitution and long-term hematopoiesis, as shown by representative bar plots from one mouse per experimental group (Fig. 5). A polyclonal situation was observed at the beginning of the observation time (6 weeks post transplantation) for all vector constructs, independently from origin or promotor, with decreasing numbers of clones over time. For every vector construct, prominent barcodes were detected, which were present over all time points and in all organs analyzed, and only changes in their quantitative contribution could be recorded. This is in line with earlier observations showing that the clonal contribution is largely stable after hematopoietic reconstitution following HSC transplantation, whereas more fluctuating clones are detectable in a treatment-naïve situation. 56 Within each group, the study was confronted with large inter-animal variances regarding the clonal diversity, confirming the discussed FC results (compare Fig. 3).
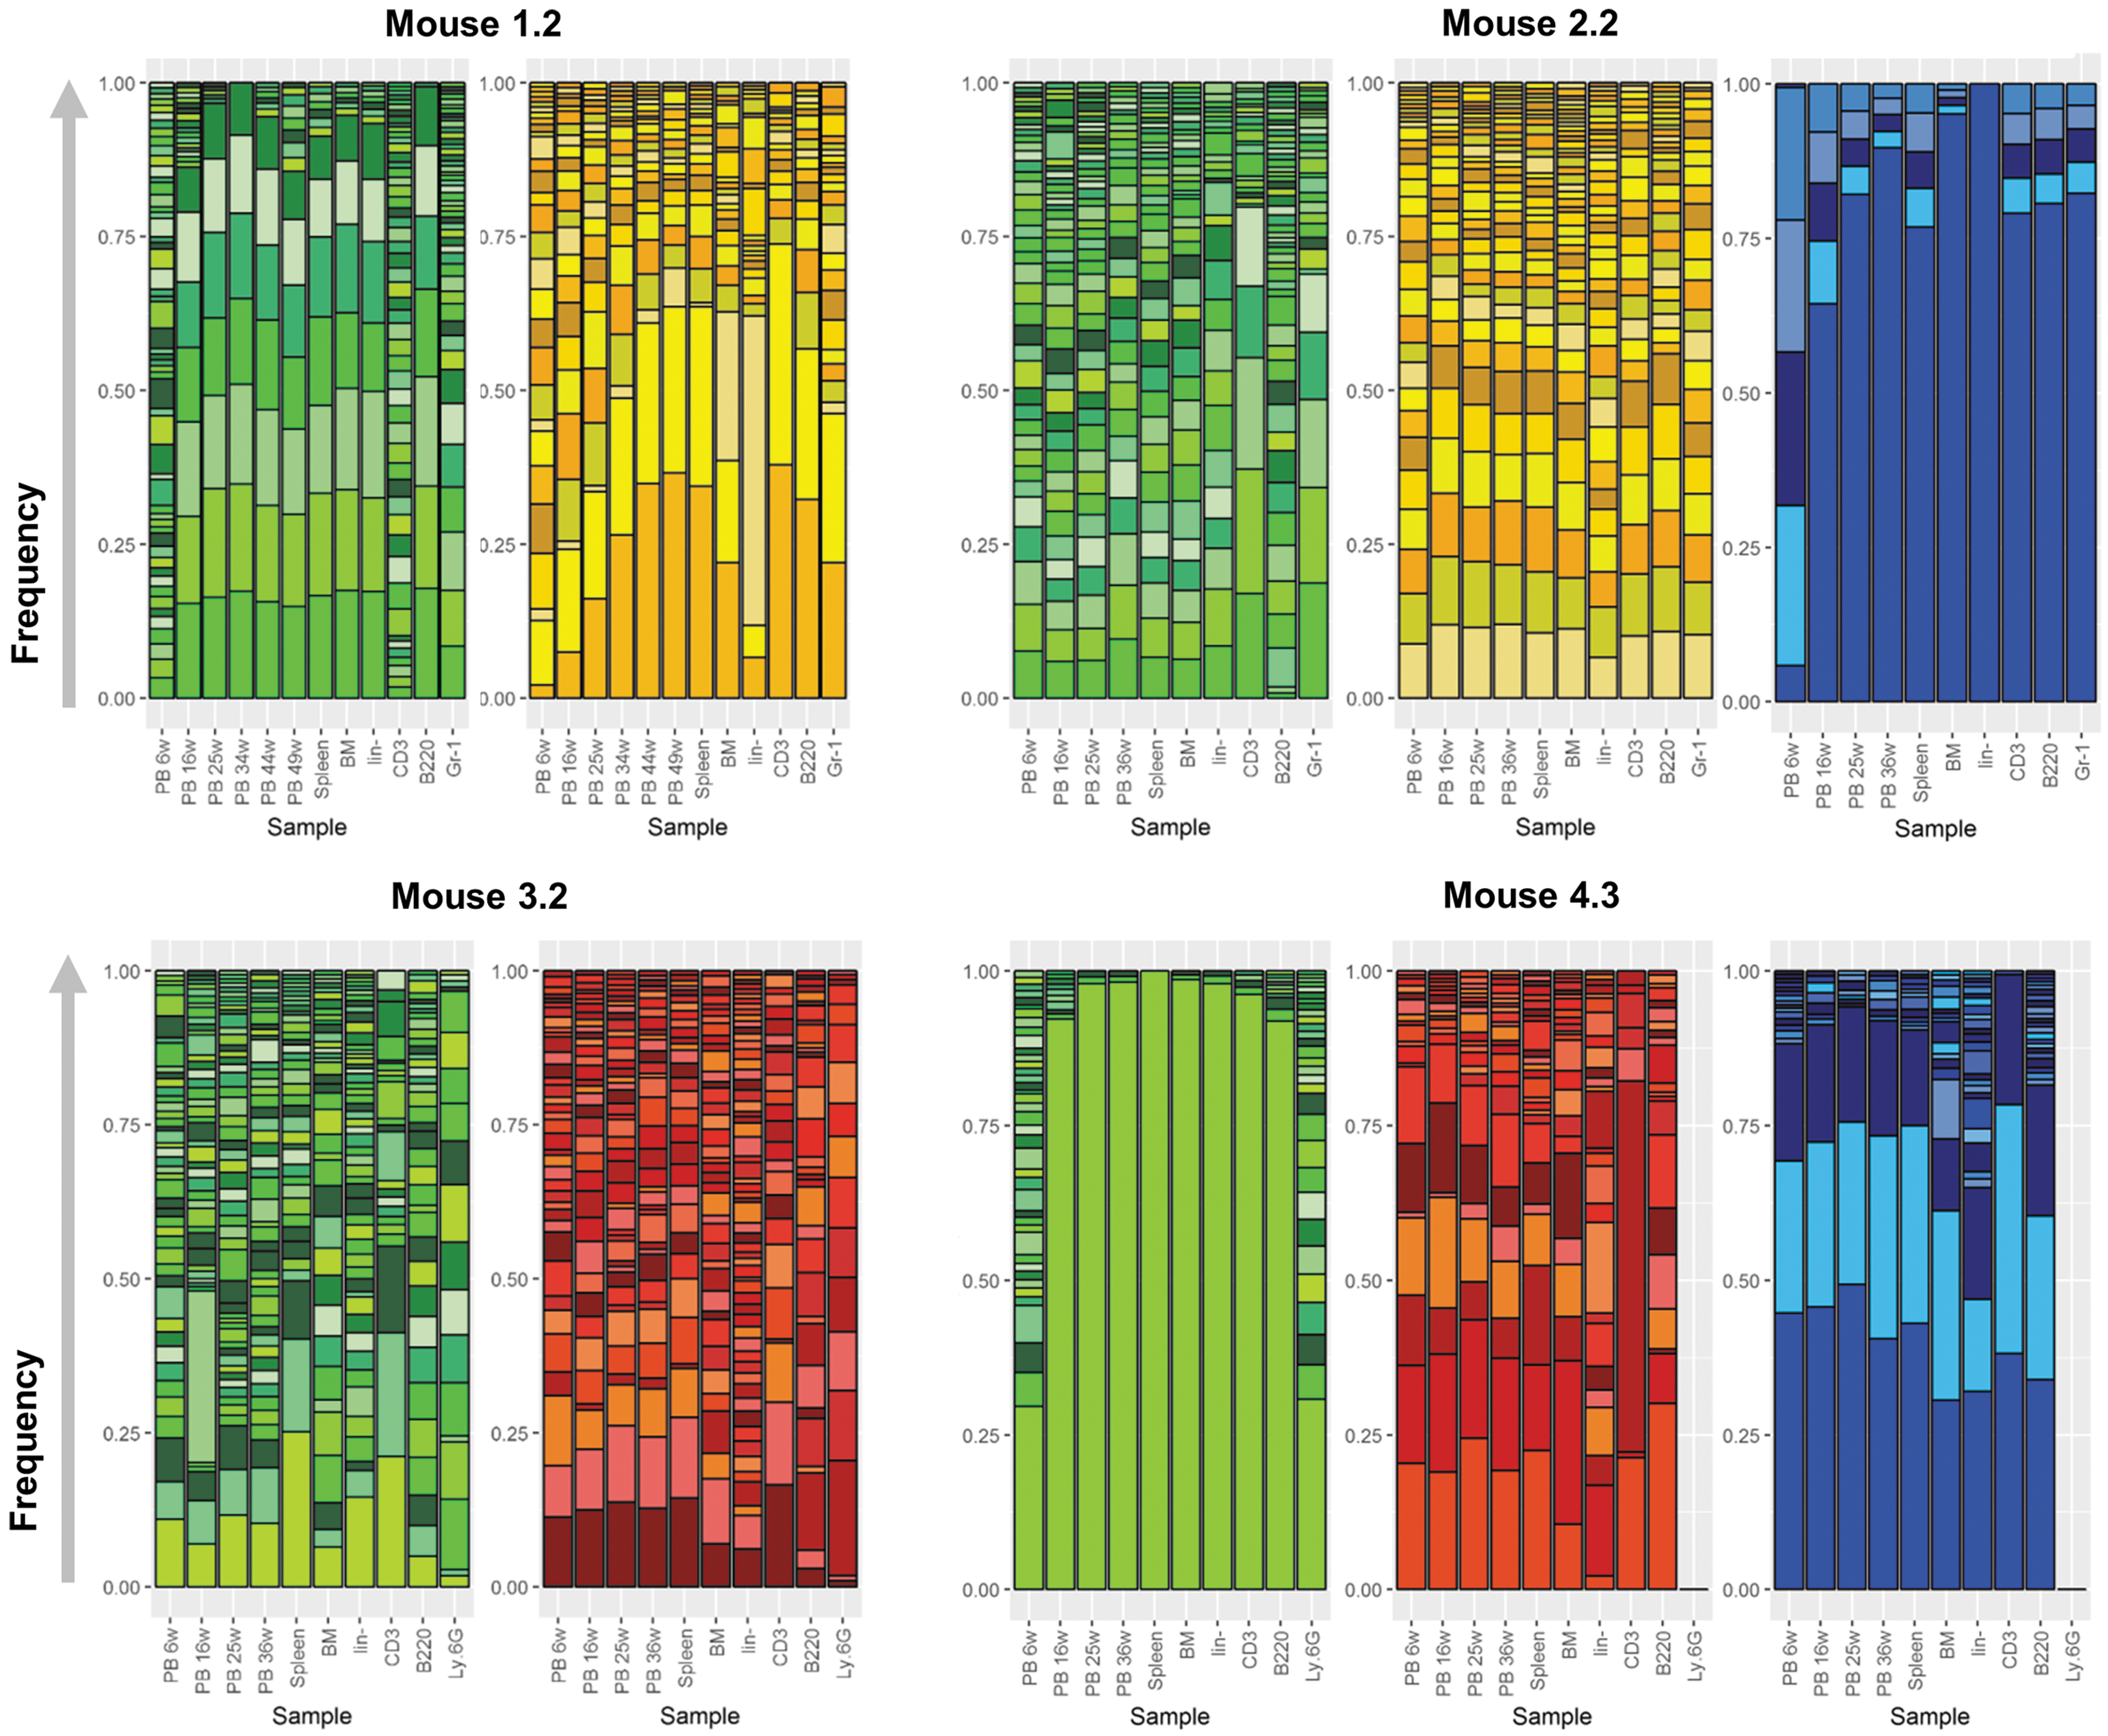
Selected bar plots from one animal per group. Dependent on the group, the samples contain two or three different barcode backbones. The plots represent the combined analyses of all barcode backbones from one animal. All barcodes from one backbone are color coded and stacked upon each other based on the percentage of reads (frequency) an individual barcode is found. The general color scheme defines the vector construct analyzed: green = Lenti-EFS-GFP (top) or Alpha-EFS-GFP (bottom); yellow = Lenti-pd-Venus; red = Alpha-pd-TSapphire; blue = Lenti-SFFV-BFP. Every constant horizontal color represents the same barcode found within multiple samples. Blood samples from different time points (bars on the left) represent the temporal dynamics, while samples from the final analysis (oriented to the right side of the plot) show the spatial distribution at the final time point in BM and spleen. Additional information about barcode content is given from the lineage negative fraction of the BM and sorted T cells, B cells, and granulocytes from spleen. Absent bars indicate samples omitted due to low read counts. PB xw, PB taken after x weeks; BM, bone marrow; lin–, lineage-negative fraction; CD3, T cell subset; B220, B cell subset; Gr-1/Ly.6G, granulocyte subset.
In Fig. 6, the Shannon index 57 was applied to quantify the clonal diversity in the different samples. 53,58,59 A high Shannon index (in this setup >2) describes a polyclonal situation, which was obtained in most of the animals, at least early after transplantation. A lower Shannon index (<1.5) indicates decreasing clonal diversity and the emergence of (pre)dominant clones, accounting for the majority of the marked hematopoietic system. In most of the animals, the diversity initially declined between 6 and 16 weeks, probably due to an exhaustion of clones derived from short-term progenitors. 60 A stabilization of the clonal diversity could be detected after 16 weeks, as shown by the clustering of PB16w+, spleen, and BM samples of most animals in Fig. 6. This is expected, as long-term hematopoiesis should be established after 16 weeks. In the current experimental setup, no promoter and/or vector class–specific differences could be detected. For all vector constructs (exception lentiviral EFS-GFP), around half the animals showed a Shannon index <2, indicating an oligoclonal situation or development of clonal dominance.

Shannon index to describe clonal diversity. Shannon index values were calculated for the PB, BM, and spleen in each animal. A Shannon index >2 corresponds to a polyclonal situation, whereas an index <1.5 indicates emergence of clonal dominance. Index values are displayed for all eight animals receiving the respective vector construct.
Inter-animal variations
Although identical protocols were applied for the isolation of the lineage-negative cells, the stimulation of the cells prior to transduction, and the number of cells to prepare the different grafts, a distinct variability was observed in the level of clonality between animal groups and even within one group of mice transplanted with the same graft. While polyclonal situations were detected in some animals, clonal dominance or even monoclonality was observed for other animals. This holds true for all vector constructs analyzed, regardless of the equipped promoter (Figs. 5 and 6 and Supplementary Figs. S1 and S2). Although it was not possible to determine titer and the transduction efficiency of the pd-constructs by FC, similar titers and achieved similar transduction rates were apparently produced, indicated by similar numbers of recovered barcodes, distribution patterns, and overall clonal dynamics. Possible explanations for the parallel occurrence of different clonal patterns can only be speculated. The most likely explanation for the observed variances between individual animals, even within one group, is an uneven graft composition due to the presence of a variety of different progenitor cells in the lineage-negative fraction in combination with the low number of animals analyzed. Furthermore, only 10–20% of HSCs have been shown to engraft. 61,62 An additional stochastic factor is introduced by transducing only a fraction of cells, aiming for single barcode/vector integration only. The similar behavior for all different vectors indicates, at least in this study, that all of the tested constructs are particularly suited to track reconstitution dynamics after transplantation of lineage-negative cells.
Conclusion
This study showed that the BC32 system can be used to track clonal dynamics of up to three different vector constructs in competitive situations with high resolution. This is possible by individual backbone sequences, which allow sequence-based determination of the underlying vector constructs. The cumulative performance of one parameter, for example the vector construct, can thereby be assessed through backbone-specific analysis, whereas individual clonal dynamics within the subgroups are revealed by the actual barcodes. Other applications could be the comparison of different transgenes delivered by one vector construct or the transduction of different cell populations. The number of parameters analyzed in parallel is, in theory, only limited by the amount of genomic DNA usable for sequencing, NGS sample coverage, and detection limit. The system furthermore enabled all barcode backbones to be amplified with only one PCR step, critically ensuring the best level of quantifiability. Highly complex plasmid libraries and supernatants in combination with large Hamming-distances ensure bioinformatic quality control and clear barcode discrimination. A variety of applications for this system, such as competitive testing of oncogene mutations, cell types, and/or subsets, can be proposed, potentially reducing the number of mice required to answer the respective scientific question.
The use of genetic barcodes offers the possibility of answering biological questions on a clonal level, but it is restricted to a postmortem analysis. To follow clonal dynamics directly (“live”) over time, other methods based on FP expression have to be utilized. The recently published optical barcoding (OBC) or fluorescent genetic barcoding (FGB) methods illustrate this direction. 63,64 Both methods use single or combinations of multiple FPs (and identifying sequences, termed “barcodes” 64 ) to generate distinct populations that can be tracked sequentially. In contrast to genetic barcoding, these methods can only follow a certain, uniquely identifiable, and therefore limited number of colors/clones in an experiment, whereas the BC32 allows up to several hundred thousands of clones to be marked and tracked, independent of FP expression. In addition, optical barcoding 63 requires multiple vector integrations per cell to achieve different color combinations. These approaches are very useful for the exploration of dynamics during tumor development, in which vector copy numbers most likely do not affect cell functionality. However, for primary cells, lower vector copy numbers are beneficial and limit the application of a multiple integration approach. OBC or FGB offer the advantages of a simple utilization and the live analyses by FC, but are limited in the number of traceable clones.
This study assessed the effect on clonal reconstitution dynamics from different retroviral vector constructs, harboring promoters of various strengths. Several analyses showed similar patterns between the analyzed vector constructs, as differences appeared more on the level between individual animals than vector constructs. Mono- to polyclonal situations were detected for all analyzed vector constructs, even within groups receiving the same graft. It could be speculated that the study ended up in a limiting dilution setting due to low transduction rates, related to avoid multiple barcodes per cell, in combination with the heterogeneity of the lineage-negative cell population as well as low HSC engraftment frequencies. Thus, the data indicate that for the given relatively neutral vectors, cell-intrinsic features are more influential in changing clonal reconstitution dynamics than the integrated vector constructs.
In conclusion, this study provides proof-of-principle for the possibility of marking different cell populations with barcodes in parallel and applying them in single animals. This opens the possibility of performing competitive analyses in regeneration settings as well as in the context of cancer growth. Moreover, performance of parallel/competitive analyses can be expected to significantly reduce the number of animals required to assess a specific question, which is in accordance with RRR principles. It is therefore proposed that the multiple-BC system will be highly useful for many applications.
Footnotes
Acknowledgments
First of all, we want to express our gratitude especially to Tanja Sonntag for her tremendous assistance in cell culture and animal work. Furthermore, we thank the UKE FACS Core Facility from the University Medical Center Hamburg-Eppendorf for technical support. We also thank the UKE animal facility, especially Nicole Lüder for her support. Additionally, we want to thank Dr. Andreas Dahl and the Deep Sequencing Group of the BioTec/CRTD at the TU Dresden for conducting the Illumina sequencing. Furthermore, we would like to thank Prof. Dr. Axel Schambach (MH Hannover) for providing the basic alpharetroviral vector and the packaging plasmid, as well as Dr. Kristoffer Riecken (UKE) for the initial LeGO-vector backbones.
This study was supported by the Deutsche Krebshilfe (#110619 to K.C., B.F., I.R., and I.G.) and the Deutsche Forschungsgemeinschaft (DFG; FE568/11-2 to B.F.). This work was also supported by the Dr. Werner Jackstädt-Stiftung granted to K.C. and I.G. The work of L.T. and I.G. was further supported by the German Federal Ministry of Research and Education (Grant number 031A315 “MessAge”). This work is part of the PhD thesis of T.A.
Author Disclosure
No competing financial interests exist.
References
Supplementary Material
Please find the following supplemental material available below.
For Open Access articles published under a Creative Commons License, all supplemental material carries the same license as the article it is associated with.
For non-Open Access articles published, all supplemental material carries a non-exclusive license, and permission requests for re-use of supplemental material or any part of supplemental material shall be sent directly to the copyright owner as specified in the copyright notice associated with the article.