
Abstract
Transposon-based vectors have entered clinical trials as an alternative to viral vectors for genetic engineering of T cells. However, transposon vectors require DNA transfection into T cells, which were found to cause adverse effects. T-cell viability was decreased in a dose-dependent manner, and DNA-transfected T cells showed a delayed response upon T-cell receptor (TCR) stimulation with regard to blast formation, proliferation, and surface expression of CD25 and CD28. Gene expression analysis demonstrated a DNA-dependent induction of a type I interferon response and interferon-β upregulation. By combining Sleeping Beauty transposon minicircle vectors with SB100X transposase-encoding RNA, it was possible to reduce the amount of total DNA required, and stable expression of therapeutic TCRs was achieved in >50% of human T cells without enrichment. The TCR-engineered T cells mediated effective tumor cell killing and cytokine secretion upon antigen-specific stimulation. Additionally, the Sleeping Beauty transposon system was further improved by miRNAs silencing the endogenous TCR chains. These miRNAs increased the surface expression of the transgenic TCR, diminished mispairing with endogenous TCR chains, and enhanced antigen-specific T-cell functionality. This approach facilitates the rapid non-viral generation of highly functional, engineered T cells for immunotherapy.
Introduction
N
Different transposases, including SB, PiggyBac, and Tol2, can mediate stable integration into the genome of various types of mammalian cells, including human T cells. 5 –10 Notably, the hyperactive variant of the SB transposase SB100X has been shown to work at efficiencies comparable to viral gene transfer in some types of primary cells. 11 In these studies, the transposase and the transposon vectors are provided on two separate plasmids and are electroporated into T cells. 12,13 This allows the rapid generation of therapeutic T cells in a cost-efficient and flexible way in comparison to lenti- and γ-retroviral vectors, which require laborious production and extensive testing prior to clinical application. 14 These advantages of transposon vectors are especially relevant envisaging personalized ATT. Here, tumor cell-specific mutations that are unique for each patient are targeted, and time is limited to generate TCR-engineered T cells. 15
Delivery of two plasmids requires the transfection of large amounts of DNA, which in turn negatively affects the viability of T cells. Therefore, efficient transfection of human T cells results in high T-cell mortality after electroporation. 16 This has also been described for the generation of CAR-engineered T cells. 17 Transfection-related cell mortality can be reduced but results in lowered efficiencies (10.5%). 18 To cope with low cell viability and poor gene transfer efficiency, cell lines presenting the antigen recognized by the transferred receptor and additional co-stimulatory signals were used to expand T cells transfected with a transposon vector encoding a CD19-specific CAR. 19 This strategy resulted in rapid outgrowth of gene-engineered T cells, but still only a small fraction of the cells was transfected and subsequently expanded. So far, the underlying molecular mechanisms of the adverse effects of DNA transfection into T cells remain unclear.
In TCR-engineered T cells—unlike in CAR-modified T cells—transgenic TCR chains compete with endogenous TCR chains for cell surface expression and dimerization. Mixed TCR dimers composed of endogenous and transgenic TCR chains reduce the functionality of TCR-engineered T cells and may cause off-target toxicity. 20,21 Previously, it was reported that such off-target toxicity in mice was prevented by using a γ-retroviral vector encoding optimized TCR genes and miRNAs targeting the endogenous TCR sequence by RNA interference. 22 Notably, endogenous TCR silencing changed the surface expression of both therapeutic TCR chains toward equal levels, reflecting the reduced formation of mixed TCR dimers. In other studies, miRNAs specific for human TCR integrated into retroviral vectors resulted in an improved surface expression of the transgenic TCR by silencing of the endogenous TCR. 23,24 However, data showing the reduced formation of mixed TCR dimers on human TCR-engineered T cells are still missing, and the knockdown strategy has not been employed on TCR-engineered T cells generated with transposon-based vectors.
Here, it is reported that transfection of transposon-based vectors elicits a type I interferon (IFN) response in primary human T cells. This effect was not associated with transposition or electroporation itself, but was induced by the transfection of DNA. T-cell survival negatively correlated with the amount of transfected DNA. In contrast to DNA, the transfection of RNA was well tolerated and did not provoke this cellular IFN response. Thus, the aim was to develop a Sleeping Beauty transposon system (SBTS), requiring minimal amounts of DNA. For this, transposon minicircle vectors were used to reduce the size of the DNA vector. These eliminate gene sequences encoding for antibiotic resistance and the origin of bacterial replication. 25 Moreover, minicircle vectors were combined with SB100X-encoding RNA and miRNAs to silence the expression of endogenous TCR. With this approach, reproducibly stable expression of therapeutic TCRs was achieved in >50% of human T cells. The engineered T cells demonstrated superior TCR surface expression and were highly functional. This optimized SBTS allows for fast and efficient generation of TCR-engineered T cells for immunotherapy.
Materials and Methods
Cloning of TCR, transposon plasmids, and minicircle vectors
The Sleeping Beauty pT2/HB transposon plasmid 26 was modified to carry the MPSV promoter of the MP71 retrovirus vector 27 and a chimeric intron and the poly(A) signal of psiCHECK2 (Promega, Mannheim, Germany). The MAGE-A1-specific TCR T136728 (IMGT: TRAV5, TRBV28) and the tyrosinase-specific TCR T5829 (IMGT: TRAV1-2, TRBV13) were codon-optimized (Geneart, Darmstadt, Germany), and the TCRα- and TCRβ-chain were linked via the 2A element of porcine teschovirus (P2A) by polymerase chain reaction (PCR). The TCRs, green fluorescent protein (GFP), or neural growth factor receptor (NGFR) transgenes were then cloned into the modified pT2 vector to obtain pSB-T1367, pSB-T58, pSB-GFP, or pSB-NGFR. The TCR genes were further optimized by introducing two non-native cysteines 30,31 and nine amino acids of the mouse TCR C regions 32,33 into the human TCR C regions to generate T1367opt and T58opt. The human TCR-specific miRNA cassettes were designed as described for mouse TCR. 22 Briefly, the TCRα-specific antisense sequence 5′-TGAAAGTTTAGGTTCGTATCTG-3′ and the TCRβ-specific antisense sequence 5′-TCTGATGGCTCAAACACAGCGA-3′ were integrated into the miRNA environments of miR-155 34 and an artificial miRNA, 35 respectively. The miRNAs were then inserted into the intron of the TCR transposon plasmids to obtain pSB-miR-T1367, pSB-miR-T1367opt, and pSB-miR-T58opt. The miRNA target sites in the C regions of the transgenic TCR carried silent mutations, which were introduced during codon optimization, thereby protecting this TCR from the RNAi effect. For the generation of parental minicircle vectors, the transposon cassette comprising promoter, intron, transgene, polyA signal, and inverted repeats was inserted into the plasmid pMC.BESPX-MCS2 (System Biosciences, Mountain View, CA) via the BamHI restriction site, and a 210 bp spacer was inserted between the minicircle recombination site attB and the left inverted repeat. pmax-GFP was purchased from Lonza (Cologne, Germany), pCpG-free from InvivoGen (Toulouse, France), and pSL1190 from Amersham Pharmacia Biotech (Little Chalfont, United Kingdom).
Generation of plasmid DNA, minicircle DNA, and transposase RNA
Plasmids (pSB-GFP, pSB-T1367, pSB-NGFR, and pSL1190) were produced using EndoFree Plasmid Maxi Kit (Qiagen, Hilden, Germany). Minicircle vectors were produced using the MC-Easy Minicircle DNA Production Kit (System Biosciences) and EndoFree Plasmid Mega Kit (Qiagen) according to the manufacturers' instructions to obtain mSB-GFP, mSB-T1367, mSB-miR-T1367, mSB-T1367opt, mSB-miR-T1367opt, mSB-T58, and mSB-miR-T58opt. Transposase and GFP RNA was prepared from pcDNA3.1 (Thermo Fisher Scientific, Dreieich, Germany) encoding the Sleeping Beauty transposase SB100X 11 or GFP using a mMESSAGE mMACHINE T7 Kit (Thermo Fisher Scientific) according to the manufacturer's instructions. A poly(A)-tail was added using a Poly(A)-tailing Kit (Thermo Fisher Scientific), and RNA was purified on columns with an RNeasy Kit (Qiagen).
Cell lines and media
T2 cells (ATCC CRL-1992), the human melanoma cell lines SK-MEL-37 (MAGE-A1+/HLA-A2+) 36 and SK-MEL-29 (tyrosinase+/HLA-A2+), 36 as well as primary human T cells were cultured in T-cell medium (TCM) composed of RPMI 1640, 10% fetal calf serum (FCS), 1 mM of sodium pyruvate, and 1 × nonessential amino acids. All media were supplemented with 1% penicillin/streptomycin (all Thermo Fisher Scientific).
Isolation and electroporation of T cells
Human T cells were prepared from freshly isolated peripheral blood mononuclear cells (PBMCs; after informed consent from all donors) by centrifugation on Biocoll (Biochrom, Berlin, Germany) and subsequent enrichment using either the EasySep Human T Cell Isolation Kit, EasySep Human CD4+ T Cell Isolation Kit, EasySep Human CD8+ T Cell Isolation Kit, EasySep Human Naïve Pan T Cell Isolation Kit, or the EasySep T Cell Enrichment Kit combined with a CD45RA-depleting antibody for enrichment of memory T cells (all STEMCELL Technologies, Cologne, Germany). In case of TCR transfer, TCR Vβ3+ cells were depleted from the cell fraction by incubation with a PE-labeled anti-TCR Vβ3 antibody (clone Jovi-3; Ancell, Bayport, MN) and subsequent selection with anti-PE beads (STEMCELL Technologies). Depletion reduced the frequency of TCR Vβ3+ CD8 T cells to 0.8% on average. Electroporation was performed with the Amaxa human T-cell Nucleofector Kit (Lonza) according to the manufacturer's instruction. Briefly, 6–10 × 106 cells were suspended in 100 μL of nucleofection buffer containing the indicated amounts of transposon vector DNA and RNA. Program U-14 was applied, and cells were immediately supplied with 2 mL of TCM and cultured overnight. Eighteen hours after electroporation, cells were re-suspended in 2 mL of fresh TCM supplemented with 400 IU/mL recombinant human interleukin (IL)-2 (Proleukin; Novartis, Nuremberg, Germany) and activated by seeding them in 24-well plates coated with anti-CD3 (clone OKT3, 5 μg/mL) and anti-CD28 (clone CD28.2, 1 μg/mL) monoclonal antibodies (mAbs). Cells were then expanded for up to 18 days. The concentration of IL-2 was reduced to 40 IU/mL 3–4 days prior to functional analysis.
Flow cytometry and peptides
T-cell surface stainings were performed in 50 μL of phosphate-buffered saline (PBS) for 30 min at 4°C, with mAbs directed against TCR Vβ3 (Jovi-3), CD3 (HIT3a), CD8 (HIT8α), CD25 (BC96), CD28 (28.2), CD197 (G043H7), CD45RO (UCHL1), CD95 (DX2), and CD271/NGFR (ME20.4). The following mAbs were used to stain the TCR chains of the endogenous repertoire: TCR Vα2 (3A8), Vα7.2 (3C10), Vα12.1 (6D6.6) and TCR Vβ1 (BL37.2), Vβ2 (MPB2D5), Vβ5.1 (IMMU157), Vβ13.6 (JU74.3), Vβ14 (CAS1.1.3), and Vβ22 (IM2051). mAbs were purchased from Biolegend (London, United Kingdom), Thermo Fisher Scientific, Beckman Coulter (Krefeld, Germany), or Ancell. MAGE-A1/HLA-A2 multimer (MBL International, Woburn, MA) staining was performed for 30 min at 4°C. T-cell viability was determined by dead cell staining with SYTOX Blue (Thermo Fisher Scientific) and a FSC/SSC lymphocyte gate. Data were acquired on a FACS CantoII (BD Biosciences, Heidelberg, Germany) or MACS Quant (Miltenyi Biotec, Bergisch Gladbach, Germany) and analyzed with FlowJo software (Tree Star, Ashland, OR). The MAGE-A1278 peptide (KVLEYVIKV) and the tyrosinase369 peptide (YMDGTMSQV) were generated by Biosyntan (Berlin, Germany). For analysis of proliferation by flow cytometry, 6 × 10⁶ isolated T cells were stained for 20 min at 37°C with 6 μM of CellTrace Violet (Thermo Fisher Scientific) before electroporation.
Quantification of transfected pDNA
CD3-sorted human T cells were transfected and incubated overnight. To remove any DNA attached to the cell surface, transfected T cells and control samples were thoroughly washed and incubated with DNAse I (200 KU/sample; Sigma–Aldrich Chemie, Munich, Germany) in PBS with 5 mM of MgCl2 for 30 min at 37°C. Afterwards, pSB-NGFR-transfected T cells were magnetically sorted before DNA isolation using PE-labeled anti-human NGFR mAb (Biolegend) and anti-PE beads (STEMCELL Technologies). DNA was isolated using the Invisorb Spin Tissue Mini Kit (Stratec Biomedical, Birkenfeld, Germany) with RNAse incubation. For absolute quantification, standards were generated by diluting the pSB-NGFR plasmid in genomic (g)DNA ranging from 300 to 3 × 10⁷ plasmids. The following pSB-NGFR-specific primers were used for a real-time PCR assay (PowerUp SYBR Green Master Mix; Thermo Fisher Scientific): 5′-GGGTCTTTCATTTGTCCGGAG-3′ and 5′-AATTACGCGTTCTGTCTCGA-3′. PCR was performed using 20 ng of DNA as template on a Quant Studio 3 instrument (Thermo Fisher Scientific).
Detection of gene expression by PCR and real-time PCR
Total RNA was isolated from transfected and non-transfected T cells using the RNeasy Mini Kit including a DNase digestion step (Qiagen). pSB-NGFR-transfected T cells were magnetically sorted before RNA isolation using PE-labeled anti-human NGFR mAb (Biolegend) and anti-PE beads (STEMCELL Technologies). Complementary DNA (cDNA) was synthesized using 100–400 ng of total RNA as template and a SuperScript II reverse transcriptase kit (Thermo Fisher Scientific) following the manufacturer's protocol. PCR reactions were performed with gene-specific primers for MB21D1 (5′-CGGGAGCTACTATGAGCACG-3′ and 5′-TAGCCGCCATGTTTCTTCTTG-3′), ZBP1 (5′-AGAATCCTGCAGGTGCTGAC-3′ and 5′-GAATCTTCTGGGCGGTAAATCG-3′), IFI16 (5′-CGGTTCCGTTTCTGGGAACT-3′ and 5′-CCACTGTTTTCGGGTTCTGAG-3′), IFIT1 (5′-TGCCTAATTTACAGCAACCATGAG-3′ and 5′-CATCCAGGCGATAGGCAGAG-3′), EIF2AK2 (5′-AAGCAAAACAATTGGCCGCT-3′ and 5′-CGCTCCGCCTTCTCGTTATT-3′) and B2M (5′-TTTCTGGCCTGGAGGCTATC-3′ and 5′-CTGCTTACATGTCTCGATCCCA-3′) using a cDNA equivalent of 20 ng of total RNA and run for 25 cycles. Images were black/white inverted and adjusted for brightness and contrast for each individual gene using Photoshop software (Adobe, San Jose, CA). Quantitative PCR was performed in triplicate with a cDNA equivalent of 5–10 ng of RNA/well using TaqMan Universal Mastermix II on a 7300 real-time PCR System from Applied Biosystems (Thermo Fisher Scientific) for 40 cycles. The following TaqMan gene expression assays (Thermo Fisher Scientific) were used: IFNA1 (Hs00855471_g1), IFNB1 (Hs01077958_s1), OAS1 (Hs00973637_m1), IFIT1 (Hs03027069_s1), EIF2AK2 (Hs00169345_m1), MB21D1 (Hs00403553_m1), ZBP1 (Hs00229199_m1), IFI16 (Hs00194261_m1), TRAC (04421400_mH), TRBC1 (Hs01588269_g1), B2M (Hs99999907_m1), IPO8 (Hs00183533_m1), and ACTB (Hs01060665_g1). Ct values were determined using Sequence Detection Software and normalized to B2M (non-activated samples) or IPO8 (activated samples) and ACTB (endogenous TCR chains). Relative gene expression was calculated using comparative Ct method.
Determination of transgene copy number by droplet digital PCR
g DNA (200 ng) isolated from 3 × 10⁶ cells 14 days after electroporation was digested overnight with 20 IU of DpnI (New England Biolabs, Frankfurt am Main, Germany) in a final reaction volume of 30 μL at 37°C. As only dam methyltransferase-modified DNA can serve as a substrate for DpnI, this step aimed at eliminating unintegrated transposon plasmid DNA, which could have served as template for the subsequent PCR step. Next, gDNA samples were fragmented for 4 h at 25°C using CviQI (New England Biolabs). To obtain transposon copy numbers per genome, the digested gDNA was subjected to PCR amplifications using TaqMan probes, specific for either the right inverted repeat of the transposon or the backbone region of the corresponding plasmid or minicircle donor DNA. Both PCRs were performed in the presence of a TaqMan probe set specific for the single-copy RPP30 gene to measure genome copy number. All of the amplicon templates contained at least one DpnI recognition site and lacked CviQI restriction sites. The PCR reactions were performed in 20 μL final volume with 10 ng of gDNA using the ddPCR Supermix for Probes (No dUTP) master mix (Bio-Rad Laboratories, Munich, Germany) with 11 pmol primers and 5 pmol of TaqMan probes. PCR reactions were performed with the following primers: right inverted repeat (5′-GAATGTGATGAAAGAAATAAA-3′ and 5′-AGTTTACATACACCTTAGCC-3′, FAM-TGGTGATCCTAACTGACCTAAGACAGG-BH1), minicircle backbone (5′-ACTTCGTGCCAGAGTCTT-3′ and 5′-TTAATGACTCCAACTTAAGTG-3′, FAM-GCT TCGAATTTAAATCGGATCCCTATA-BH1), plasmid backbone (5′-AAGAGTTGGTAGCTCTTGAT-3′ and 5′-GATCTAGGTGAAGATCCTTT-3′, FAM-TGATCTTTTCTACGGGGTCTGACG-BH1) RPP30 (5′-CTGTCTCCACAAGTCCGC-3′ and 5′-GGTTAACTACAGCTCCCAGC-3′, HEX-TGGACCTGC GAGCGGGTTCTGACC-BH1). The PCR droplets were generated using a QX100 device (Bio-Rad). The program for the subsequent PCR was: 95°C for 10 min; 40 cycles of 94°C for 30 s, 50°C for 30 s, and 60°C for 1 min; and 98°C 10 min. After thermal cycling, the fluorescent droplets were counted in the QX100 Droplet Reader and genomic copy numbers were calculated with the Quanta Soft program (both Bio-Rad).
Cytokine and chromium release assays
For detection of secreted cytokines, TCR-engineered T cells were seeded in 96-well round-bottom plates (104/well) together with either peptide-loaded T2 cells or tumor cell lines in an E:T ratio of 1:1. Supernatants were harvested after 24 h and either analyzed by enzyme-linked immunosorbent assay or cytometric bead array (both BD Biosciences). Specific lysis assays were performed by labeling target cells with 100 μCi 51 Cr (1Ci = 37 GBq; Amersham) in FCS for 1 h. Labeled target cells were then incubated for 4 h with effector cells in E:T ratios from 32:1 to 1:1 using 103 target cells per well in 96-well round-bottom plates.
Analysis of supernatants of transfected T cells
CD3-sorted human T cells were prepared and transfected as described above. After 24 h, the supernatants were harvested, filtrated (0.45 μm pore size), and used directly on freshly isolated T cells. CD3-sorted T cells (1 × 10⁶) were incubated with 1 mL of supernatant for 24 h. Then, the T cells were re-suspended in 1 mL of fresh TCM supplemented with IL-2 (400 IU/mL; Novartis) and transferred into 24-well plates coated with anti-CD3 (5 μg/mL) and anti-CD28 (1 μg/mL) mAbs. After 24 h, the T cells were analyzed for the expression of activation markers by flow cytometry. To detect secreted IFN-β protein, supernatants of DNA-transfected T cells were harvested at multiple time points after electroporation, filtrated (0.45 μm pore size), and stored at −80°C. A bead-based immunoassay was used to analyze the supernatants according to the manufacturer's instructions (LEGENDplex; Biolegend).
Statistical analyses
Data were analyzed using GraphPad Prism (GraphPad, La Jolla, CA). Statistical tests were used as specified in the figure legends, with *p < 0.05, **p < 0.01, and ***p < 0.001.
Results
Transfection of DNA into human T cells results in decreased cell viability and a delayed response to CD3/CD28 stimulation
The most critical events in the generation of SB-engineered T cells unfold within the first days after transfection of DNA by electroporation. To analyze the effect of DNA electroporation on primary human T cells, a GFP-encoding SB transposon plasmid (pSB-GFP) was generated, and peripheral blood-derived, CD3-enriched T cells were transfected with different amounts of pSB-GFP DNA or GFP-encoding RNA. To determine the toxic effect of transfected DNA, IL-2 was added 18 h after electroporation, and T-cell viability was analyzed 1 h after transfection and then every 24 h for 7 days by dead cell staining and flow cytometry (Fig. 1A). The first measurement 1 h after electroporation revealed an immediate decrease of T-cell viability by 25% in all DNA-transfected samples. This initial cell death was caused by the electroporation and did not correlate with the amount of transfected nucleic acids. Over the following days, a second form of cell death with a slower kinetic was observed. T-cell viability was significantly decreased in a DNA dose-dependent manner by transfection of pSB-GFP. RNA-transfected T cells and T cells electroporated without DNA or RNA (TF w/o) showed the best survival (Fig. 1A). On the other hand, the amount of transfected DNA correlated with the level of GFP expression. Transfection of 10 μg and 20 μg of pSB-GFP produced >50% GFP-expressing T cells (Fig. 1B), but these cells died within 1 week. The highest transfection rate was achieved with 20 μg of pSB-GFP, but GFP expression decreased over time, indicating that the high DNA load induced T-cell mortality. An analysis of T-cell viability and GFP expression 4 days after transfection showed a negative correlation of T-cell viability to the amount of DNA used for electroporation, whereas the transfection rate correlated positively to the amount of DNA (Fig. 1C). A transfection control, in which T cells were exposed to different amounts of DNA without electroporation, showed no effect on viability (Supplementary Fig. S1A; Supplementary Data are available at
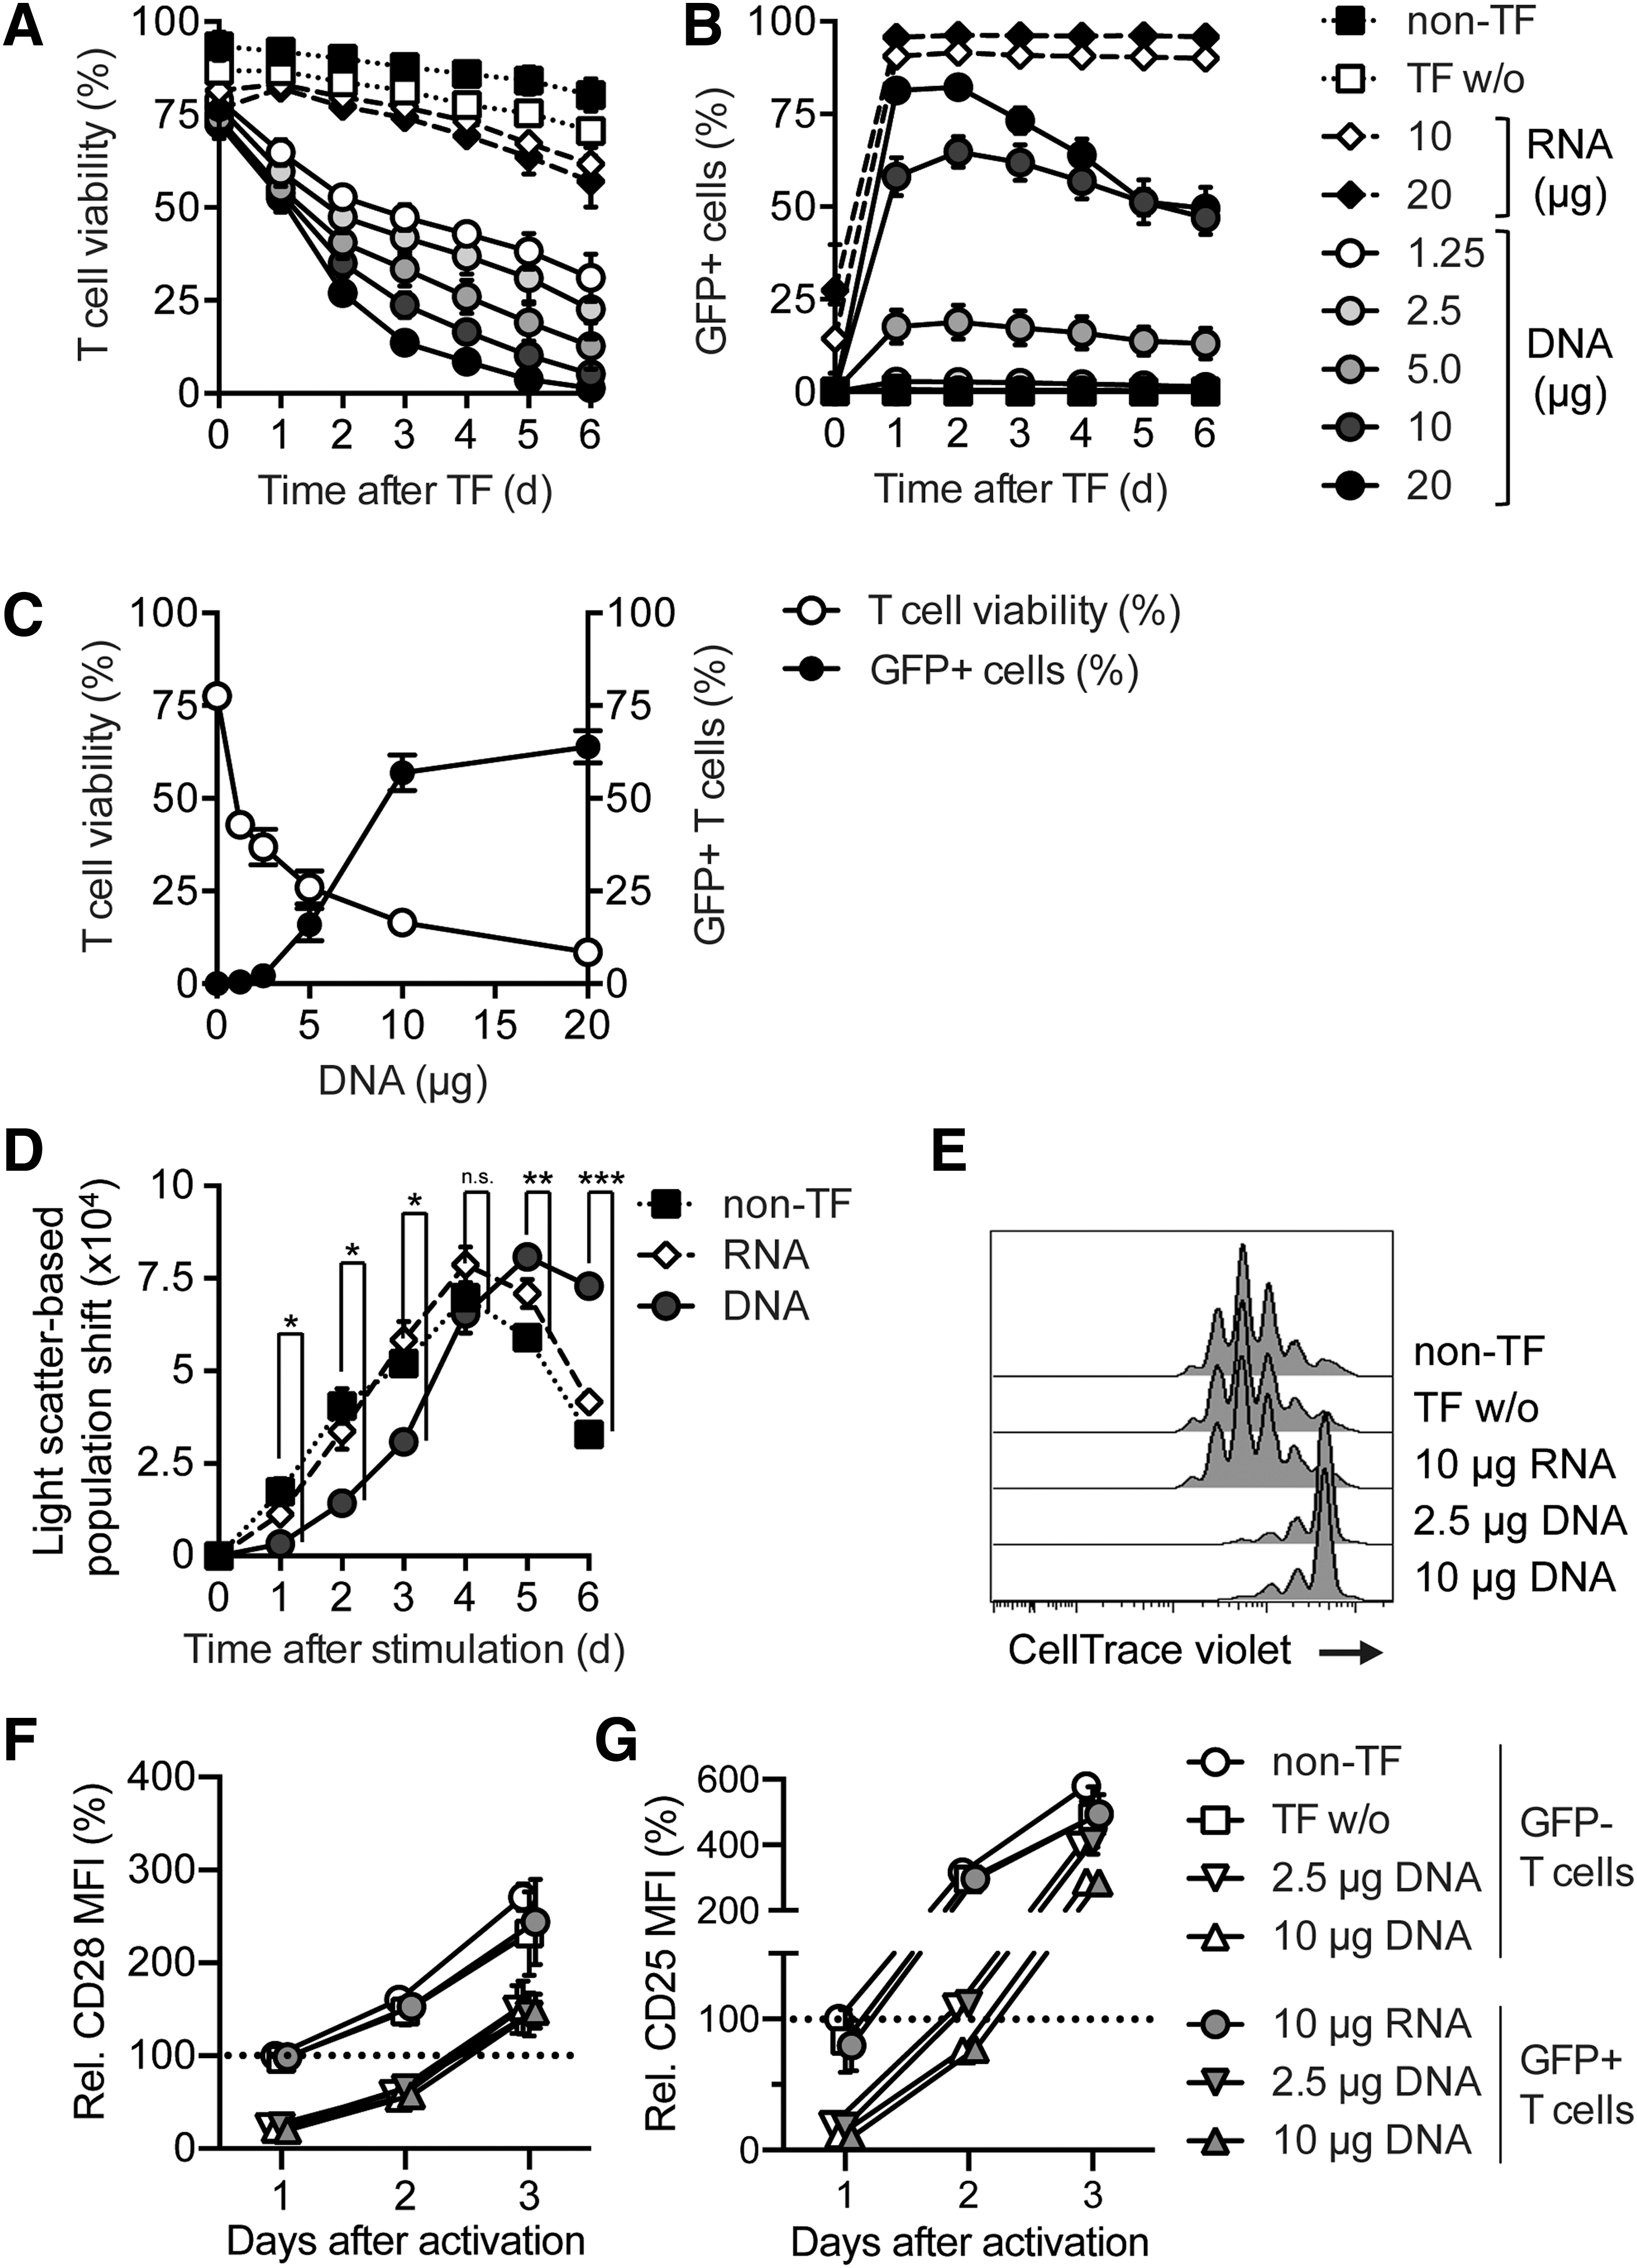
Transfection of DNA into human T cells results in decreased cell viability and delayed response to CD3/CD28 stimulation. T cells were transfected with the indicated amounts of pSB-GFP or GFP RNA by electroporation and either cultured with interleukin (IL)-2 alone
For long-term culture and expansion of engineered T cells, the cells were stimulated 18 h after electroporation with anti-CD3/CD28 mAbs and IL-2. DNA-transfected T cells showed a significant delay in blast formation by 1–2 days compared to non-transfected and RNA-transfected T cells (Fig. 1D). To analyze T-cell proliferation, T cells were labeled with CellTrace Violet before electroporation and analyzed by flow cytometry after stimulation. DNA-transfected T cells showed a delayed proliferation (Fig. 1E and Supplementary Fig. S1B). However, after this delay, the DNA-transfected T cells proliferated well (Supplementary Fig. S1C). Flow cytometric analysis of DNA-transfected T cells after stimulation showed that these cells upregulate CD25, a component of the high-affinity IL-2 receptor, and the co-stimulatory receptor CD28 with a delay of 1–1.5 days compared to controls (Fig. 1F and G and Supplementary Fig. S1D). Importantly, both phenotype and transient inhibition of T-cell activation were not confined to the GFP-expressing T cells. Moreover, conditioned medium of transfected T cells did not mediate this suppressive effect (Supplementary Fig. S1E and F), indicating a general effect on all DNA-transfected T cells, irrespective of transgenic protein expression. These data demonstrate that the transfection of DNA into human T cells by electroporation reduces cell viability in a DNA dose-dependent manner and results in a delayed response to CD3/CD28 stimulation.
Transfected DNA elicits a type I IFN response in human T cells accompanied by IFN-β upregulation
To elucidate the molecular mechanisms underlying the immunosuppressed state and the low viability of DNA-transfected T cells, the expression of genes involved in the innate intracellular antiviral response and in DNA detection was studied. In a time-course experiment, upregulation of the DNA sensors Z-DNA binding protein 1 (ZBP1), IFN-γ inducible protein 16 (IFI16) and Mab-21 domain containing protein 1 (MB21D1) was detected in the electroporated T cells (Fig. 2A). Quantitative PCR performed 12 h after transfection confirmed the above findings (Fig. 2B). Upon detection of the transfected DNA, intracellular DNA sensors, including ZBP1, IFI16, and MB21D1, are expected to activate the type I IFN pathway. 37 –39 Indeed, IFN-induced protein with tetratricopeptide repeats 1 (IFIT1) and eukaryotic translation initiation factor 2-α kinase 2 (EIF2AK2)—a canonical executor of the antiviral response—were both upregulated at 2 and 8 h after transfection of DNA (Fig. 2A). To test whether Toll-like receptor (TLR) 4 or TLR 9, which recognize unmethylated CpG motifs, were responsible for the IFN response, a plasmid preparation devoid of TLR 9 and TLR 4 ligands (pCpG-free) was transfected. Notably, transfection of CpG-free DNA still induced an IFN response accompanied by IFN-β upregulation, arguing for direct recognition of DNA, and not TLR ligands, as trigger (Fig. 2C). However, IFN-β transcription did not result in detectable amounts of IFN-β protein in the supernatant of DNA-transfected T cells (Supplementary Fig. S2A). Furthermore, CD3/CD28 stimulation did not mitigate the antiviral response in T cells, as IFN-β expression and an IFN gene signature consisting of 2′-5′-oligoadenylate synthetase 1 (OAS1), IFIT1, and EIF2AK2 was still detected in DNA-transfected T cells 24 h after stimulation (Fig. 2D). Experiments using purified CD3/CD4, CD3/CD8, CD3/CD45RA, and CD3/CD45RO T cells demonstrated that these genes are upregulated in each subset after DNA transfection (Supplementary Fig. S2B–E). Analysis of transgenic protein-positive and -negative T cells 18 h after transfection demonstrated that the IFN response occurred in both populations, irrespective of transgenic protein expression (Fig. 2E). Concurrent with this, transfected DNA was detected in both cell populations by real-time PCR (Supplementary Fig. S1G). Most importantly, the expression levels of the IFN signature genes correlated to the amount of transfected DNA and were significantly higher when 5 μg was applied compared to 2.5 μg (Fig. 2F). These data reveal that the transfection of DNA induces a dose-dependent IFN response in human T cells.

Transfected DNA elicits a type I interferon (IFN) response in human T cells and results in IFN-β upregulation.
Transposon minicircles provide superior gene transfer to CD3, CD4, CD8, memory, and naïve T cells
To achieve engineering of human T cells with sufficient viability and transfection efficiency for ATT, both components of the SBTS were modified. First, the transposase was delivered as in vitro transcribed RNA (SB100X RNA) instead of DNA. Second, a GFP-encoding SB transposon minicircle vector (mSB-GFP) was employed, which is half the size of the plasmid pSB-GFP (2.5 vs. 5 kb). Both vectors encode the same transposon cassette, but the minicircle vector mSB-GFP lacks bacterial sequences such as the antibiotic resistance genes and the origin of replication. These undesired sequences embody a large fraction of the plasmid and are known to silence the expression of the transgene. 40 The smaller size of mSB-GFP allows the usage of a higher molarity at the same mass compared to pSB-GFP. CD3, CD4, CD8, memory (CD45RO), and naïve T cells (CD45RA) were isolated, and they were electroporated with SB100X RNA and 2.5 μg of either pSB-GFP or mSB-GFP and stimulated 18 h after electroporation. Non-transfected T cells (non-TF) and T cells electroporated with a non-transposon GFP expression vector (pmax-GFP) served as controls. One day after electroporation, T-cell viability was reduced to 60% and further declined to about 40% on day 4. However, by day 8, it was able to recover to 75% (Fig. 3A). T cells transfected with pmax-GFP showed a transient expression in approximately 30% of the cells that disappeared within 1 week, while transfection with the SBTS resulted in stable GFP expression (Fig. 3B). The transfection rate using transposon minicircles was threefold higher compared to conventional transposon plasmids (45% vs. 15%) in CD3 T cells. In addition, the level of GFP expression was twofold higher in mSB-GFP-transfected compared to pSB-GFP-transfected T cells (Fig. 3C). Naïve T cells (CD45RA) demonstrated the highest viability after electroporation (87%), although T-cell recovery after day 4 was slowed in all T-cell subsets (Fig. 3D, G, J, and M). The improved transfection efficiency of transposon minicircles was observed in all analyzed T cell subsets. However, transposon minicircle-transfected CD8 and CD45RA T cells showed the highest transfection rates of about 65% (Fig. 3E, H, K, and N). All subsets demonstrated increased transgenic protein expression for the transposon minicircles compared to conventional transposon plasmids (Fig. 3F, I, L, and O). These data demonstrate the superior transfection efficiency of transposon minicircles compared to conventional transposon plasmids.
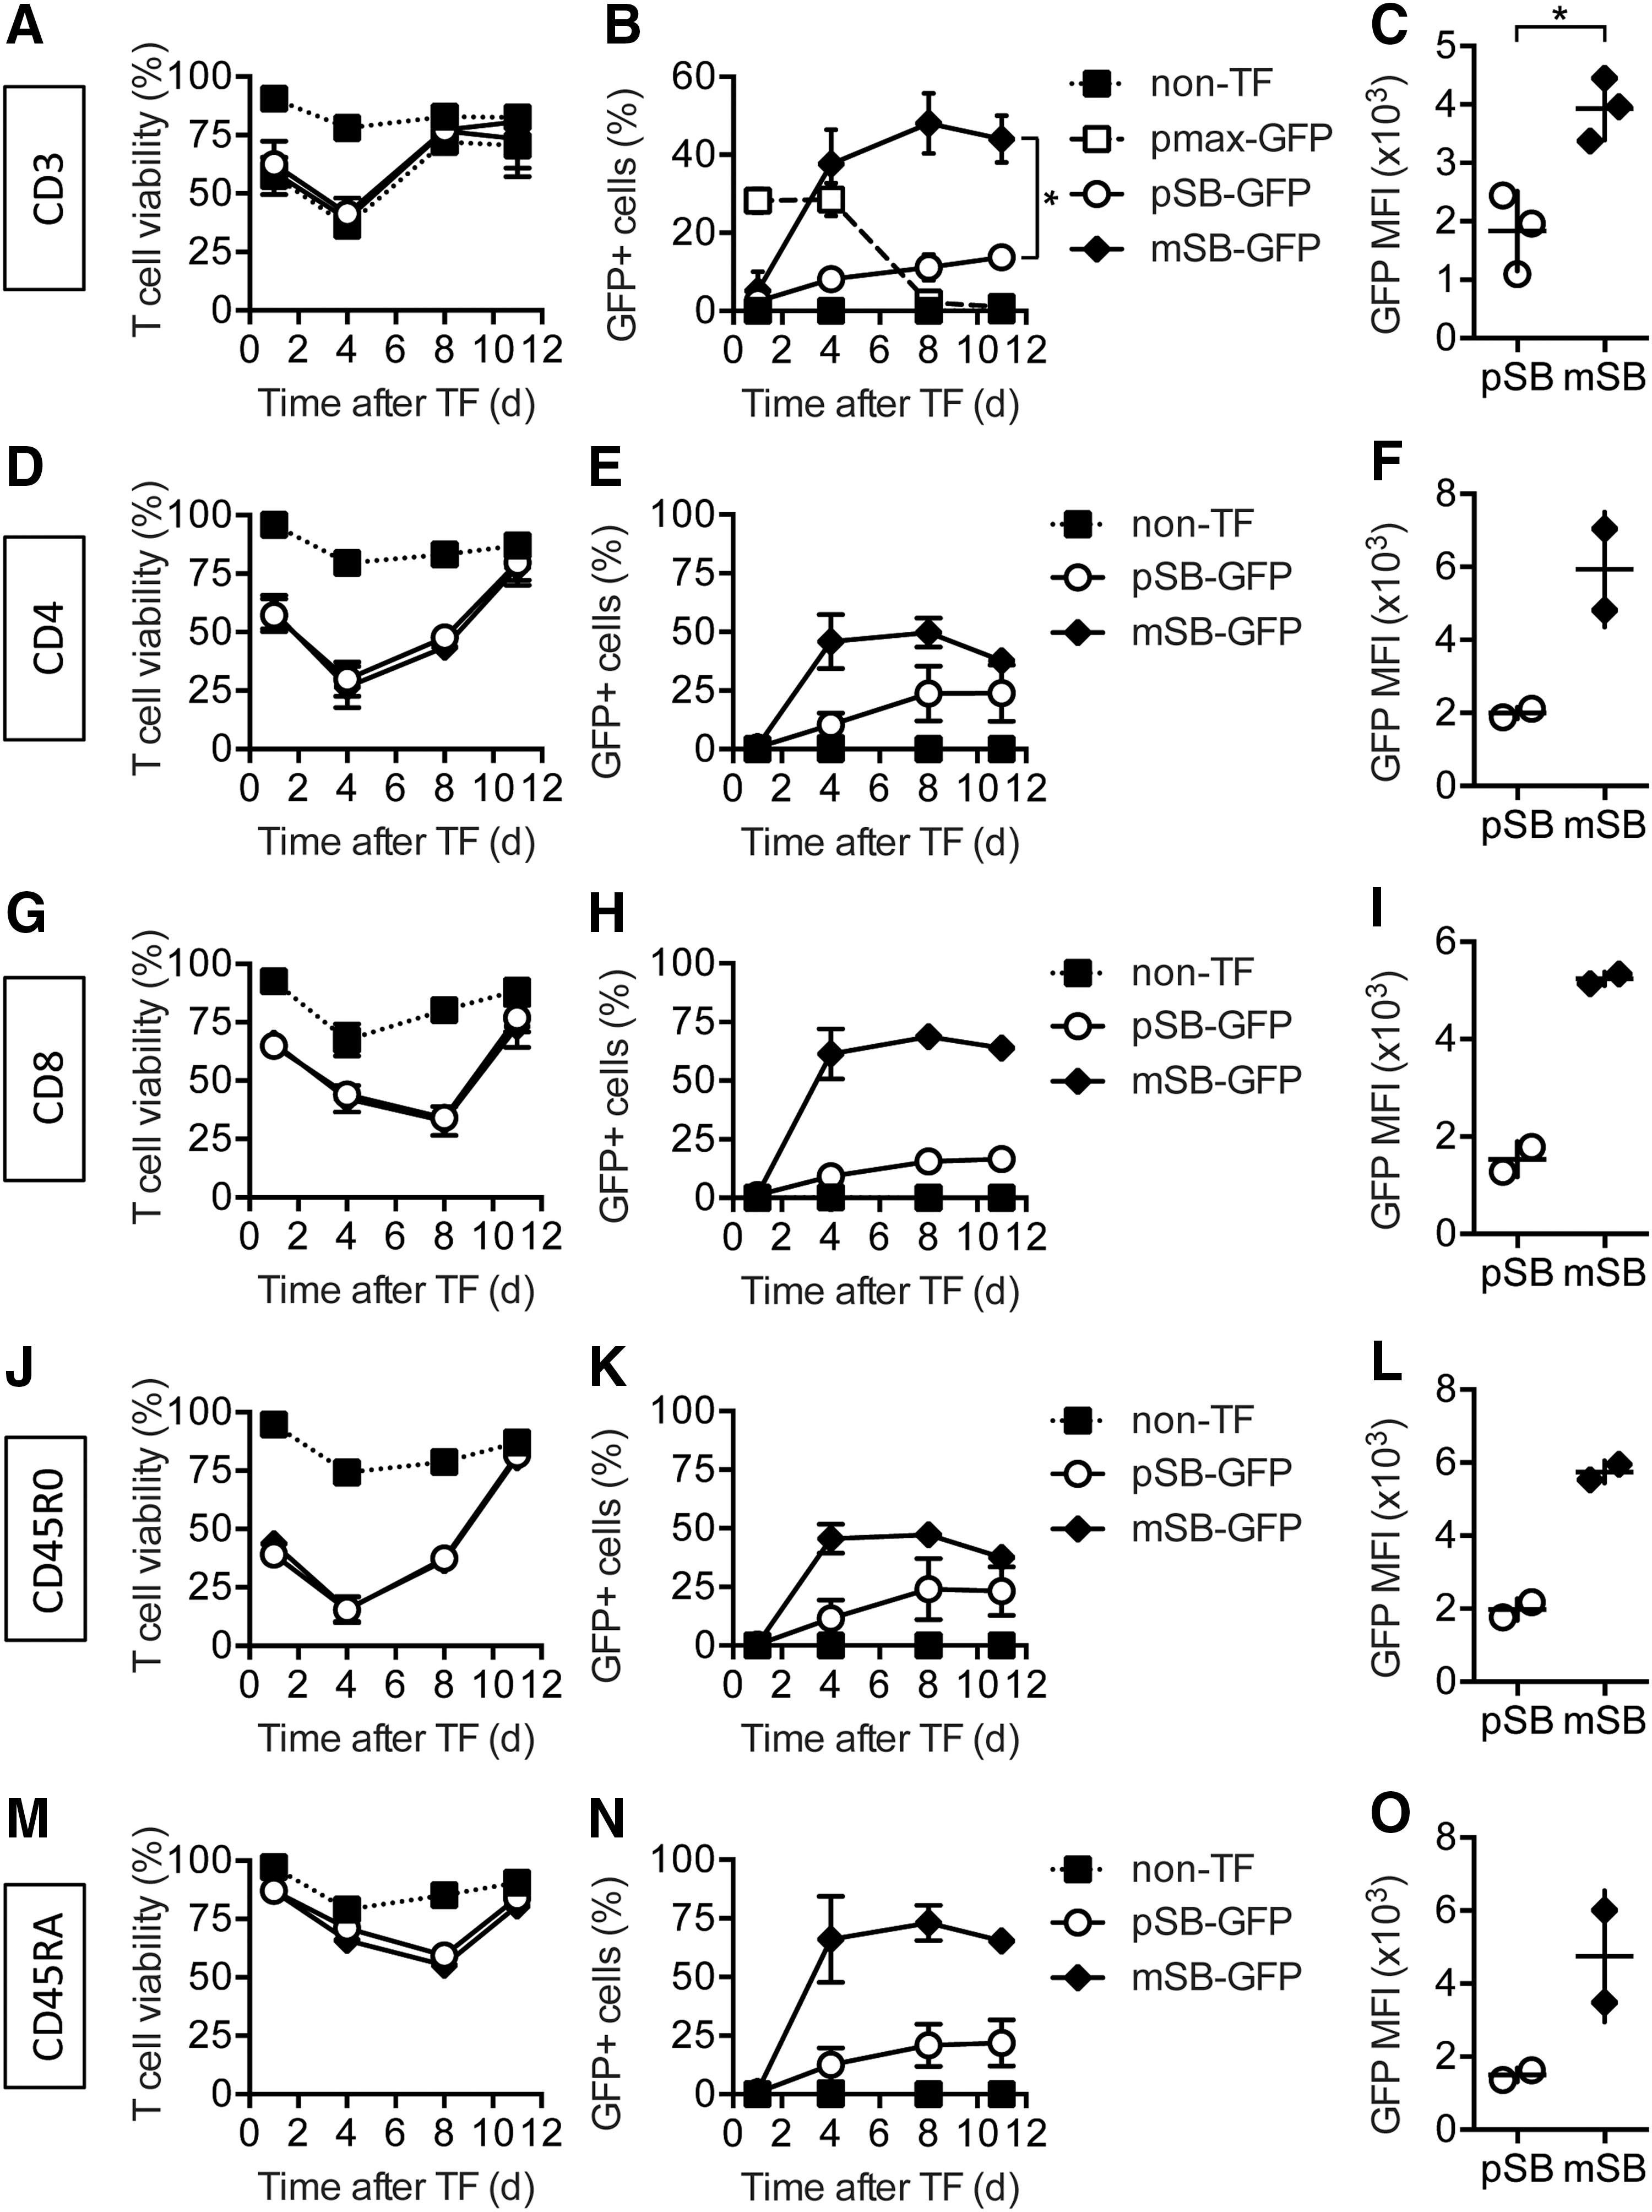
Transposon minicircles provide significantly higher transfection rates than transposon plasmids at similar T cell viability in all analyzed T-cell subsets.
Transposon minicircles significantly improve TCR gene transfer at equal DNA amounts and at equimolar vector amounts
GFP was replaced by a MAGE-A1-specific TCR (TCR T1367), 28 and the plasmid pSB-T1367 and the minicircle mSB-T1367 were generated. T-cell viability of TCR-engineered T cells followed the same course as described in the GFP experiments (Fig. 4A). While both vectors reproducibly ensured the generation of TCR-engineered T cells (analysis of eight different donors), only the transposon minicircle vector mSB-T1367 mediated TCR gene transfer in >50% of the cells, as determined by staining with a TCR Vβ3-specific antibody (mSB-T1367 54% vs. pSB-T1367 19%; Fig. 4B). Major histocompatibility complex (MHC) multimer staining of transfected T cells revealed 30% positive cells for mSB-T1367 compared to 11% for pSB-T1367 (Fig. 4C). Also, when equimolar amounts of transposon minicircles and plasmids were used, the minicircles showed superior transfection efficiency measured by TCR Vβ3-chain (51% vs. 11%) and multimer staining (17% vs. 25%; Fig. 4D–F). Moreover, the use of equimolar amounts of both vectors resulted in a reduced IFN response for the minicircle vector (Supplementary Fig. S3), confirming the previously seen correlation between the total amount of DNA and the IFN response. After electroporation, the transfected T cells were stimulated with anti-CD3/CD28 mAbs and IL-2 and expanded to 7 × 10⁷ T cells within 18 days (Fig. 4G). Determination of the copy number of transposon integrants revealed that T cells transfected with transposon minicircles had more integrants per cell (7.0) than T cells transfected with the same total amount of DNA (4.1) and T cells transfected with transposon plasmids in equimolar amounts (5.4; Supplementary Fig. S4). The TCR-engineered T cells (CD8+/TCR Vβ3+) generated with this protocol expressed a combination of surface markers that is characteristic for central memory T cells (TCM: CD45RO+/CD197+/CD95+) as shown by flow cytometric analysis on day 15 after electroporation (Fig. 4H and I). The same result was seen in T cells transfected with an irrelevant plasmid devoid of promoter sequences and transgenes (Supplementary Fig. S5). These data demonstrate that TCR-engineered human T cells can be efficiently generated without enrichment of the transfected cells in a robust and reproducible manner by combining transposon minicircle vectors with transposase SB100X RNA.

Transposon minicircles provide superior T-cell receptor (TCR) gene transfection.
miRNAs silencing the expression of endogenous TCR chains enhance the expression level of the therapeutic TCR
The expression of the therapeutic TCR on TCR-engineered T cells critically depends on the pairing behavior of the TCR chains and their ability to compete with endogenous TCR chains for the recruitment of proteins of the CD3 complex. 41 –43 To enhance the expression of the therapeutic TCR, miRNAs were developed, which silence the expression of the human TCRα- and TCRβ-chains analogously to the described miRNAs used for the downregulation of endogenous mouse TCR. 22 Four different transposon minicircle vectors were generated, and the TCR surface expression was analyzed on engineered T cells: the basic vector carried the human MAGE-A1-specific TCR T1367 and the MPSV promoter 27 (mSB-T1367). In the second vector, mSB-T1367 was modified to harbor additionally two miRNAs silencing the endogenous TCRα- and TCRβ-chain expression in an intron located between the promoter and the TCR (mSB-miR-T1367). In the third vector, the expression cassette of TCR T1367 was optimized by the introduction of two non-native cysteines 30,31 and nine amino acids of mouse TCR C regions 32,33 to support the preferential pairing of transgenic TCR chains (mSB-T1367opt). In the fourth vector, the miRNAs were combined with the optimized TCR expression cassette (mSB-miR-T1367opt; Fig. 5A). All four transposon minicircle variants enabled efficient TCR gene transfer into human T cells (approximately 51% of CD8+ T cells), as measured by staining of the Vβ3 chain of TCR T1367 (Fig. 5B). Of note, T cells harboring endogenous TCR Vβ3 chains were depleted before transfection. The incorporation of the miRNAs resulted in more correctly paired therapeutic TCR on the cell surface compared to the basic vector mSB-T1367, as demonstrated by MHC multimer binding. This effect could also be seen for the vector harboring the optimized TCR cassette (mSB-T1367opt) and the vector combining both optimization and miRNAs (mSB-miR-T1367opt). Only half of the TCR Vβ3+ T cells were able to bind the MHC multimer if the basic vector was used, whereas approximately 75% bound the MHC multimer if one of the three modified vectors was applied (Fig. 5C). Importantly, silencing of the endogenous TCR expression increased the surface expression of correctly paired TCR T1367 chains on engineered T cells in both vector variants that contained the miRNAs (mSB-miR-T1367, mSB-miR-T1367opt). Incorporation of the miRNAs and employing additional TCR optimizations resulted in a 2.1- and 2.0-fold increase of the MHC multimer mean fluorescence intensity (MFI), respectively. The combination of both strategies resulted in a 2.6-fold increase (Fig. 5D). To determine the knockdown efficiency of the endogenous TCR by applying miRNAs, T cells transfected with the vector mSB-miR-T1367 were analyzed for the expression of endogenous TCR chains, and they were compared to T cells transfected with the basic vector mSB-T1367 without miRNAs. A residual expression was observed of the endogenous TCRα-chain of 44% and of the endogenous TCRβ-chain of 66% on RNA level (Supplementary Fig. S6A). To assess further the ability of the transferred TCR chains to replace the endogenous TCR chains on protein level, the TCR-engineered T cells were stained with a mixture of mAbs specific for TCR V regions of the endogenous repertoire (TCRα: three different mAbs; TCRβ: six different mAbs; Supplementary Fig. S6B and C). Based on these data, the frequency of TCR-engineered T cells expressing endogenous TCR chains in addition to the therapeutic TCR was extrapolated (Fig. 5E). On average, 88% of all TCR Vβ3+ T cells also expressed endogenous TCRα-chains, whereas only 68% expressed endogenous TCRβ-chains. This difference—an indicator of mixed TCR dimer formation—was markedly reduced by silencing of the endogenous TCR chains and the additional TCR optimizations. In both situations, only approximately 50% of the TCR-engineered T cells expressed endogenous TCRα- or β-chains. The lowest level of endogenous TCR expression (TCRα: 37%; TCRβ: 42%) was achieved if the T cells were generated using the mSB-miR-T1367opt vector that combined both strategies. These data demonstrate the efficient generation of TCR-engineered T cells with enhanced surface expression of the therapeutic TCR using transposon minicircles that also encode miRNAs to silence the endogenous TCR.
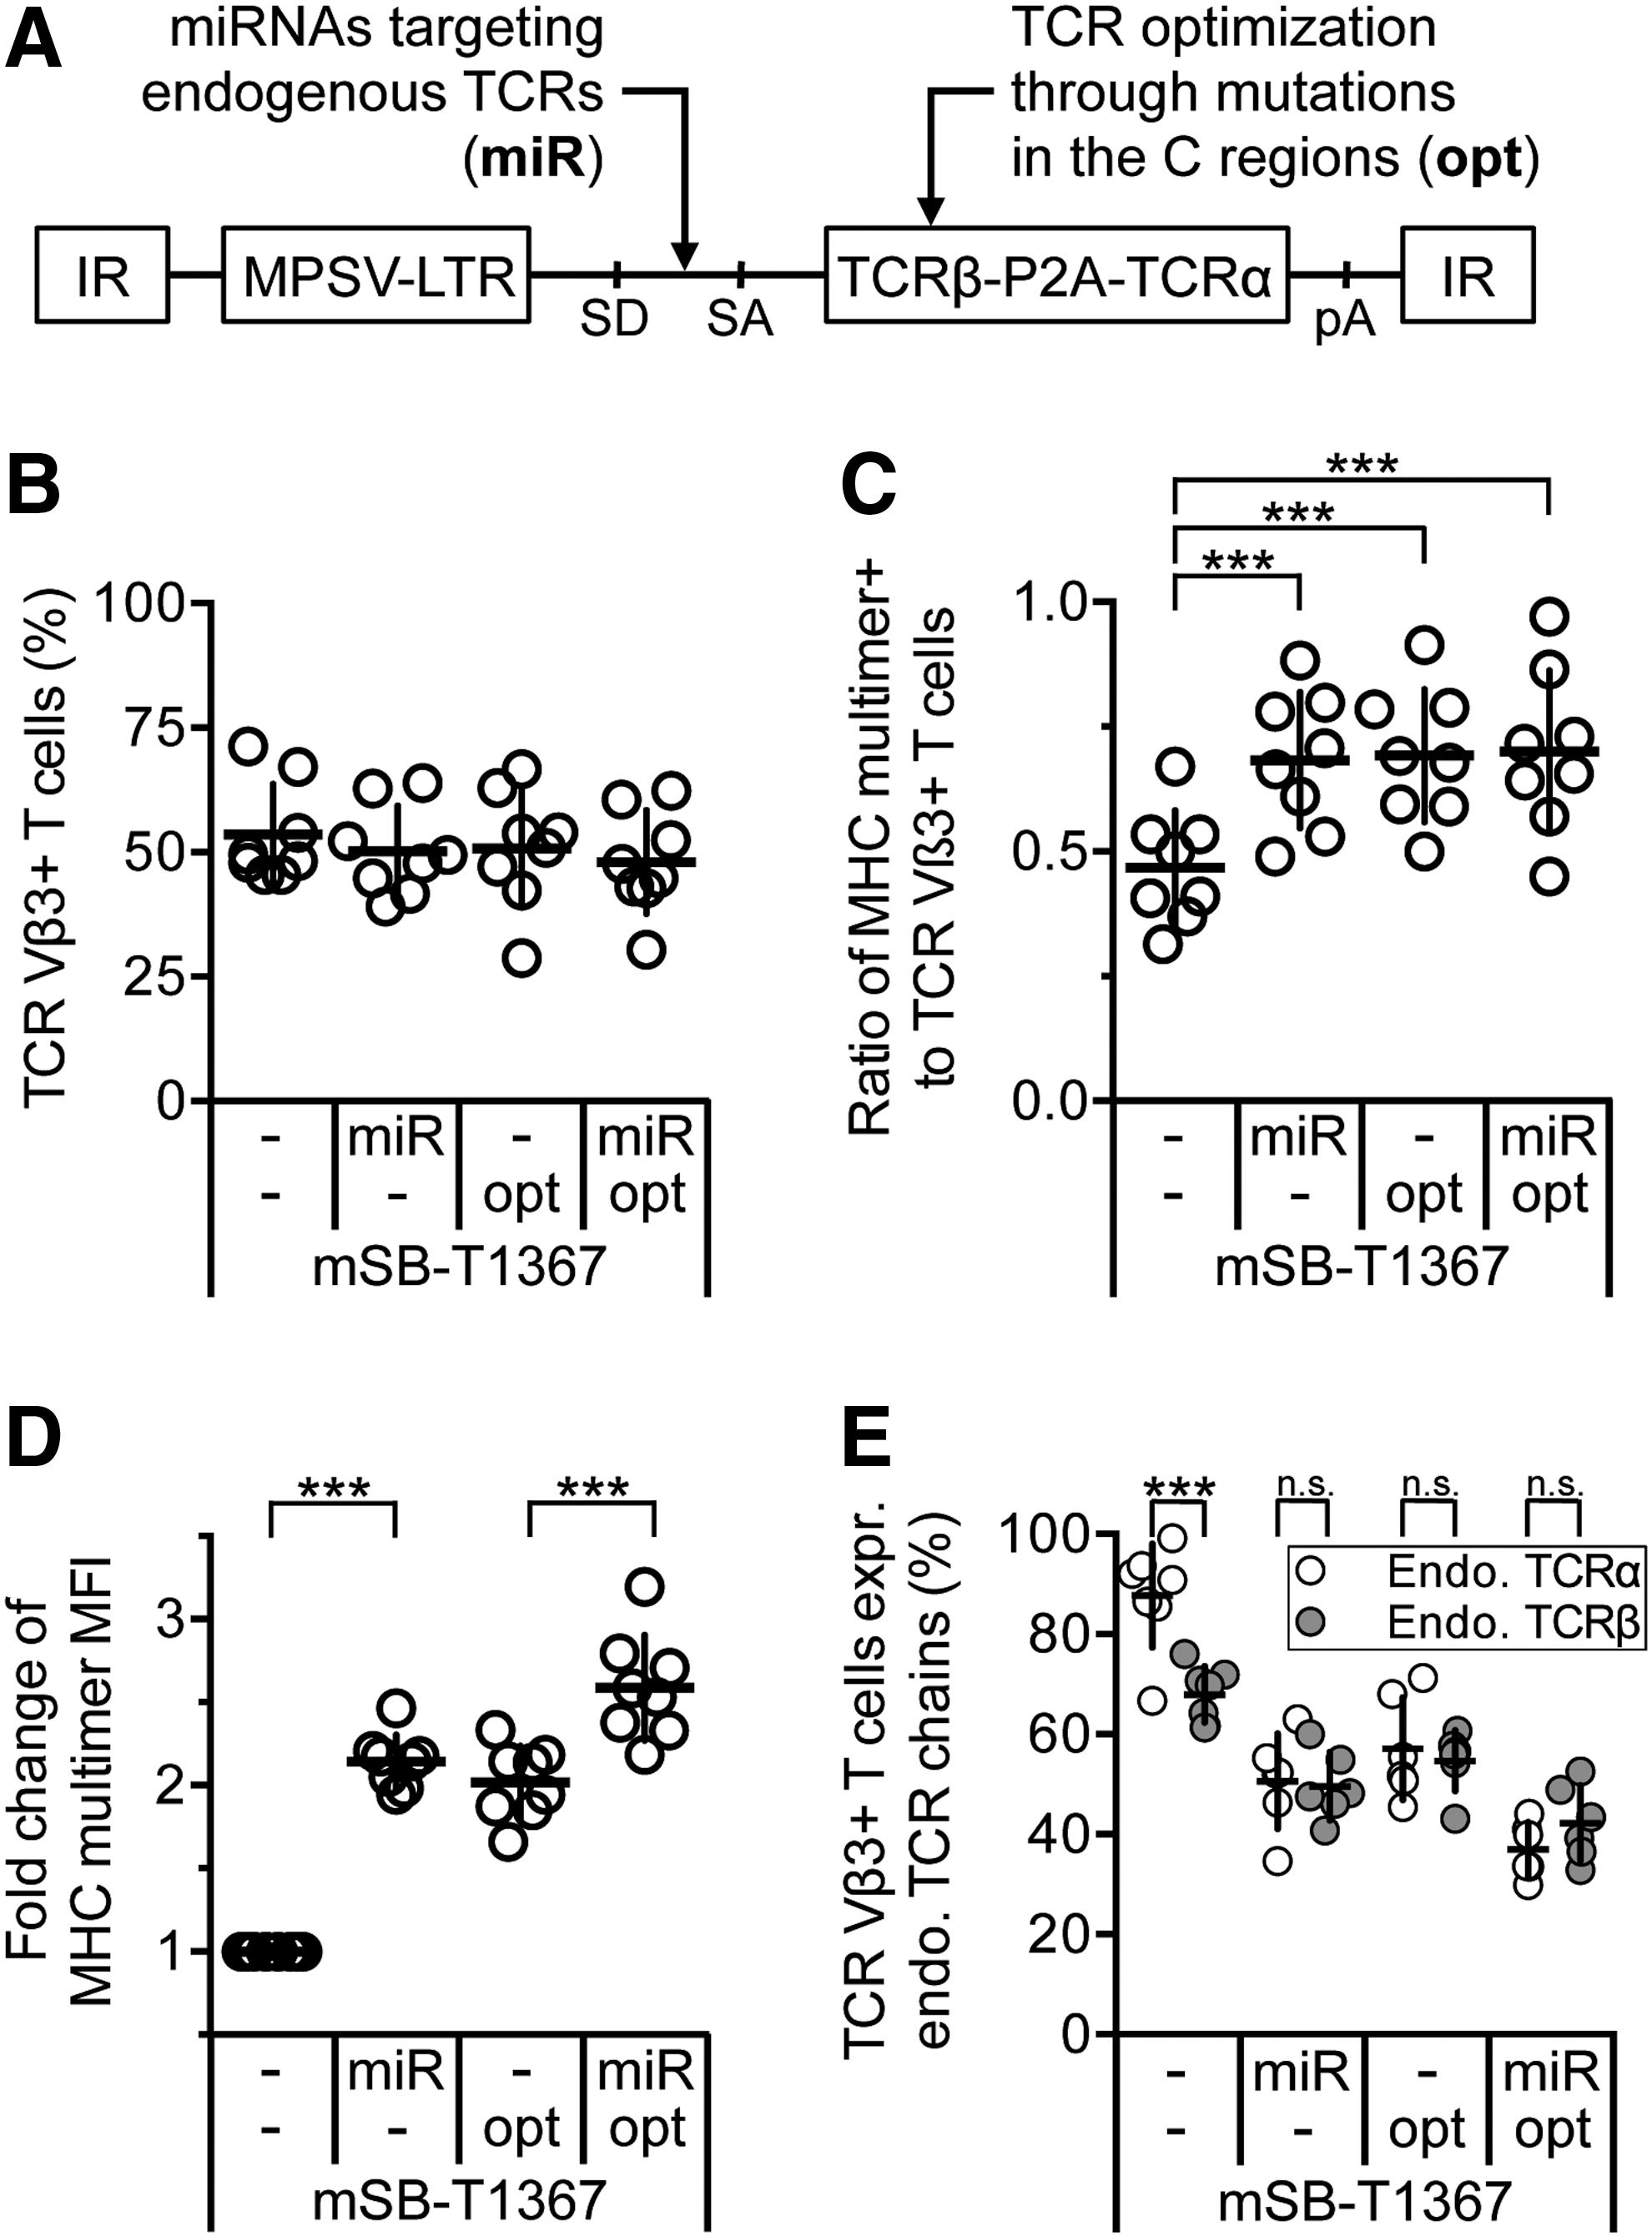
Transposons minicircles encoding miRNAs silencing the endogenous TCR enhance expression of the therapeutic TCR.
Enhanced TCR expression by transposon minicircles encoding miRNAs and optimized TCR genes improve T-cell functionality
Efficient transfection of T cells and high level of TCR cell surface expression are crucial requirements for the generation of therapeutic T cells. For the functional characterization of SBTS-based TCR-engineered T cells, the study compared the basic minicircle vector mSB-T1367 and the optimized vector mSB-miR-T1367opt that additionally harbored the optimized TCR genes and the miRNAs silencing the endogenous TCR.
First, the antigen-specific lysis of target cells was analyzed in a cytotoxicity assay. TCR-engineered T cells were adjusted with regard to the number of TCR Vβ3+ cells and co-cultured in different ratios with 51 Cr-labeled T2 cells loaded with 10−10 M MAGE-A1278 peptide. T cells engineered with either minicircle vector showed specific lysis of target cells with a modestly improved efficiency in the optimized vector (Fig. 6A and B). An analysis of the integrated TCR transgene copies indicated a similar number for the optimized vector mSB-miR-T1367opt compared to the basic vector mSB-T1367 (9.7 vs. 13 copies/cell; Supplementary Fig. S7). Second, the secretion of different effector cytokines (IFN-γ, IL-2) by TCR-engineered T cells with MAGE-A1278 peptide-loaded T2 cells showed an enhanced IFN-γ secretion of mSB-miR-T1367opt-engineered cells in comparison to mSB-T1367-engineered cells in a peptide concentration-dependent manner (Fig. 6C). T-cell stimulations of five donors with 10–6 M peptide MAGE-A1278 revealed a significant 1.5-fold increase of IFN-γ secretion (Fig. 6D). This result was confirmed by using the antigen-presenting melanoma cell line SK-MEL-37 as target cells (Fig. 6E and F). Again, T cells engineered with the optimized transposon minicircle vector demonstrated enhanced functionality, as indicated by an increased secretion of IFN-γ and IL-2.

T cells engineered with mSB-miR-T1367opt show improved functionality. T cells were electroporated with the different TCR vectors and 15 μg of SB100X transposase RNA, stimulated with anti-CD3/CD28 mAbs, and expanded for 14–18 days.
To strengthen these findings, the cytokine secretion experiments were verified using a different TCR specific for the tyrosinase peptide YMD369–377 presented by HLA-A2 (TCR T58). 29 Transposon minicircle vectors encoding TCR T58 (mSB-T58) and the optimized vector, which additionally harbored the optimized TCR genes and miRNAs silencing the expression of endogenous TCR (mSB-miR-T58opt), were generated, and T cells engineered with the different vectors were analyzed. Again, T cells engineered with the optimized transposon minicircle vector secreted higher amounts of IFN-γ in a concentration-dependent manner when stimulated with antigen-loaded T2 cells (Supplementary Fig. S8A). This effect was even more pronounced for TCR T58 in comparison to TCR T1367. The strongest effect, however, was observed upon stimulation of TCR T58-engineered T cells with the melanoma cell line SK-MEL-29. Using the optimized miRNA transposon minicircle vector mSB-miR-T58opt, IFN-γ secretion was increased >10-fold (Supplementary Fig. S8B) and IL-2 secretion almost eightfold (Supplementary Fig. S8C). These data indicate that the usage of transposon minicircle vectors encoding miRNA cassettes, which silence the expression of endogenous TCR chains, optimized TCR gene sequences, and transposase-encoding RNA enable efficient generation of TCR-engineered T cells with high functionality.
Discussion
Non-viral Sleeping Beauty transposon-based genetic modification of T cells for ATT is a promising alternative to the transduction of T cells using lenti- or γ-retroviral vectors. This study reports on a non-viral T-cell engineering system that combines Sleeping Beauty transposon minicircle vectors with an RNAi-based TCR replacement approach and SB100X transposase-encoding RNA.
The study further sheds light on a previously unnoticed effect of transfected DNA upon generation of gene-engineered T cells using transposon systems. It is demonstrated that transfected DNA causes dose-dependent cytotoxicity and induces a type I IFN response in T cells that did not depend on TLR 4 or TLR 9 stimulation and that was not observed after RNA transfection. Therefore, it was hypothesized that plasmid DNA is recognized by intracellular DNA sensors of the innate immune system such as ZBP1, IFI16, or MB21D1. 37 –39 The finding is of particular interest, as the changes in the cellular metabolism and regulation of translation that accompany an IFN response may affect the transposition reaction and the phenotype of the gene-engineered T cells.
It has been emphasized that transposon- in contrast to γ-retrovirus-mediated gene transfer does not require proliferating cells. 16 Yet, all published protocols so far included the activation of T cells in order to propagate the transfected cells. This activation step, however, conceals the adverse effect of DNA transfection on T-cell viability. The data demonstrate a dose-dependent cytotoxic effect of transfected DNA that precludes continuous culturing of the T cells without TCR stimulation. Evidence that DNA-transfected T cells are transiently not susceptible for CD3/CD28 stimulation for 1–2 days is also provided. Blast formation and proliferation of DNA-transfected T cells are delayed after CD3/CD28 stimulation. In addition, the T cells fail to upregulate CD25 and CD28 is downregulated. These effects apply to all DNA-transfected T cells, regardless of transgene expression, indicating a general effect associated with DNA electroporation. The transfected plasmid was found to be present in transgenic protein-positive as well as in -negative T cells, and an IFN response was detected in all cells after DNA electroporation.
The phenotype of the DNA-transfected T cells provides a rational for the use of additional common γ-chain cytokines and co-stimulatory molecules instead of or in addition to IL-2 and CD28. Indeed, replacing IL-2 with IL-15 or combining it with IL-15 and IL-21 and the use of CD137 for co-stimulation has been shown to improve T-cell survival and activation after DNA transfection. 17,19,44 A more targeted approach could aim to avoid the induction of an IFN response by using pharmacological inhibitors or siRNAs.
This study further presents an optimized SBTS requiring only limited amounts of DNA and thereby blunting the IFN response, which is triggered by the transfected DNA. Transposase-encoding RNA has been used to limit the enzymatic activity of the transposase temporally. Furthermore, the use of RNA prevents accidental integration of transposase-coding DNA into the genome, thereby increasing the safety of transposon-based gene transfer. 45 Minicircle vectors have been developed to reduce the immunogenicity of plasmid DNA by removing the prokaryotic backbone sequences for gene therapy with non-integrating vectors. 25 In addition, it has been shown that transposon minicircle vectors are more effectively transfected by electroporation due to their small size and thereby improve the transposition efficiency in cell lines. 46 Gene transfer efficiencies of approximately 50% in human T cells have been reported after transfection of 20 μg of a conventional transposon plasmid, together with 20 μg of transposase RNA. However, this was accompanied by severe mortality of approximately 70% of cells. 16 In another study, the decrease of the amount of plasmid DNA encoding the transposon and transposase SB100X (each 5 μg), respectively, resulted in low transfection efficiencies of human T cells (on average 10.5%). 18 Both studies used 5–10 × 106 PBMCs for electroporation. This study used 6–10 × 106 enriched T cells, and the combination of 15 μg of transposase RNA with transposon minicircles allowed the total amount of DNA to be reduced to 2.5 μg. Thereby, T-cell mortality could be substantially reduced without compromising transfection efficiency, which permitted the efficient generation and expansion of engineered T cells without including additional enrichment steps. These results support a recent study demonstrating that Sleeping Beauty minicircles enhance CAR T-cell engineering. 47
Functional differences were observed between TCR-engineered T cells that were generated with different variants of a minicircle vector encoding the high-affinity MAGE-A1-specific TCR T1367. By staining the endogenous TCR chains on TCR-engineered T cells with a panel of TCR V-specific mAbs, it was shown that the β-chain of TCR T1367 is more efficiently expressed at the surface than the α-chain. Previously, it was demonstrated in a mouse model that unequal surface levels of the transferred TCRα- and β-chain indicate the formation of potentially autoreactive mixed TCR dimers. 22 By measuring the endogenous TCRα- and β-chain surface levels, it was demonstrated that optimizing the TCR C regions by introducing two non-native cysteines 30,31 and nine amino acids of the mouse TCR C regions 32,33 or targeting the endogenous TCR by miRNAs are both effective measures to reduce the formation of mixed TCR dimers and are best combined together to achieve optimal expression levels of the therapeutic TCR.
Genome editing using programmable nucleases such as activator-like effector nucleases (TALENs) or clustered regularly interspaced short palindromic repeats (CRISPR)/CRISPR-associated 9 (Cas9) systems allow a complete shutdown of TCR expression. 48 In a seminal study, CRISPR/Cas9 was used to introduce a CD19-specific CAR into the TCRα locus under the control of the endogenous promoter, which resulted in improved in vivo function of CAR-engineered T cells. 49 However, in case of TCR-engineered T cells, effective inhibition of mixed TCR dimer formation requires not only the knockdown of both endogenous TCR chains but also a laborious strategy to identify and isolate cells with the desired genotype. 50,51 The advantage of the RNAi-mediated TCR knockdown in this study is the combined delivery of miRNAs and the therapeutic TCR by the same vector. Half of the engineered T cells that were generated with the miRNA vector exclusively expressed the therapeutic TCR, representing a complete knockout phenotype. Low levels of endogenous TCR surface expression were observed for the rest of the population. Hypothetically, the RNAi-mediated TCR knockdown could induce sequence specific off-target effects or result in the saturation of the miRNA pathway. So far, such negative effects were not observed in this study or in a previous study employing a mouse model and viral miRNA vectors. 22
In conclusion, a new approach is presented to generate gene-engineered T cells using transposon minicircle vectors tailored for TCR engineering. The combination of transposon minicircles with transposase-encoding RNA enables the efficient generation of therapeutic T cells without selection in a robust and reproducible manner. The reduced amount of DNA for electroporation minimizes the adverse effects of transfected DNA, which negatively correlates to T-cell viability, elicits a type I IFN response, and affects the T-cell phenotype. Optimized TCR genes and miRNAs silencing the endogenous TCR were combined in a transposon minicircle vector and improved surface expression of the therapeutic TCR, diminished mispairing with endogenous TCR chains, and enhanced T-cell functionality. This approach supports rapid generation of engineered T cells for ATT.
Footnotes
Acknowledgments
We thank E. Kieback (MDC) for initial support in the cytotoxicity assays and C. Genehr, Christin Hesse, M. Naschke (all MDC), and K. Hummel (Humboldt-Universität) for excellent technical assistance. This work was supported by grants from the Deutsche Forschungsgemeinschaft (Sonderforschungsbereich TR36) to W.U. and the Berlin Institute of Health (BIH) to W.U. and Zs.Iz.
Author Disclosure
The Max Delbrück Center for Molecular Medicine applied for a patent on the method for the generation of gene-engineered T cells using transposon minicircles (J.C., M.B., W.U., Zs.Iz.) and for the MAGE-A1-specific TCR T1367 (M.O.). W.U. is on the Scientific Advisory Board of Medigene and PACT Pharma.
References
Supplementary Material
Please find the following supplemental material available below.
For Open Access articles published under a Creative Commons License, all supplemental material carries the same license as the article it is associated with.
For non-Open Access articles published, all supplemental material carries a non-exclusive license, and permission requests for re-use of supplemental material or any part of supplemental material shall be sent directly to the copyright owner as specified in the copyright notice associated with the article.