
Abstract
Local delivery of anticancer agents or gene therapeutics to lung tumors can circumvent side effects or accumulation in non-target organs, but accessibility via the alveolar side of the blood–air barrier remains challenging. Polyplexes based on plasmid and linear polyethylenimine (LPEI) transfect healthy lung tissue when applied intravenously (i.v.) in the mouse, but direct delivery into the lungs results in low transfection of lung tissue. Nevertheless, LPEI could offer the potential to transfect lung tumors selectively, if accessible from the alveolar side. This study combined near infrared fluorescent protein 720 (iRFP720) and firefly luciferase as reporter genes for detection of tumor lesions and transfection efficiency of LPEI polyplexes, after intratracheal microspraying in mice bearing 4T1 triple negative breast cancer lung metastases. Simultaneous flow cytometric analysis of iRFP720 and enhanced green fluorescent protein expression in vitro demonstrated the potential to combine these reporter genes within transfection studies. Polyplex biophysics was characterized by single nanoparticle tracking analysis (NTA) to monitor physical integrity after microspraying in vitro. 4T1 cells were transduced with iRFP720-encoding lentivirus and evaluated by flow cytometry for stable iRFP720 expression. Growth of 4T1-iRFP720 cells was monitored in Balb/c mice by tomographic near infrared imaging, tissue and tumor morphology by computed tomography and magnetic resonance imaging. In 4T1-iRFP720 tumor-bearing mice, intratracheal administration of luciferase-encoding plasmid DNA by LPEI polyplexes resulted in successful tumor transfection, as revealed by bioluminescence imaging.
Introduction
L
The present study combines NIR fluorescent protein iRFP720 and firefly luciferase–based reporter genes for detection of tumor lesions and monitoring in vivo transfection efficiency of LPEI polyplexes (after microspray-based intratracheal administration), respectively. Influence of microspraying on size and in vitro transfection efficiency of LPEI polyplexes was investigated by nanoparticle tracking analysis and luciferase reporter gene assay, respectively. LPEI polyplexes were intratracheally administered in mice bearing lung metastases of syngeneic 4T1 breast cancer cells, and their transfection profile was investigated by BLI in combination with fluorescence imaging–based visualization of 4T1-iRFP720 tumors.
Materials and Methods
Transfection and transduction reagents
The CpG-free plasmid pCpG-hCMV-EF1α-LucSH expresses luciferase-bleomycin fusion protein under the control of the human elongation factor alpha promoter. 8 The iRFP720-encoding plasmid piRFP720-N1 was a gift from Vladislav Verkhusha (Addgene plasmid # 45461). pEGFP-N1 was bought from Clontech (now TaKaRa Bio USA, Inc., Mountain View, CA). Plasmids were expanded using either Escherichia coli DH5α (pEGFP-N1 based) or GT115 (pCpG based), as described elsewhere, 8 and purified using commercial kits (GeneJET Plasmid Maxiprep Kit; Thermo Fisher Scientific, Schwerte, Germany; and NucleoBond® PC 10,000; Macherey-Nagel, Dueren, Germany). LPEI (10 kDa) was synthesized and used as described earlier. 14 The VSV-G pseudotyped, self-inactivating lentivirus expresses iRFP720 under the control of the constitutively active phosphoglycerol (PGK) promoter. The iRFP720 cDNA was excised from piRFP720-N1 by XbaI and inserted into pHIV-7 carrying the PGK promoter. Lentiviral vector production was performed in 293T cells, as described earlier. 15
Cell culture and transductions
4T1 murine triple negative breast cancer cells (CRL-2539) and human lung adenocarcinoma A549 cells (CRM-CCL-185) were obtained from ATCC (LGC Standards GmbH, Wesel, Germany) and cultured in RPMI1640 (supplemented with 10% fetal bovine serum, L-glutamine, and antibiotics). 4T1 cells were lentivirally transduced with polybrene, as described earlier, 15 and sorted for iRFP720 expression on a FACS Aria III (BD Biosciences, San Jose, CA) using 633 nm excitation and a 780/60 bandpass emission filter to obtain 4T1-iRFP720 cells. 4T1-Luc cells were bought from PerkinElmer (Waltham, MA).
Polyplex synthesis
All polyplex solutions were prepared by flash pipetting based on the protocol by Rödl et al. 16 For in vitro transfection experiments, polyplexes were prepared at different N/P ratios (six or nine) at pDNA concentration of 20 μg/mL (for transfection experiment with piRFP720-N1 and pEGFP-N1) or 267 μg/mL (for microspraying of polyplexes in vitro) in HEPES-buffered glucose (HBG buffer; 20 mM HEPES, 5% [w/V] glucose, pH 7.4, sterile filtered). Polyplexes for in vivo application were generated at a N/P of 9 at a final pDNA concentration of 267 μg/mL in HBG buffer.
In vitro transfections with piRFP720-N1 and pEGFP-N1
A549 cells (10,000 cells/well) were seeded in 200 μL of medium onto a 96-well plate. After 24 h, the medium was replaced with 80 μL of RPMI1640 (without supplements) and 20 μL of of polyplex solution (containing 400 ng of piRFP720-N1, or 400 ng of pEGFP-N1, or a mixture of 200 ng of piRFP720-N1 and 200 ng of pEGFP-N1 complexed at a N/P of 9) was added per well. After 4 h of treatment with polyplexes, 100 μL of complete medium was added. For flow cytometric analysis, cells were detached after 24 h total transfection time using 30 μL of TrypLE (Thermo Fisher Scientific) and then re-suspended in 130 μL of phosphate-buffered saline (PBS; Dulbecco's PBS; Sigma–Aldrich, Darmstadt, Germany). DAPI (2-[4-amidinophenyl]-6-indolecarbamidine dihydrochloride; Sigma–Aldrich) was used for distinguishing between live and dead cells at a final concentration of 1 μg/mL. One hundred microliters of each cell suspension was analyzed using a MacsQuant Analyzer 10 flow cytometer (Miltenyi Biotec GmbH, Bergisch Gladbach, Germany). During flow cytometry analysis, cells were permanently cooled at 4°C using a Inheco CPAC unit (INHECO, Planegg, Germany). DAPI was excited with 405 nm, and emission was detected with a 450/50 nm band pass filter. Enhanced green fluorescent protein (EGFP) was excited with 488 nm and detected with a 525/50 nm band pass filter. iRFP720 was excited with 635 nm and detected with a 655–730 nm band pass filter. For evaluating expression levels of EGFP and iRFP720, dead cells were excluded.
Microspraying of polyplexes in vitro: biophysical characterization and cell transfection
After polyplex preparation, 75 μL of polyplex solution (generated at N/P ratios of 6 and 9) was microsprayed into 1.5 mL centrifuge tubes using a MicroSprayer®/Syringe Assembly (MSA-250-M; Penn-Century, Inc., Wyndmoor, PA). For evaluating the influence of microspraying on nanoparticle properties, microsprayed and non-microsprayed polyplexes were investigated for in vitro transfection efficiency in 4T1 and A549 cells by firefly luciferase assay and for size by nanoparticle tracking analysis (NTA; NanoSight NS500, Malvern, United Kingdom). Size evaluation of microsprayed and non-microsprayed polyplexes was done by NTA using a procedure described earlier. 14
Within in vitro transfection assay (based on firefly luciferase reporter gene), A549 and 4T1 cells (10,000 cells/well) were seeded onto a 96-well plate. After 24 h, the medium was replaced with RPMI1640 (without supplements), and 10 μL of polyplex solution (containing 200 ng of pCpG-hCMV-EF1α-LucSH, at N/Ps of 6 and 9) was added per well. After 4 h of treatment with polyplexes, 100 μL of RPMI1640 (with supplements) was added. After 24 h of addition of polyplexes, supernatant was removed, and cells were lysed using 30 μL of passive lysis buffer (Promega, Mannheim, Germany). For evaluating luciferase expression, 100 μL of homemade D-luciferin solution (based on sodium salt of luciferin; Promega) was added to 10 μL of cell lysate using the Tecan Infinite M200Pro equipped with auto-injectors, and luminescence (integration time: 10,000 ms; waiting time: 2 s) was measured; 1 nanogram of recombinant luciferase protein corresponds to 106 light units. Relative light unit values were normalized based on total protein amount per well. Protein quantification was done for rest of the cell lysate using a BCA assay kit (Pierce; Thermo Fisher Scientific) following the manufacturer's instructions.
Tumor models, intratracheal application
Mice (Balb/cJRj, female; purchased from Janvier Labs, Le Genest-Saint-Isle, France) were housed in individually ventilated cages (Type 2L; Tecniplast, Hohenpeißenberg, Germany) under specified pathogen-free conditions and allowed to acclimatize for at least 10 days prior to experiments. Autoclaved water and food (standard rodent diet; SSniff, Soest, Germany) were provided ad libitum. Low fluorescent diet (AIN-76A; Brogaarden Korn & Foder ApS, Lynge, Denmark) was used for at least 7 days prior to the experiments. All procedures were approved by local ethics committee and are in accordance with the Austrian law for the protection of animals and the EU directive 2010/63/EU for animal experiments.
For 4T1-Luc tumor model generation, 4T1-Luc cells were harvested with TrypLE (Thermo Fisher Scientific), washed, and re-suspended in PBS; 105 cells (counted by MacsQuant Analyzer 10 flow cytometer) in 100 μL of PBS were injected into the lateral tail vein of mice (n = 3). For 4T1-iRFP720 tumor model generation, 4T1-iRFP720 cells were harvested with TrypLE, washed, and re-suspended in PBS; 105 cells (counted by MacsQuant Analyzer 10 flow cytometer) in 100 μL of PBS were injected into the lateral tail vein of mice (n = 4). For tumor model characterization by FLI, mice were imaged on days 5, 7, and 10 post implantation by epifluorescence imaging and on day 14 post implantation by FLIT, as described below.
For intratracheal application of polyplexes, 75 μL of polyplex solution (a N/P 9 of in HBG, containing 20 μg of plasmid) was applied using the MicroSprayer®/Syringe Assembly (MSA-250-M; Penn-Century, Inc.), as recently described. 3 On day 8 post implantation of 4T1-iRFP720 cells, LPEI polyplexes (at N/P of 9) were intratracheally administered (n = 3). In brief, ketamin/xylazin (80 mg/kg and 5 mg/kg, respectively) anesthetized mice were placed on an intubation platform made in-house and intubated with a 18G 1″ catheter (BBraun, Melsungen, Germany). Polyplex solution was administered intratracheally right above the tracheal bifurcation, ensuring equal delivery into both lungs. Gooseneck light guides (white LED) were placed externally on the trachea (ventral side) so that the transmitted light ensured proper placement of the tube. On day 9 post implantation (24 h transfection), the mice were imaged first by FLI, followed by BLI and magnetic resonance imaging (MRI), as described below.
In vivo imaging
Optical imaging and CT was carried out on an IVIS Spectrum CT imaging system (PerkinElmer). Mice were shaved ventrally and dorsally to improve the signal quality for fluorescence and bioluminescence measurements. For FLIT imaging, mice received intraperitoneally 300 μl Scanlux (Iopamidol, Sanochemia, Vienna; 300 mg iodine/mL) in 5% glucose (w/v) at a ratio of 1:1.5. Fluorescence imaging was performed in epifluorescence mode, as described earlier, 3 with automated exposure time using the following excitation (Ex)/emission (Em) filter combination (excitation: 30 nm bandwidth; emission: 20 nm bandwidth): Ex: 640 nm with Em: 680 nm, 700 nm, 720 nm, 740 nm, 760 nm; and Ex: 675 nm with Em: 720 nm, 740 nm, 760 nm, 780 nm, 800 nm. All animals were imaged along with a control animal, and spectral unmixing was done for each image separately. For 3D measurement, mice were first scanned by CT in low resolution and afterwards measured for fluorescence emission in transillumination mode, according to the technique described previously. 3 Mice were anesthetized by 1.5–2% isoflurane in oxygen, placed ventral up on the grid plate, and fluorescence images were acquired at Ex: 675 nm (30 nm BW) and Em: 720 nm (20 nm BW). For BLI, luciferin (D-luciferin potassium salt VivoTrace™; Intrace Medical, Lausanne, Switzerland; dissolved in PBS at 30 mg/mL) was injected s.c. at a dose of 120 mg/kg. Bioluminescence signal was subsequently collected for 45 min at an exposure of 5 min in stage B to gain maximum signals after 20–40 min.
For MRI analysis, anesthetized animals were imaged by an Aspect Imaging™ M3 compact MRI system (AspectImaging, Shoham, Israel). T2 weighted images were acquired using a 50 mm × 30 mm body coil (time to repetition [TR]: 3,250 ms; time to echo [TE]: 63.47 ms; number of slices: 15; slice thickness: 1 mm; number of excitations: 7; slice orientation: coronal; center of slice position: 0; flip angle: 90°; scan time: 5 min 46 s). Analysis was performed by a veterinary clinical radiologist using VivoQuant™ (Invicro, Boston, MA).
Histology
After imaging, mice were sacrificed by an overdose of anesthesia and intubated. Ten percent formalin (4% formaldehyde in HBS, prepared using paraformaldehyde; Sigma–Aldrich) was instilled, as per a reported method. 17 Briefly, the intratracheal tube was connected to a bottle (filled with 10% formalin) at a height of 25 cm, and the lungs were instilled utilizing the pressure of the fluid over a time period of 5 min. The lungs were subsequently fixed in formalin for 22 h, dehydrated by gradient ethanol treatment (70%, 96%, and 100%), cleared by Xylene (Sigma–Aldrich), and embedded using Paraplast® (Sigma–Aldrich). After sectioning, the tissues were rehydrated in a descending ethanol row and stained using hematoxylin according to Harris (Carl Roth GmbH + Co. KG, Karlsruhe, Germany) and Eosin Y (Sigma–Aldrich; 3 min hematoxylin, 1 s acidified ethanol, 20 s NH4OH, 10 min eosin) for morphological analysis.
Immunohistochemistry
Sections were boiled for at least 20 min in pH 8 EDTA-Tween buffer (1 mM of EDTA +0.05% Tween R 20 in PBS) in a water bath. EDTA-Tween buffer was prepared by mixing 1 mM of EDTA (Sigma–Aldrich) with 0.05% Tween® 20 (Sigma–Aldrich) in PBS, and the pH was adjusted to 8. The sections were allowed to cool for 30 min at room temperature, and endogenous peroxidase was blocked using 3% H2O2 (v/v) in PBS. Unspecific binding sites were blocked using normal rabbit serum (Vectastain ABC Kit; Vector Laboratories, Burlingame, CA) for 30 min. The polyclonal goat anti-firefly luciferase antibody (Abcam, Cambridge, United Kingdom) was diluted in 2% bovine serum albumin (Sigma–Aldrich) in PBS to a final concentration of 1 μg/mL, and the sections were treated overnight at 4°C. In parallel, control sections were incubated with an equivalent amount of buffer for secondary antibody control. After washing in PBS, the biotinylated rabbit anti-goat antibody (Vectastain ABC Kit; Vector Laboratories) was applied for 30 min and subsequently treated with ABC reagent of the same kit for 30 min. The sections were then treated with 0.5% Triton® X-100 (Sigma–Aldrich) in PBS followed by incubation in a 3,3-diaminobenzidine tetrahydrochloride (DAB; Sigma–Aldrich) substrate solution (10 tablets in 250 mL of PBS +1.25 mL of Triton® X-100) for 7 min. Counterstaining of the sections was done using hematoxylin.
Results
The most NIR-shifted protein, namely iRFP720, with excitation/emission maxima of 710/760 nm, was selected for transfection studies. Within in vitro transfection studies, as can be seen in Fig. 1A and B, iRFP720 plasmid showed similar expression profile when compared to EGFP-encoding plasmid. Both plasmids share the same backbone (N1) and promoter (CMV). There was no fluorescence overspill between the two fluorophores when using the 488 nm laser line for excitation and a 525–550 nm bandpass filter for EGFP, and 635 nm laser excitation and a 655–730 nm bandpass filter for iRFP720. Within co-transfection experiment (Fig. 1C), a high level of transgene expression for both iRFP720 and EGFP reporter genes was observed, with good signal correlation. However, low EGFP-expressing cells were negative for iRFP720 expression. Further, the iRFP720 cDNA was cloned into a pHIV7/SF-GFP-derived plasmid, replacing EGFP and the SF-promoter, and VSV-G pseudotyped self-inactivating (SIN) lentivirus was produced in HEK-293T cells. This lentivirus was used to transduce 4T1 cells stably. After cell sorting, 85–94% cells remained positive for iRFP720 expression (Supplementary Fig. S1; Supplementary Data are available online at

Combination of near infrared (NIR)-emitting iRFP720 reporter gene with enhanced green fluorescent protein (EGFP) reporters for transient transfection studies. Cells were transfected with 400 ng of pEGFP-N1
Next, the influence of the microspraying process on biophysical properties (Fig. 2) and transfection efficiency of LPEI polyplexes (Fig. 3) was evaluated. With an increased N/P ratio (nine vs. six), particles appeared significantly smaller. After microspraying of polyplexes, both broadness of the size distribution and average size increased due to probable aggregation, thereby resulting in a decrease in particle concentration, as shown in Fig. 2A and B, respectively. Nevertheless, the fraction of particles up to 200 nm in size decreased only slightly (Fig. 2B). When comparing the in vitro transfection efficiency of native to microsprayed particles, A549 cells showed higher transfection than 4T1 cells with a N/P of 9, showing highest transfection efficiency in both cell types (Fig. 3). Microspraying of polyplexes affects transfection efficiency slightly in the case of A549 (at N/P of 9) and more significantly in the case of 4T1 cells for both treatment ratios (i.e., at N/P of 6 and at N/P of 9).
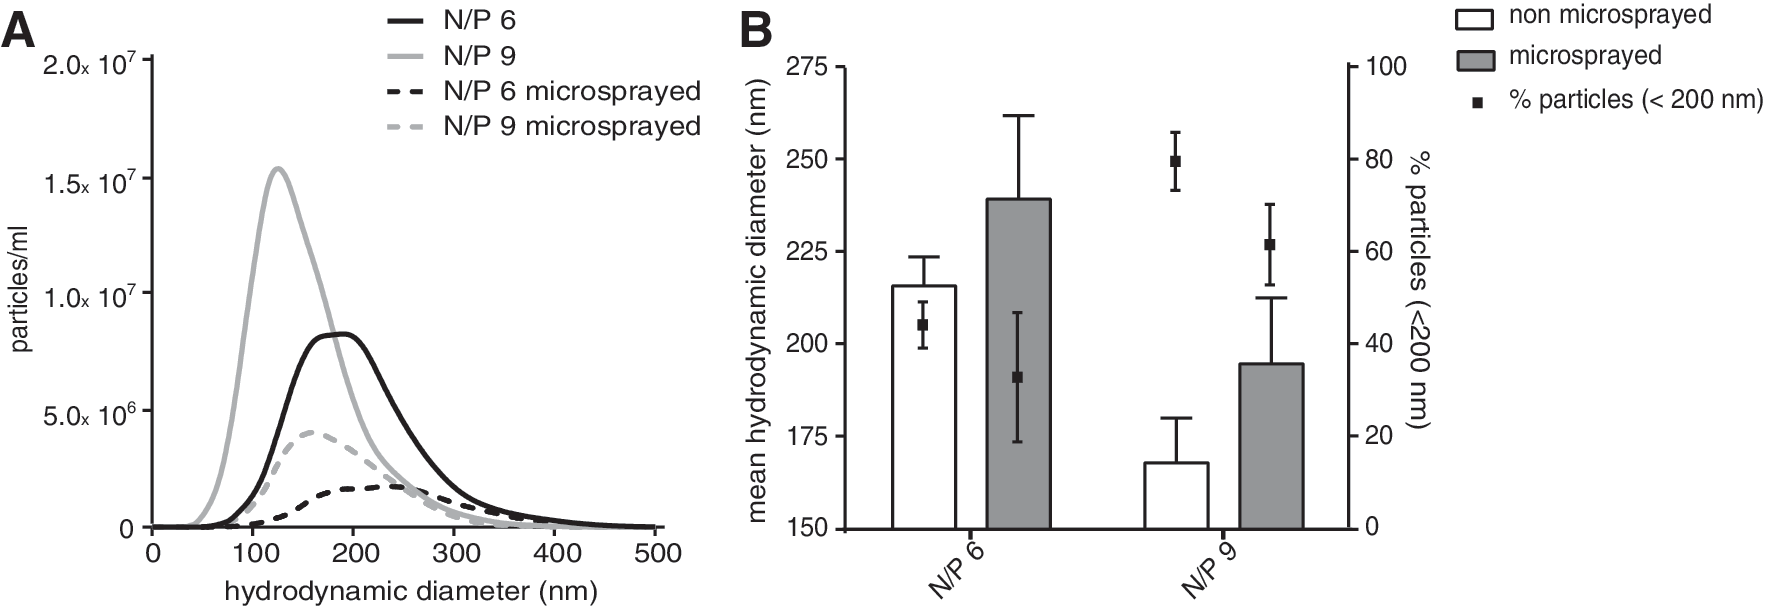
Influence of microspraying on biophysical properties of LPEI polyplexes. Polyplexes (N/P of 6 and N/P of 9) were generated in HEPES-buffered glucose (HBG) buffer at a final pDNA concentration of 267 μg/mL and underwent microspraying with a PennCentury microsprayer. They were then analyzed by nanoparticle tracking analysis (as described in the Materials and Methods) to plot particle size distribution

Influence of microspraying on in vitro transfection efficiency. A549 and 4T1 cells (10,000 cells/well) were treated with pCpG-hCMV-EF1a-LucSH-based polyplexes at a concentration of 200 ng of pDNA/well. The polyplex solution was tested before and after microspraying. Twenty-four hours later, luciferase expression was evaluated by luciferase assay protocol. Relative light unit (RLU) values were normalized based on total protein amount per well. Normalized RLU values are shown as mean values (n = 9; error bars indicate standard deviation; *p ≤ 0.05; **p ≤ 0.01; ***p ≤ 0.001; ****p ≤ 0.0001; U test [Mann-Whitney]).
Further on, the 4T1-iRFP720 disseminated tumor model (Fig. 4) was established, and it was compared to the already established 4T1-Luc model (Supplementary Fig. S2). iRFP720 fluorescence signal of 4T1-iRFP720 cell suspension was acquired with the imaging system, and optimal signal intensity was achieved with Ex 675/Em 720–740 nm as shown in Fig. 4A. In control experiments, the validity and high sensitivity of the 4T1-luc model could be confirmed. When 105 4T1-Luc cells were injected i.v. into Balb/c mice, a significant BLI signal (10-fold above background) was measured (Supplementary Fig. S2A), which further increased by three log units on day 8 after tumor cell injection (Supplementary Fig. S2A). Because of this high BLI signal, DLIT measurement and 3D signal reconstruction was possible. In the case of the 4T1-iRFP720 model, as expected, 4T1-iRFP720 cells resulted in a considerably lower signal/noise ratio when measured by epifluorescence imaging. Fluorescence signals clearly distinguishable from background appeared earliest at day 5 post injection (Supplementary Fig. S3), and required the application of the background unmixing technique. 3 With late-stage tumors (day 14 after injection), 3D signal analysis (FLIT) together with CT and contrast agent was feasible (4B). Distinct tumor areas could be identified in the lungs. Pathological evaluation of mouse lungs (21 days post tumor implantation) revealed macroscopic multiple pale nodules up to 2 mm in diameter (Fig. 4C). To examine the microanatomy of tumors and their invasion pattern, first the lung fixation technique was optimized to preserve the organ structure (Supplementary Fig. S4). Simply excising the lungs, followed by the standard fixation and embedding procedure, resulted in collapsed lung tissue without the possibility of studying bronchio-alveolar structure. Optimal structure conservation was achieved when instilling lungs of dead animals with formalin solution prior to formalin-fixed paraffin-embedded processing (Supplementary Fig. S4A and C). Hence, this fixation technology was also applied to tumor-bearing animals. 4T1-iRFP720 tumors exhibited a multifocal nodular-like appearance, with invasive parenchymal growth pattern and oligofocal single cell infiltrates (Fig. 4D and E), responsible for the macroscopic nodular structure. Notably, the tumor cells were located in the alveolar septs and could also be detected inside the alveolar space (Fig. 4E). Inside the compact tumor formations, the vascularization consisted only of capillaries, as larger vessels could not be detected.
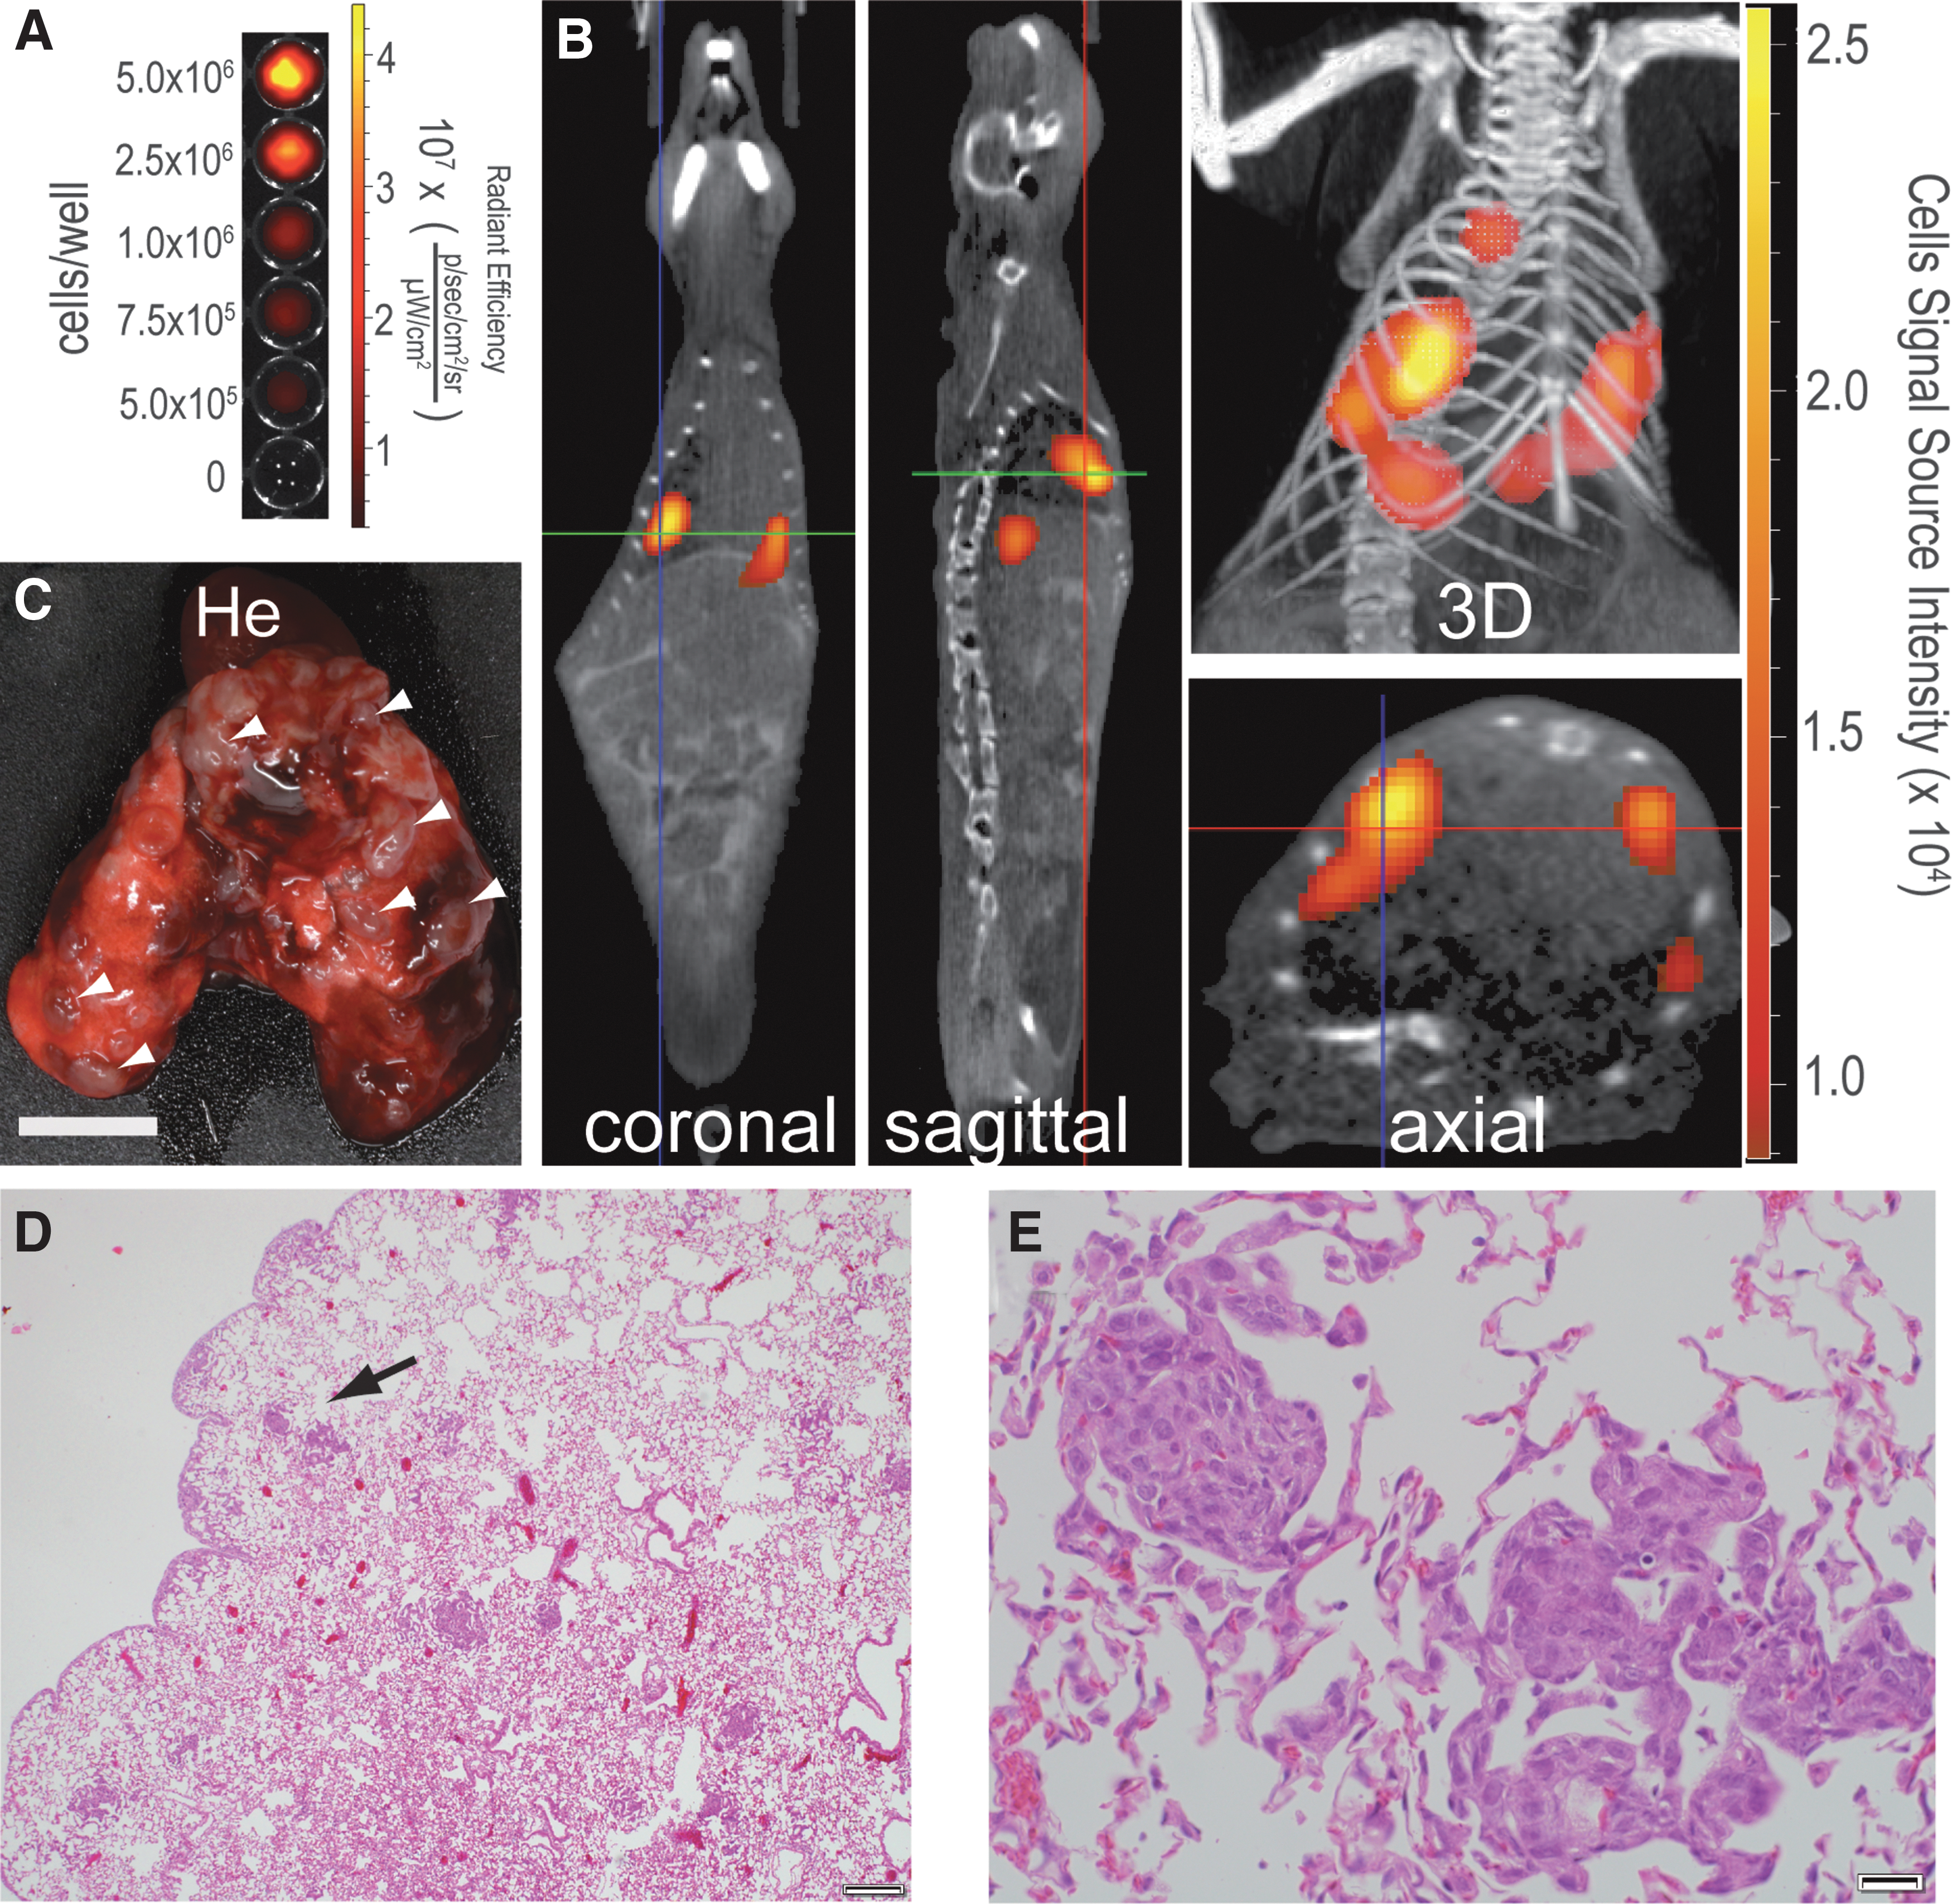
Characterization of 4T1-iRFP720 tumor model in Balb/c mice.
Furthermore, the transfection pattern of LPEI polyplexes in 4T1-iRFP720 tumor-bearing mice was investigated (Fig. 5). In all experiments, N/P 9 polyplexes were used due to their higher stability (Fig. 2) and reliability of in vivo transfection. 14 First, the tumor load and its spatial localization were evaluated using fluorescence imaging and spectral unmixing (Fig. 5A–C). Two animals showed highest signal intensities in the area of the right lung. In one animal, the overall signal intensity was less. However, the main signal was located in the left area of the lungs, with a less intense signal in the right lung (Fig. 5B). After spatially localizing the tumor via FLI signal, BLI imaging was performed on these animals to investigate the transfection pattern. Polyplex-treated animals exhibited significant BLI signals (Fig. 5D–F) when compared to control animals (data not shown). However, the BLI signals were low in signal intensity. Importantly, the localization of the BLI source not only matched the side of the FLI signal, but also partially overlapped with the fluorescence signals. Using MRI and histological analysis, tumor structures within the same localization could also be morphologically identified. Histological examination (Supplementary Fig. S5) revealed tumor nodules in all lobes. Interestingly, in the case of the animal with low FLI signal (Fig. 5B), no diffuse morphological alterations of the structure in MRI were seen, but a nodular structure of high echogenicity in the dorsal portion of the right caudal lobe, surrounded by finger-like structures of medium echogenicity, were observed only inside the left lung (Fig. 5H). The MRI of the control animal showed that all thoracic structures were of physiological appearance (i.e., no structures with high echogenicity; Fig. 5I). Histologically, tumors of this particular animal were also found in all lobes but with an area of presumably dystelectatic lung tissue inside the left lobe. For validation of LPEI polyplex-mediated luciferase gene delivery to 4T1-iRFP720 tumor, immunohistochemical staining for firefly luciferase protein of the tumor-bearing lungs was performed for both polyplex-transfected and untransfected mice (Supplementary Fig. S6). Immunohistochemical analysis revealed a pale but distinct homogenous staining pattern similar to stably transfected control tumor (4T1-Luc)-bearing lungs expressing luciferase (data not shown), thereby indicating the presence of luciferase protein in polyplex-transfected tumor mice (Supplementary Fig. S6).
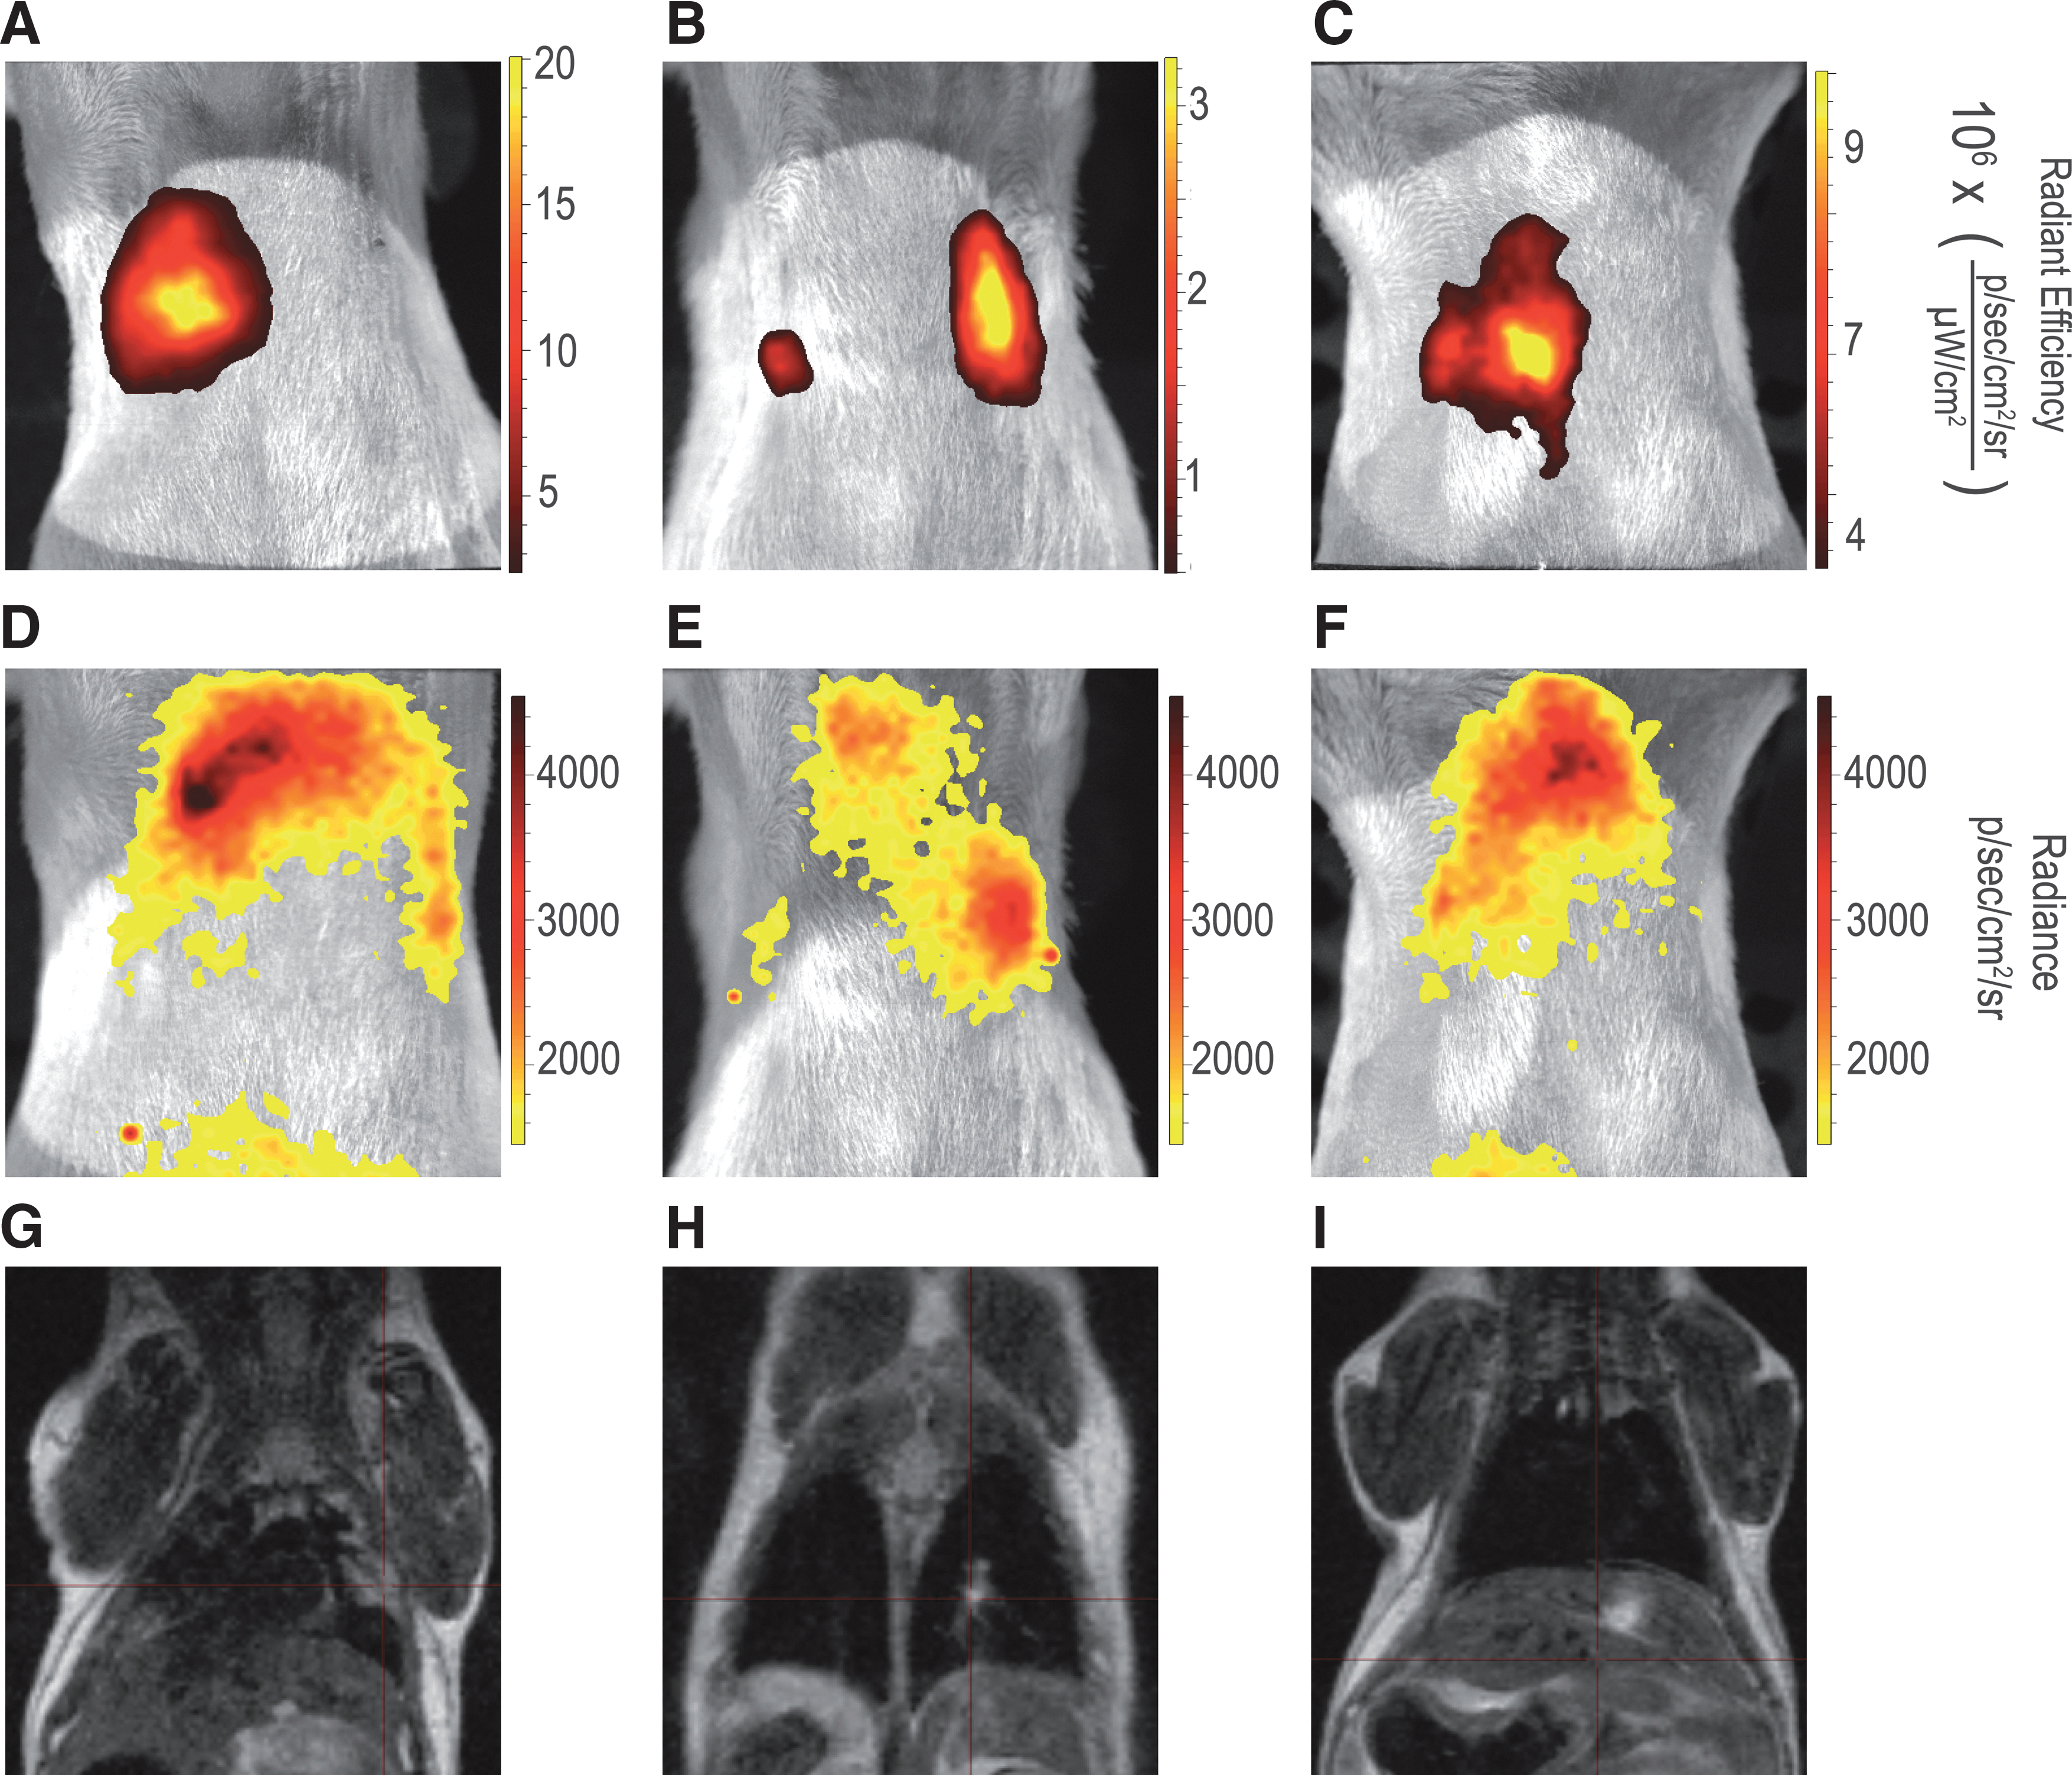
Transfection of 4T1-iRFP720 tumor after intratracheal instillation. Balb/c mice received 105 4T1-iRFP720 cells i.v. On day 8 after tumor cell injection, LPEI polyplexes (N/P 9) were applied intratracheally, and on day 9 (24 h transfection), mice were imaged by FLIT, bioluminescence imaging (BLI), and magnetic resonance imaging (MRI), as described in Materials and Methods.
Discussion
Tracking in vivo transgene expression with optical imaging via BLI of luciferase activity is a well-established method. Here, luciferases with a red-shifted emission spectrum offer optimal signal for deeper-seated signals, as there is an inverse correlation between tissue absorption and wavelength of the emitted light. 18 Also, for fluorescence imaging in vivo, the use of fluorophores emitting in the green to orange spectrum is precluded due to absorption at a lower wavelength (e.g., by hemoglobin and skin melanin). An absorption minimum is possible within the so-called biological window, ranging from approximately 650 to 900 nm, enabling preclinical and clinical use of fluorophores emitting within this range. 19,20 The fluorescent spectrum of recombinant proteins has been considerably extended into the far red and NIR, with development of a whole series of NIR-shifted protein variants with high stability and quantum yield. 13 With iRFP720 being the most red-shifted variant, this reporter protein was utilized to label different cancer lines.
First, cells were co-transfected with EGFP-encoding plasmid with a similar backbone (N1 based). Separate excitation with 488 and 635 nm laser lines, respectively, did not give any spectral overlap and hence need for signal compensation. In co-transfection, a good signal correlation was observed in cells with high levels of transgene expression. Notably, cells exhibiting low EGFP signals were negative for iRFP. This could be due to lower quantum yields of iRFP720 (in contrast to EGFP), as iRFP720 is excited only with approximately 50% efficiency when using the 635 nm laser. Nevertheless, the signal observed was specific and significant.
Next, a lentiviral vector was generated for efficient gene marking of 4T1 cells with iRFP720, and positive cells were selected by sorting. The 4T1 murine triple-negative breast cancer model syngeneic in Balb/c mice resembles several aspects of the human disease situation, such as receptor status and metastasis formation. Both orthotopically implanted tumors and direct i.v. injected tumor cells form intravascular tumors in the lungs, 21 and there is no significant difference in gene expression pattern between lung metastases derived from orthotopically implanted 4T1 cells when compared to lesions induced by i.v. injected cells. 22
The study also directly compared the 4T1-iRFP720 cells to the commercialized 4T1-Luc cells in terms of growth kinetics and sensitivity of tumor detection (Supplementary Fig. S2). It is important to note that 4T1-luc cells grew considerably faster, with mice turning moribund already 6–7 days after injection of 105 cells (heavy breathing, weight loss >10%), with a notably higher sensitivity. In contrast, 4T1-iRFP720-injected mice remained clinically unaffected for 14–19 days post implantation, also when injecting 106 instead of 105 cells (data not shown).
To obtain detailed information on the tumor micromorphology, the lung fixation procedure had to be optimized, as shown in Supplementary Fig. S4. In the case of the lungs, the penetration of the diaphragm usually leads to lung collapse. Hence, in situ fixation by whole-body perfusion, instillation, and other methods can be applied. 17 Using formalin instillation fixation, based on a constant fluid pressure, very good preservation of alveolar structures was achieved. The histological studies revealed that 4T1-iRFP720 cells form small multifocal parenchymal nodular or nodular-like tumors, with single-cell infiltrates growing within the alveolar sept architecture, as well as occasional peribronchiolar colonialization with slight side preferences, when injected i.v. (Fig. 4D and Supplementary Fig. S5). This is in contrast to the pattern observed with 4T1-Luc, where i.v.-injected cells led to tumor infiltrated parenchyma without detectable isolated tumor nodules. 22 Interestingly, FLI imaging nevertheless showed a good sensitivity, as it was able to determine a significant tumor load.
These findings could not be entirely verified using morphological analysis with the MRI. In one mouse (Fig. 5G), diffuse infiltration of both sides of the lungs was observed, matching the histological findings (Supplementary Fig. S5A), whereas FLI only showed a signal in the right lung area. In contrast, the second mouse (Fig. 5B) showed FLI signals in both lungs, as also seen in histology, but with MRI (Fig. 5H), only a high echogenicity structure in the right lung was observed. Moreover, this structure could also be morphologically related to structures other than cancerous tissue. For that reason, it is important to consider that 2D imaging cannot be used for fine morphological analysis to determine the exact location of the signal, and in the case of one particularly high signal, smaller signals can appear invisible. Also, the second example shows that morphological in vivo imaging by MRI can be limited in terms of sensitivity.
It is important to note that epifluorescence in the case of deep-seated signals comes to a limit, and transfluorescence technique in 2D or FLIT would be advisable for a more accurate quantification, but this would also then be more time-consuming. Taken together, it is nevertheless important to consider the high value of FLI in vivo imaging of iRFP720 to monitor lung tumor load in mice in terms of relative signal quantification, and with that, animals could be signal-dependent treated before they become clinically affected or even moribund. Furthermore, in the case of sufficient fluorescence emission, FLIT imaging for absolute quantification and localization could also give additional information about the tumor load (Fig. 4B). As a consequence, refinement of animal procedures to improve the ethics of lung metastasis experiments could be achieved using this model. It is also possible that if all transduced cancerous cells express the fluorescence protein, tumor load–dependent treatment in a comparable tumor load could be gained. However, it is also important to note that the heterogeneity of iRFP720 expression within the whole tumor cannot be ruled out, as approximately 90% of 4T1-iRFP720 cells were fluorescent (Supplementary Fig. S1).
When analyzing the individual tumor nodules as well as nodular structures and their growth pattern along the alveolar septs and, with that, the interference with healthy, alveolar tissue, obviously tumor cells breached through the endothelium, basal membrane, and alveolar wall and reached the air side. Similar to the clinical situation, 4T1 cells from either orthotopically implanted tumors or i.v. injected ones form intravascular tumors, occluding vessels, and after prolonged growth invade the parenchyma and reach the luminal side, as also observed in Fig. 4E. 21 This should make these tumors accessible for LPEI polyplexes when applied via the airways.
Accessibility is of key importance, as Hasenpusch et al. demonstrated that only lung tumors with access to the air side were accessible for aerosolized polyplexes. 6 In this case, only tumors that grew after intrabronchiolar cell application were transfected by polyplexes, whereas i.v.-applied cells (A549 human lung carcinoma xenografted in NSG-mice) exhibited a diffuse parenchymal infiltration pattern and could not be transfected by aerosolized polyplexes. In the case of optical imaging, sensitivity of detection was much lower for fluorescence imaging in comparison to bioluminescence. This is substantiated by the presence of a clear bioluminescence signal in the lung area (Supplementary Fig. S2) immediately after i.v. injection of 105 4T1-luc cells. On the other hand, with 4T1-iRFP a significant signal was only seen at the earliest at 5 days post implantation. However, the tumor growth rate was observed to be more aggressive in the luciferase-transfected tumor cells in comparison to 4T1-iRFP720 cells (Supplementary Figs. S2 and S3). Switching to a chlorophyll-free diet could reduce fluorescence from stomach and intestine, but the spectral unmixing procedure still had to be applied to improve detection of the lesion by 2D epifluorescence imaging. 3 Despite the spectral unmixing process, signals from the stomach were still detectable. This indicates the need to reduce background both by a reduced FL diet and also by the spectral unmixing procedure.
In a similar work by Shcherbakova and Verkhusha, 13 3D tomographic imaging of deep-seated signals in the liver by FLIT was achieved using iRFP713 after transduction with iRFP713-encoding adenovirus. However, in the present study, FLIT was possible only in individual animals with high fluorescence signal and probably also high tumor load. Due to less sensitivity, 3D FLIT imaging with subsequent quantification based on a created database needs a critical threshold to gain a better signal-to-noise ratio. In the case of the presented mid-stage tumor load and a rather low expression rate of iRFP720 protein in 4T1-iRFP720 cells (data not shown), FLIT reconstruction was possible but not without excluding background from the stomach. Selecting and sorting of cells with even higher iRFP720 levels might help to increase the homogeneity of RFP expression within the whole tumor, but care has to be taken to avoid cytotoxic effects due to high reporter gene expression. In order to improve sensitivity, alternatives are also being considered, such as the use of luciferases with substrates other than luciferin and approaches based on bioluminescence resonance energy transfer. 23
Consideration of biophysical properties of polyplexes is crucial for efficiency of transfection both in vitro and in vivo, and especially with respect to the influence of microspraying on size and transfection ability. NTA showed that N/P 9–based polyplexes had significantly higher percentage of particles up to 200 nm in size in comparison to N/P 6, which can be ascribed to the excess polymer, as also reported in other studies. 24,25 The microspraying process did not drastically change the fraction of particles up to 200 nm, which are important for transfection. 26 This is supported by the results of in vitro transfection of A549 cells, where there was only slight decrease in transfection efficiency (Fig. 3). However, in the case of 4T1 cells, detrimental effect of microspraying on transfection efficiency may be ascribed to their low transfectability, which can also be observed in comparison to A549 (Fig. 3). When compared to the very high bioluminescence signal observed with N/P 9 LPEI polyplexes in Balb/c mice, 14 transfection was very low when applying such polyplexes intratracheally (data not shown). This is in agreement with observations by Bragonzi et al., where a 100-fold lower luciferase activity was seen with LPEI polyplexes when comparing intratracheal to i.v. application. 27
Additional barriers for lung delivery include mucus in the larger airways, surfactant in the alveolae, and clearance by the phagocytic system in the lungs, especially for nanoparticles bearing a cationic charge such as polyplexes. Albeit mucus-producing breast cancers are known, that is, mucinous (colloidal) breast cancer, 28 triple-negative breast cancer is not known for exuberant mucus production. With IT delivery, BLI signals could be detected in the lung area, overlapping at least partially with the iRFP720 signal using FLI imaging. Notably, the side of the animal with BLI signal matched in all cases with the side having the fluorescence signals. However, the signal was very low, and an untreated animal was needed to verify the BLI signal. Importantly, immunohistochemical evaluation showed the same staining pattern as could be observed in stably transduced 4T1-luc-bearing tumor lungs showing a rather pale homogenous staining pattern. Nevertheless, background staining and unspecific binding especially for the healthy tissue cannot fully be excluded (Supplementary Fig. S6). To investigate potential transfection of healthy tissue and especially the bronchiolar epithelium, further studies need to be conducted.
With the data presented here, the study successfully utilized LPEI polyplexes to transfect lung lesions after intratracheal delivery. As transfection levels were still rather low, and transfection of healthy tissue cannot be completely excluded, further improvements for the LPEI polyplex part are conceivable. Imaging-based biodistribution studies of these polyplexes can also help in tracking the transfection process. For instance, some studies show liver accumulation of nucleic acids after lung delivery. This possibility of liver accumulation cannot be ruled out in the present study. To pursue tumor selective transgene expression further, the authors plan to apply targeting strategies on the transcriptional level using tumor-selective promoter elements, 29 de-targeting transgene expression on the transcriptional level utilizing microRNA binding domains, 30 or for selectivity of tumor cell uptake combined de-targeting with PEG and re-targeting with ligand binding peptides. 31,32
Footnotes
Acknowledgments
Parts of this work have received support from the EU/EFPIA Innovative Medicines Initiative Joint Undertaking COMPACT grant no. 115363. J.M. is supported by the uni:docs fellowship program for doctoral candidates of the University of Vienna. We are very grateful to Gerald Schmauss and Karin Aumayr (Research Institute for Molecular Pathology GmbH, Vienna, Austria) for sorting of iRFP720 transduced cells. We are grateful to Sebastian Gehrig for help and discussions regarding MRI analysis.
Author Disclosure
No competing financial interests exist.
References
Supplementary Material
Please find the following supplemental material available below.
For Open Access articles published under a Creative Commons License, all supplemental material carries the same license as the article it is associated with.
For non-Open Access articles published, all supplemental material carries a non-exclusive license, and permission requests for re-use of supplemental material or any part of supplemental material shall be sent directly to the copyright owner as specified in the copyright notice associated with the article.