
Abstract
Antigen delivery platforms based on engineered viruses or virus-like particles are currently developed as vaccines against infectious diseases. As the interaction of vaccines with dendritic cells (DCs) shapes the immunological response, we compared the interaction of a range of virus-based vectors and virus-like particles with DCs in a murine model of systemic administration and transcriptome analyses of splenic DCs. The transcriptome profiles of DCs separated the vaccine vectors into two distinct groups characterized by high- and low-magnitude differential gene expression, which strongly correlated with (1) the surface expression of costimulatory molecules CD40, CD83, and CD86 on DCs, and (2) antigen-specific T-cell responses. Pathway analysis using PANOGA (Pathway and Network-Oriented GWAS Analysis) revealed that the JAK/STAT pathway was significantly activated by both groups of vaccines. In contrast, the oxidative phosphorylation pathway was significantly downregulated only by the high-magnitude DC-stimulating vectors. A gene signature including exclusively chemokine-, cytokine-, and receptor-related genes revealed a vector-specific pattern. Overall, this in vivo DC stimulation model demonstrated a strong relationship between the levels of induced DC maturation and the intensity of T-cell-specific immune responses with a distinct cytokine/chemokine profile, metabolic shifting, and cell surface expression of maturation markers. It could represent an important tool for vaccine design.
Introduction
Vaccination is historically among the most successful and effective strategies against infectious diseases. Most of the currently available successful vaccines are based on live attenuated or inactivated pathogens, and they have been developed empirically with a poor understanding of the molecular mechanisms by which they elicit protective immunity. 1,2 Yet, effective vaccines for a number of major infectious diseases such as AIDS, hepatitis C virus, malaria, and tuberculosis are still lacking.
Vectored vaccines have been developed for decades as safer alternatives to the whole-pathogen approach but also for pathogens that have evolved to specifically target and destroy or hijack components of the immune system. Vaccine vectors include attenuated viruses, bacteria, plasmid DNA and RNA that are used to deliver gene(s) of a different pathogen that encode(s) critical antigen(s) for eliciting protective immunity. Viral vectors have been widely used to deliver and present viral vaccine antigens when the live attenuated viral platform is restricted by the nature of the selected pathogen. To date, there are several ongoing and completed clinical studies involving different viral vector platforms, with adenovirus and vaccinia virus strain MVA (modified vaccinia Ankara) being the most heavily exploited vectors for vaccine development as well as gene therapy. 3,4 Virus-like particles (VLPs) are also known to have the ability to directly introduce proteins into the MHC class I processing pathway needed to stimulate cytotoxic T-cell (CTL) responses. 5 The choice of a vaccine delivery system over another is currently based on intrinsic biological properties of the pathogen and on data derived from preclinical and clinical studies with individual experimental vaccines. Comparative clinical studies with vectored vaccines or VLPs are limited because such studies are difficult to perform.
The interaction of vaccine delivery systems with dendritic cells has been an area of active research in the field of vaccinology. 6 Dendritic cell (DC) signatures composed of thousands of genes of in vitro- and in vivo-stimulated DCs in mice and human DC subsets have been examined using systems biology approaches, leading to the identification of several gene expression modules that are vaccine specific. 7,8
We have previously described the immunogenic potential of diverse vaccine delivery vectors, including virus-based vectors, bacteria-based vectors, and VLPs containing the immunodominant lymphocytic choriomeningitis virus (LCMV) glycoprotein 33–41 (gp33–41) epitope model antigen. 9 In this study we focused on the early DC transcriptomic changes and the innate immune responses elicited by the vaccine delivery vectors. We used a model of systemic administration of the vaccine backbones by intravenous injection and subsequent isolation of the splenic CD11c+ DC population, and we report the detailed comparative analysis of transcriptome data of spleen DCs of mice vaccinated with nine different vaccine delivery vectors, including three different platforms (virus-based vectors, bacteria-based vectors, and VLPs).
Materials and Methods
Mice
C57BL/6 (B6) mice were obtained from Jackson Laboratories and bred at the Hellenic Pasteur Institute animal facility, according to the European standards and regulations of animal care.
Vaccine vectors
The vaccine delivery vectors are summarized in Table 1 and were produced according to the highest standards for the generation of experimental-grade preparations by each laboratory participating in the study.
Viral vectors and virus-like particles
BCG, bacillus Calmette-Guérin; dsDNA, double-stranded DNA; PRR, pattern recognition receptor; ssRNA, single-stranded RNA; VLP, virus-like particle; wt, wild type.
Vaccine injections and isolation of spleen DCs
Female C57BL/6 6- to 8-week-old mice were injected intravenously via the tail with the appropriate amount of vaccine vector diluted in 100 μL of phosphate-buffered saline (PBS). The doses of the vectors were assigned by each laboratory and correspond to the dose per mouse most commonly used for the induction of antigen-specific immune responses to recombinant antigens presented by each vector. In parallel, control mice were injected with 100 μL of PBS. Experiments were performed in quadruplicate for each vector, and at least one control mouse was included per group of mice injected with the vaccine vectors. Mice were sacrificed 6 h postinjection, and spleen DCs were purified on the basis of positive selection for CD11c. Briefly, spleen cell suspensions were obtained by preinfusion and incubation of the spleen in RPMI containing 2% fetal calf serum (FCS), Liberase CI (0.4 mg/mL; Roche, Mannheim, Germany), and DNase I (0.1 mg/mL; Roche) for 20 min at 37°C. DC-enriched fractions were obtained by incubation of splenocytes with CD11c-specific microbeads for 20 min at 4°C and subsequent immunomagnetic sorting with MiniMACS columns (Miltenyi Biotec, Paris, France). Purity after enrichment was routinely between 90 and 95% CD11c+ cells as assessed by flow cytometry.
Flow cytometry
To assess the expression of cell surface molecules of the purified spleen DCs, 0.5 to 1.0 million freshly isolated cells were stained with allophycocyanin (APC)-, fluorescein isothiocyanate (FITC)-, or phycoerythrin (PE)-conjugated monoclonal antibodies to CD11c, CD40, CD80, CD83, CD86, MHCII, and the appropriate isotype-matched controls. Stained cells were counted with a FACSCalibur flow cytometer and results were analyzed with CellQuest Pro software.
RNA extraction
After magnetic separation, spleen DCs were stored in lysis buffer RA1 (RNA II NucleoSpin; Macherey-Nagel, Düren, Germany) at −80°C. Total cellular RNA from 2 × 10⁶ CD11c+ cells was isolated with RNA II NucleoSpin (Macherey-Nagel), followed by a DNase I step using Ambion DNA-free (Thermo Fisher, Waltham, MA). Ribosomal RNA band integrity was assessed by agarose gel electrophoresis, and the concentration and purity were measured with a NanoDrop 2000 spectrophotometer (Thermo Fisher).
Microarray data acquisition and analysis
Microarrays were performed using Applied Microarrays (Tempe, AZ) technology (CodeLink mouse whole genome bioarrays). Briefly, an Ambion MessageAmp II aRNA amplification kit (Thermo Fisher) was used for cDNA and cRNA production from 1 μg of total RNA. Ten micrograms of amplified cRNA was subsequently fragmented and hybridized for 20 h, using the Applied Microarrays hybridization and washing buffers kit. Slides were scanned with a GenePix personal 4100A scanner. Quality of the hybridization was assessed with GenePix Pro 6.0. The acquired image files were then inspected for spot irregularities, and irregular spots were flagged as bad. In addition, each one of the approximately 30,000 probe spots per microarray was assessed individually for the correct alignment of the feature indicators, which are regions automatically assigned by the CodeLink software that contain probes/spots with signal. Background was subtracted from the probe intensities, and quantile normalization was performed to each vaccine set using the CodeLink package for the R programming language. Data files were subsequently imported into GeneSpring GX (Agilent Technologies, Santa Clara, CA). Samples were created from the files and new experiments were created from every set of hybridized samples. Replicates were assessed for reproducibility with box-whisker plots and scatter plots (GEO accession GSE66930).
Data were then filtered according to present and marginal identifiers, which were assigned by the GenePix Pro 6.0 software after scanning. DC samples of vaccinated mice were analyzed against their respective controls. As there were at least three mice per vaccine vector, in order to remove probes that were absent in at least one of the samples of each set (vaccine or control), a filter was applied by which only a probe that was present or marginal in at least one-half of the arrays of a vector, together with its control, was selected. To identify differentially expressed genes, a statistical parametric test (analysis of variance [ANOVA]) with Benjamini-Hochberg false-discovery rate multiple testing correction was applied to each set of samples, identifying genes with a minimum 2-fold differential expression between a vector and its control and p values less than 0.05.
Pathway analysis of vaccine-affected genes
Pathway analysis was performed with PANOGA (Pathway and Network-Oriented GWAS [genome-wide association studies] Analysis), a web-based server that provides pathway-based functional enrichment of differentially expressed genes. To this end, the list of statistically significant differentially expressed genes and their significance values were given as input to PANOGA to identify affected pathways. These genes were mapped to a protein–protein interaction (PPI) network to identify the set of interactions that were influenced by variation of each vector type. For the PPI network a Mus musculus PPI network 10 was used. PANOGA then searches for active subnetworks in the PPI that include most of the affected genes, using a greedy search algorithm in the jActive module in the CytoScape plugin. 11 The genes in these active subnetworks were mapped to Kyoto Encyclopedia of Genes and Genomes (KEGG) pathways to find out affected pathways from the set of clustered interactions coming from the active subnetworks. Affected pathways were assigned significance values, using hypergeometric distribution. 12 The affected pathways for each vector were ranked according to p values. For each group of vectors, a group member's significance values (Benjamini-Hochberg false discovery rates) were combined using the survcomp package and Fisher's weighted Z-method. 13 –15 Dot-plot schemes for molecular pathways were created using ggplot in R Studio (see Fig. 3). 16,17
Heatmap visualization
Heatmaps were generated with the MultiExperiment Viewer (MeV), a Java application designed to allow the analysis of microarray data, to identify patterns of gene expression and differentially expressed genes. MeV is an open source, free application, part of the TM4 microarray software suite (
Results
DC surface expression of costimulatory molecules induced by vaccine virus-based vectors and virus-like particles
A model of systemic administration of the vaccine backbones by intravenous injection and subsequent isolation of the splenic CD11c+ DC population was chosen for the comparison of DC early responses to vaccine vectors. Previous studies using lipopolysaccharide (LPS) demonstrated that migration of most splenic DCs from the marginal zone to the T-cell areas occurs within 4–6 h of intravenous tail injection, with concomitant acquisition of immunostimulatory capacity.
18,19
We analyzed the kinetics of spleen DC maturation in vivo in response to LPS and rAd5 vector injection at 6–12 h postinjection. Specifically, we evaluated the expression of DC activation/maturation markers MHCII, CD40, CD80, and CD86 by flow cytometry (Supplementary Fig. S1; supplementary data are available online at
Next, mice were intravenously injected with each of the vaccine preparations or appropriate diluent controls and splenic CD11c+ DCs were isolated at 6 h postinjection. The experimental vaccine vectors compared in this study included the following: the extensively used vaccinia virus strain MVA (modified vaccinia Ankara) 20 ; the first-generation adenoviral vector serotype 5 (rAd5), 21 a viral vector widely used in clinical trials for vaccine efficacy and gene therapy; and the Moloney murine leukemia retroviral vector 22 pseudotyped either with vesicular stomatitis virus glycoprotein g (VSVg) or with influenza hemagglutinin (HA). The above, well-established virus-based gene delivery vectors were compared with the more recently developed murine polyomavirus (MPyV) VLPs and murine pneumotropic virus (MPtV) VLPs, 23 which are DNA-free VLPs formed by the VP1 protein of the virus fused to target antigens. Two types of recombinant protein expression systems were used for the polyoma and pneumotropic virus VLPs: MPy-VLP-s was produced in yeast (“s” for Saccharomyces cerevisiae) and MPy-VLP-b and MPt-VLP-b VLPs were produced in insect cells via a baculovirus expression system (“b” for baculovirus). Finally, the aforementioned vectors were compared with AP205 bacteriophage-based VLPs, formed by the coat protein of the phage AP205, 24 assembled in the presence of CpG oligonucleotides and having subclinical doses of endotoxin contamination. Finally, two strains of a bacillus Calmette-Guérin (BCG) vaccine-based vector, 25 the wild-type (wt) BCG strain and a pantothenic (“pan”) BCG strain that express the Moloney murine leukemia Gag protein, were also introduced in this comparative study. Overall, three different vaccine delivery platforms were compared: recombinant viruses; VLP formulations derived from Escherichia coli, baculovirus, and yeast expression systems; and recombinant bacteria vectors.
As shown in Fig. 1, AP205-VLP, MVA, and rAd5 showed significantly higher surface expression of the costimulatory molecules CD40, CD83, and CD86 as compared with the other vaccine platforms at 6 h postinjection. CD86 upregulation was significantly higher for MVA relative to AP205-VLP and rAd5, which was the highest among all platforms, whereas AP205-VLP induced significantly higher upregulation of MHCII than all other vaccine platforms (Fig. 1 and Supplementary Fig. S2). The two BCG strains, the retro-VLPs, as well as the MPy and MPt VLPs, showed a modest upregulation of CD83 and MHCII that was marginally significantly different relative to controls.
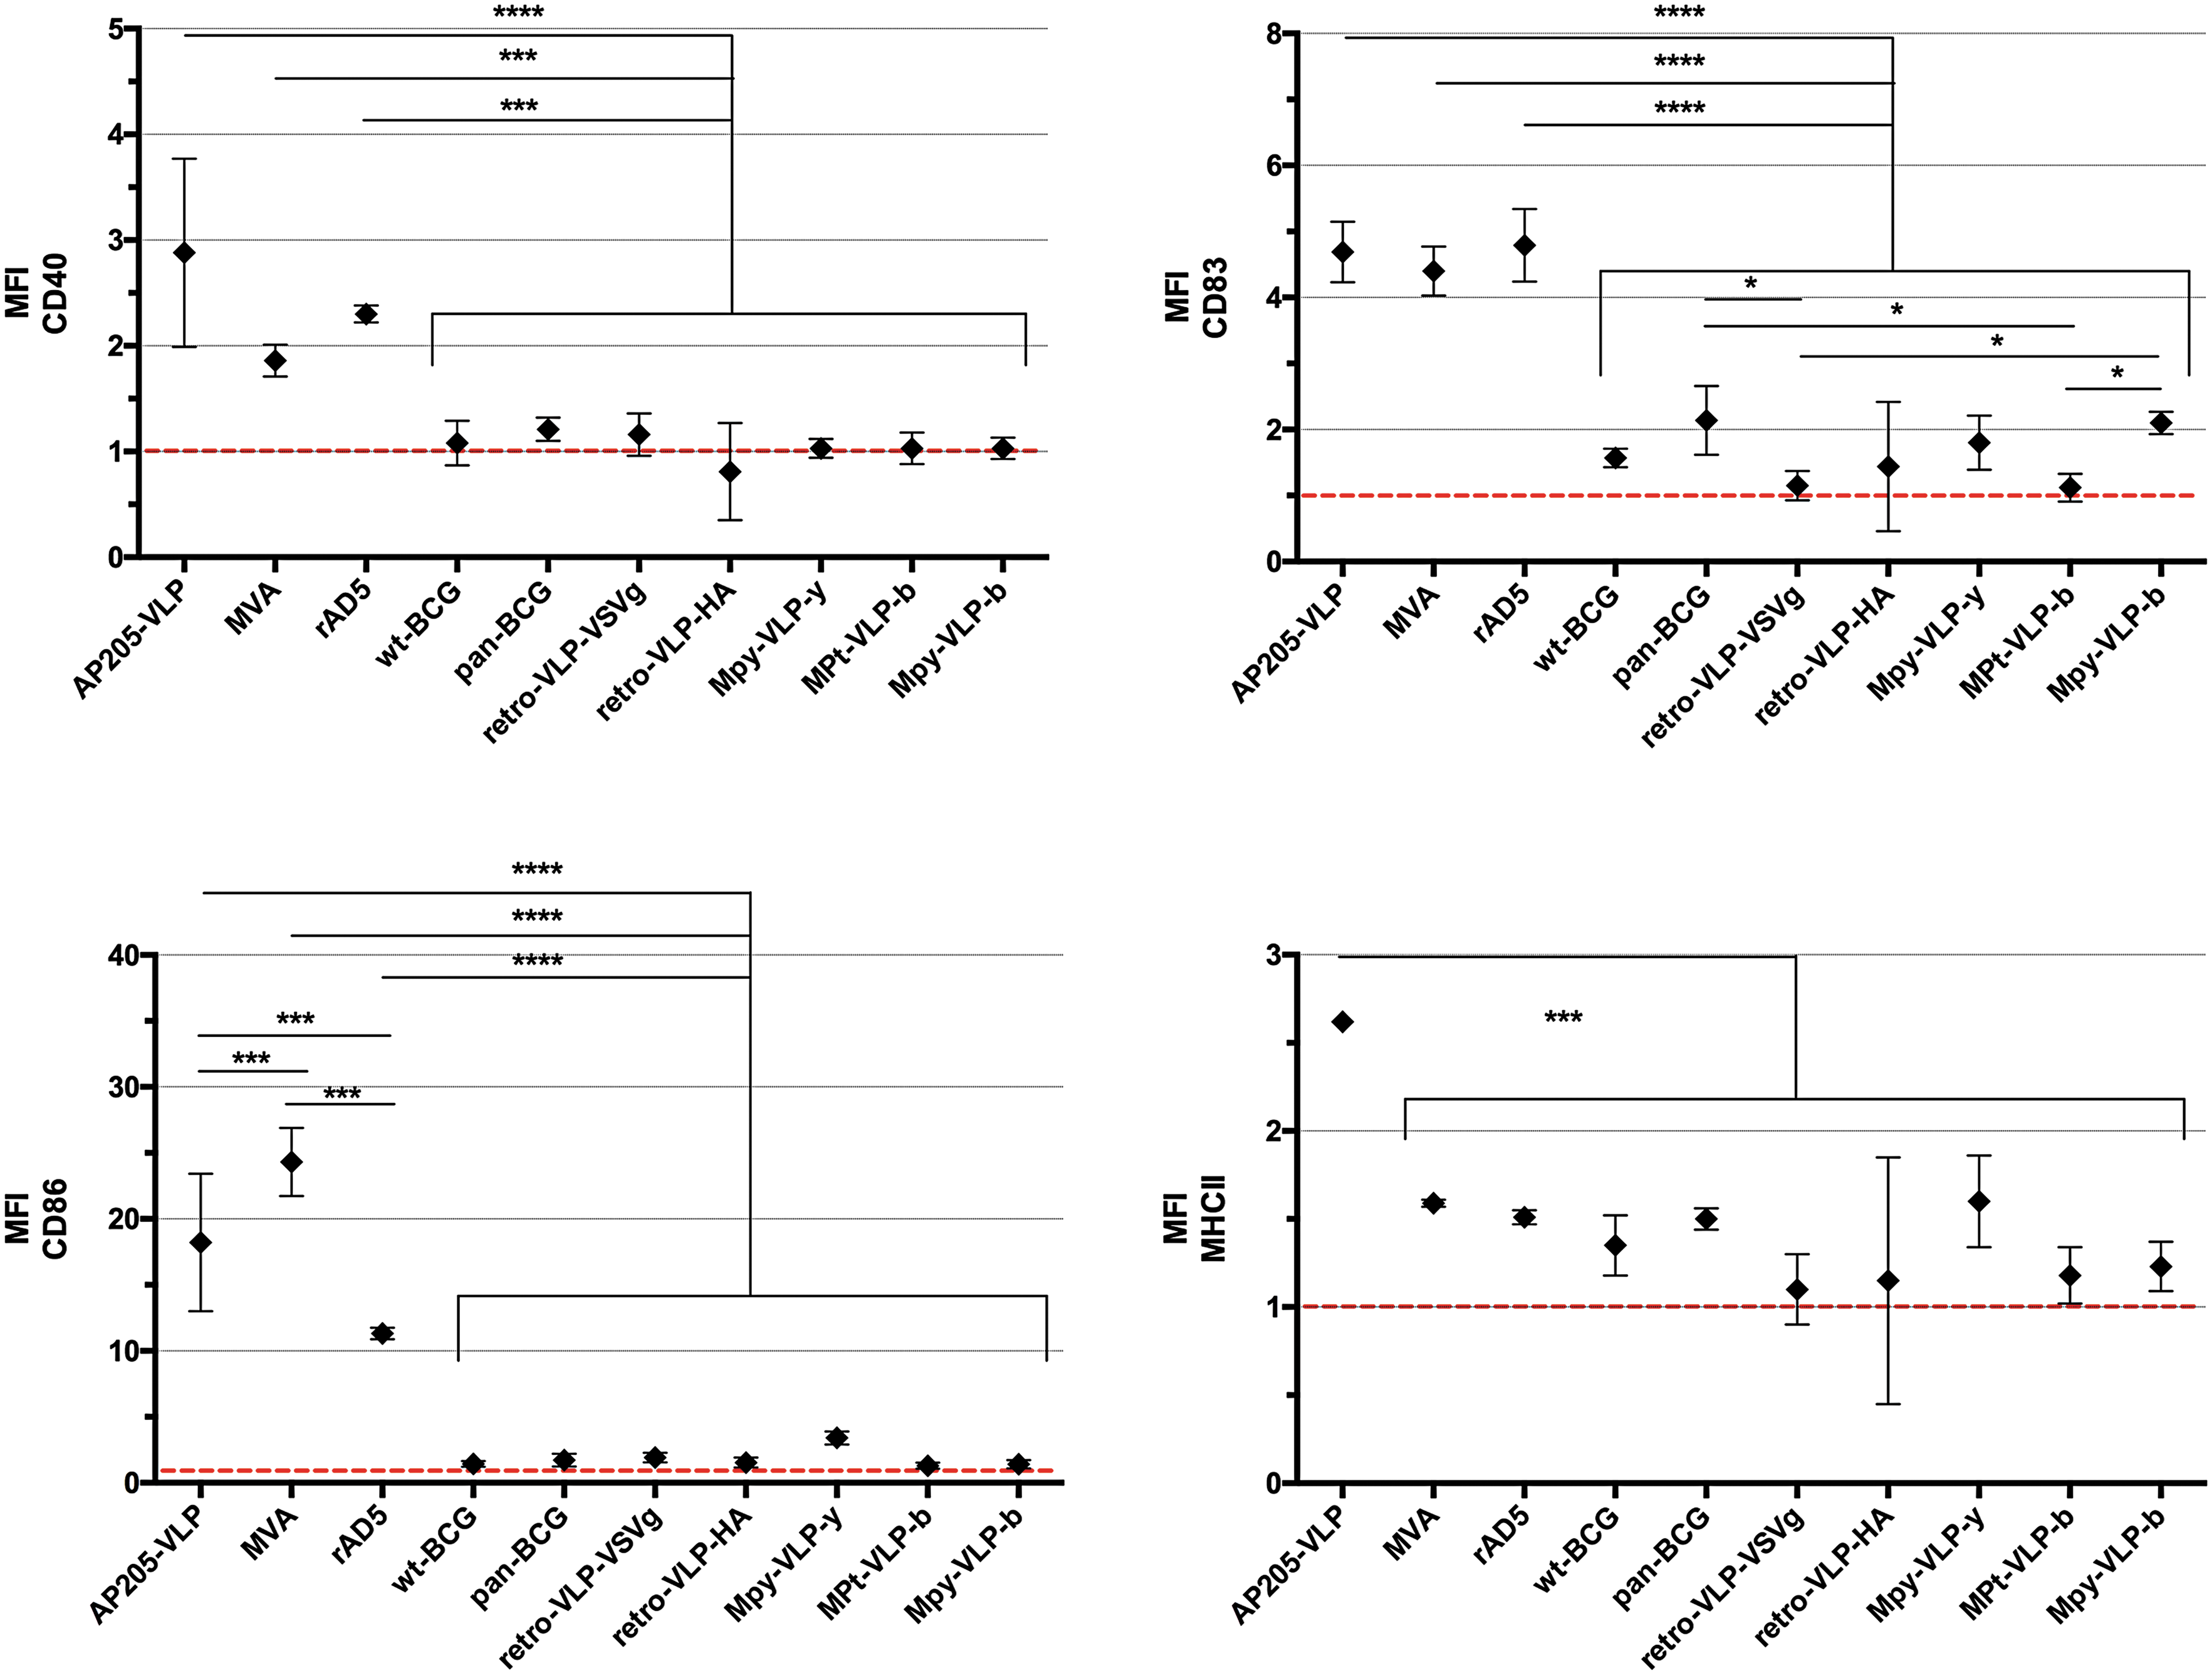
MFI of CD40, CD83, CD86, and MHCII surface expression of CD11c+ spleen DCs isolated from mice injected with AP205 VLP, MVA, rAd5, wt-BCG, Retro-VLP-VSVg, Retro-VLP-HA, MPy-VLP-y, MPt-VLP-b, and MPy-VLP-b, relative to PBS controls. ****p < 0.0001, ***p < 0.001, *p < 0.05 (ordinary one-way analysis of variance [ANOVA] with multiple comparisons uncorrected Fisher's LSD test). DCs, dendritic cells; LSD, least significant difference; MFI, mean fluorescence index; PBS, phosphate-buffered saline.
The low DC-stimulatory capacity of the MPy and MPt VLPs at 6 h postinjection was independent of dose, as administration of increasing amounts of VLPs did not increase the surface expression of costimulatory molecules (data not shown). Therefore, the VLP vaccine preparations showed low DC-stimulatory capacities in contrast to the attenuated viral vectors with the exception of AP205 VLPs. As opposed to MPy and MPt VLPs, the AP205 VLPs are assembled with CpG1668 oligonucleotides, which could be responsible for the high stimulatory capacity of the AP205 VLPs. Notably, administration of AP205 VLPs assembled in the absence of CpG oligonucleotides exhibited very mild upregulation of DC maturation markers (Supplementary Fig. S3).
The T-cell immune responses of the various vaccine platforms compared in this study have been previously analyzed 9 and were compared with the CD surface markers tested. Maximal CD8+ T-cell expansion was induced with bacteriophage-derived VLPs, whereas very low but significant responses were observed with MPT VLPs. 9 CD40 surface expression was best correlated with T-cell immune responses toward the LCMV immunodominant peptide delivered by the same vaccine platforms (Pearson r = 0.93, p = 0.003), followed by MHCII (r = 0.78, p = 0.01), and CD83, CD86, and CD80 did not correlate with T-cell responses (Supplementary Table S1).
Comparison of vaccine platforms on the basis of DC transcriptomic profiles
The differential gene expression profiles of splenic DCs 6 h after intravenous injection of vaccine vectors as compared with the expression profile of mice injected with PBS were determined by murine whole genome microarrays. In the case of MVA, rAd5, and AP205 VLPs, two independent experiments, including two different batches of vector preparations, were performed. Using ANOVA of multiclass testing type with a cutoff of p < 0.05, we identified 4,450 probes (CodeLink IDs) assigned to 3,326 single-gene IDs showing at least 2-fold induced or repressed intensity levels in at least one vector. Hierarchical clustering according to the 4,450 probes separated the vectors tested into two distinct groups characterized by high (group A) and low (group B) differential expression relative to the injection controls (Fig. 2A). Group A consisted of AP205 VLP, MVA, and rAd5 vaccines, and group B included the different types of MPy and MPt VLPs, the retro-VLPs, and the BCG-based vaccines.

Notably, the number of at least 2-fold differentially expressed genes induced by the vector platforms (Supplementary Table S2) strongly correlated with the degree of upregulation of surface-expressed CD86, CD83, and CD40 as shown in Fig. 2B.
Pathway analysis of genes differentially affected in DCs by the vaccine vectors
The total number of statistically significant differentially expressed genes and their significance values were used as input to PANOGA to identify affected pathways. The total number of genes in both group A and group B was 15,177, and 3,950 (26%) of them were significantly differentially expressed in at least one experiment/vector in group A and group B. The top 25 significant KEGG pathways for each vector as identified by PANOGA analysis were ranked according to their p values. The top three affected KEGG pathways in group A vectors identified were JAK/STAT signaling (p = 5.27 × 10–52 ), purine metabolism (p = 3.95 × 10–51 ), and oxidative phosphorylation (p = 1.07 × 10–50 ). However, the most significantly affected pathways in group B vectors were focal adhesion (p = 1.71 × 10–42 ), proteoglycans in cancer (p = 3.85 × 10–40 ), and tumor necrosis factor (TNF) signaling pathways (p = 6.41 × 10–40 ) (Table 2). The significant pathways that were affected only in group A were oxidative phosphorylation; phosphatidylinositol signaling; pathways in cancer; valine, leucine and isoleucine degradation; glycerophospholipid metabolism; and inositol phosphate metabolism. The top 20 pathways among the most significant pathways for both group A and group B vectors are listed in detail in Table 2 and in a dot-plot scheme for each of the vaccine platforms (Fig. 3). Of note, both high and low groups triggered changes in the JAK/STAT, chemokine signaling, and NF-κB signaling pathways as well as in purine and pyrimidine metabolism. The affected genes related to the oxidative phosphorylation pathway for group A vectors and the JAK/STAT signaling pathway for group A or B vectors are presented in Table 3 and in heatmap formats in Supplementary Fig. S4a and b.

Dot plot for molecular pathways and associated genes for each vector revealed by PANOGA pathway analysis. Colors of the dots indicate P-value intervals and significance of each affected pathway. ECM, extracellular matrix; JAK, Janus kinase; KEGG, Kyoto Encyclopedia of Genes and Genomes; MAPK, mitogen-activated protein kinase; mTOR, mammalian target of rapamycin; PANOGA, Pathway and Network-Oriented GWAS Analysis; PI3K, phosphoinositide 3-kinase; STAT, signal transducer and activator of transcription; TGF, transforming growth factor; TNF, tumor necrosis factor.
Ranking of top 20 significant KEGG pathways found related to group A and group B according to PANOGA
Shown are rankings of the top 20 significant KEGG pathways found related to group A and group B. Rankings were made according to given p values and group B ranking was made comparing the group A.
JAK, Janus kinase; KEGG, Kyoto Encyclopedia of Genes and Genomes; NA, not affected; PANOGA, Pathway and Network-Oriented GWAS Analysis; STAT, signal transducer and activator of transcription; TNF, tumor necrosis factor.
Affected genes related to oxidative phosphorylation pathway and JAK/STAT pathway
Significantly differentially expressed gene levels that are consistently downregulated in a certain group are shown in red. Consistently upregulated genes are shown in blue. Genes within the groups that are either up- or downregulated are shown in black. The common affected genes in all group A vectors or group B vectors are highlighted in boldface. If a gene is not significantly expressed in the group, then it is not presented in the table.
JAK, Janus kinase; STAT, signal transducer and activator of transcription.
Our observations showed that group A vectors consistently induced the downregulation of several genes involved in mitochondrial complex I/NADH dehydrogenase (Ndufb8, Ndufb11, Ndufa10, Ndufa13, Ndufa6, Ndufc2, Ndufs5, Ndufa5, Ndufa2, Ndufa8, Ndufs1, Ndufs2, Ndufs7, Ndufs8, Ndufa3), complex IV/cytochrome c oxidase (Cox8a, Cox6c, Cox4i1, Cox7b, Cox7c, Cox17, Cox6b1, Cox6a1, Cox6a2, Cox7a2l), and complex V genes forming the F-type H+ transporting ATPase (Atp5o, Atp5d, Atp5c1, Atp5g1, Atp5g3, Atp5g2, Atp5f1, Atp5a1). Collectively, the downregulation of the complexes of the electron transport chain is consistent with the switch from oxidative phosphorylation to glycolysis observed during the maturation of conventional DCs.
Importantly, we observed a consistent downregulation of specific V-ATPase subunits including Atp6ap1, Atp6v1b2, Atp6v0b, Atp6v1f, and Atp6v0d1 and the upregulation of a different subunit subset including Atp6v0a1, Atp6v1g1, Atp6v1b1, Atp6v1c1, Atp6v1d, and Atp6v0a4 among the group A vectors. The vacuolar-type H+ transporting ATPase-encoding genes are also included in the KEGG oxidative phosphorylation pathway. The vacuolar proton pumps are involved in the process of acidification of endosomes, lysosome phagosomes, and autophagosomes 26 while antigen presentation is dependent on an acidic lysosomal pH. 27 Our results suggested a possible immunoregulation of the assembly of vacuolar ATPase during DC maturation that accompanied only group A vector DC stimulation and not the low DC-stimulating vectors. Antigen presentation is an indispensable process for the development of specific immune responses after vaccination, and our observations suggest a differential regulation of vacuolar ATPase genes from the vectors resulting in stronger CTL responses.
Top genes differentially affected in DCs by the vaccine vectors
The top 20 significant genes according to the differential gene expression results for group A and group B vectors are given in Tables 4 and 5. Interferon-stimulated genes (ISGs) commonly found upregulated in cells stimulated by various pattern recognition receptors (PRRs) as well as type I and II interferons were among the top 20 significant genes. Ifit1 (Isg56) was found strongly upregulated, an 5′-PPP RNA-binding protein in complex with Ifit2 and Ifit3, as well as other RNA-binding proteins sequestering viral RNAs and inhibiting virus growth. Also upregulated were members of the two families of interferon (IFN)-γ-inducible GTPases, the p65-GBPs and the p47-IRGs, which are key mediators of the IFN-γ-induced resistance to intracellular pathogens, namely Gbp2, Gbp3 (Gbp4), and Gbp6 p65 GTPases as well as the p47 IRGs Iigp1 (Irga6), Ifi47 (Irgd), Igtp (Irgm3), and Irgm1 (LRG-47). These genes encode proteins that play an important role in the coordination of vesicular trafficking, the regulation of the processing of pathogen-containing vacuoles in host cells, and are essential for the destruction of intracellular parasites such as Listeria monocytogenes and BCG. Genes with antiviral activities that include Mx1 and Mx2 interferon-induced MX-GTPases involved in the nucleoprotein-dependent restriction of influenza viruses, the ISG15-specific peptidase Usp18, the interferon-induced Golgi chaperone Rtp4 (Ifrg28), and the regulator of TLR7 and TLR9 signaling Rsad2 (Viperin) were also significantly affected.
Ranking of first 20 significant genes found related to group A vectors according to PANOGA
Significantly differentially expressed gene levels that are consistently downregulated in a certain group are shown in red. Consistently upregulated genes are shown in blue. If some members of the groups are up and some are down regulated, it is shown in black.
FLT3, Fms-like tyrosine kinase-3; ISG15, interferon-stimulated gene 15; JAK, Janus kinase; NK, natural killer; PANOGA, Pathway and Network-Oriented GWAS Analysis; snRNA, small nuclear RNA; STAT, signal transducer and activator of transcription.
Ranking of first 20 significant genes found related to group B vectors according to PANOGA
Significantly differentially expressed gene levels that are consistently downregulated in a certain group are shown in red. Consistently upregulated genes are shown in blue. If some members of the groups are upregulated and some are downregulated, it is shown in black.
JAK, Janus kinase; NK, natural killer; PANOGA, Pathway and Network-Oriented GWAS Analysis; STAT, signal transducer and activator of transcription.
Multiple proteins that control the strength and duration of the stimulation of the inflammatory responses triggered by PRR signaling cascades have been found to be differentially regulated by the various vaccine vectors. Members of the family of suppressors of cytokine signaling (SOCS) Socs1, Socs2, and Socs3 were all upregulated. In addition, two interferon-inducible negative regulators of NF-κB and ERK signaling, Gbp2 and Ifi44, followed the same upregulation trend of ISGs. Gbp2 is an IFN-γ-induced GTPase that inhibits matrix metalloproteinase 9 (MMP9) by inhibition of NF-κB and rac by a mechanism wherein IFN inhibits the induction of MMP9 by cytokines. Gbp2 also inhibits rac, Akt, and Pi3k in order to prevent cell spreading and alters cell responsiveness to extracellular signals and growth factors. Ifi44, of unknown yet function, is suggested to bind intracellular GTP, and this depletion abolishes extracellular signal-regulated kinase (ERK) signaling and results eventually in cell cycle arrest.
Supervised categorization of genes differentially affected in DCs by the vaccine vectors
A smaller set of functional categories that describe the changing DC transcriptome was composed by combining gene ontology and literature evidence with KEGG pathways. Of the 3,326 single-gene IDs showing at least 2-fold induced or repressed intensity levels in at least one vector, 2,083 genes were assigned to one or more of the resulting functional categories (Supplementary Table S3).
This classification resulted in the identification of more than 650 genes related to innate and adaptive immune responses and 100 genes specific to the category of chemokines, cytokines, and their receptors. Importantly, hierarchical clustering of the vectors according to the 100 cytokine, chemokine, and receptor-related gene category described above resulted in a dendrogram similar to the one based on the total number of differentially affected probes (Fig. 4). This 100-gene signature accurately differentiated group A and B vectors and separated the group A vectors into three vaccine-specific subgroups, while it sorted the BCG-based vectors separately from the other group B vectors, suggesting that it alone was sufficient to classify the various vaccine platforms (Fig. 4).

Hierarchical clustering of 100 cytokine, chemokine, and receptor genes, found to be affected ≥2-fold (p < 0.05) in at least one vaccine vector-stimulated CD11c+ spleen DCs sample relative to PBS or HEPES controls. Each horizontal line represents a single probe and each column represents independent experiments. Coloring of the probes reflects the ratio of expression in the vaccine versus the control samples and ranges from saturated green (downregulation ≥2-fold) to saturated red (upregulation ≥2-fold).
A closer examination of the cytokine and chemokine genes revealed noteworthy differences when the group A vectors were compared. A striking difference in IL10 expression was observed: MVA did not upregulate IL10 at the 6-h time point of the study, in contrast to rAd5 and AP205-VLPs. Antiinflammatory cytokines Tgfb1 and Tgfb3 were also differentially regulated among the group A vectors, with Tgfb3 being induced by MVA and AP205 VLPs but not rAd5, whereas Tgfb1 was mainly downregulated by the AP205-VLPs. Helper T-cell type 1 (Th1) polarizing cytokines also exhibited distinct expression patterns among the group A vectors: IL18 was upregulated with the rAd5 vectors and AP205-VLPs but not with MVA, whereas EBL3 was upregulated only with AP205-VLPs, suggesting a possible fine-tuning of the DC response by each vector due to differential inflammatory cytokine profiles (Fig. 4).
Furthermore, we identified more than 200 transcription factors and closely related genes as well as epigenetic regulators involved in chromatin modification that were assigned to distinct categories. The genes encoding the signal transducers and activators of transcription (STATs) 1, 2, 3, 4, and 5a were all found upregulated in dendritic cells at 6 h postinjection (Fig. 5). Although all STAT members were found upregulated by group A vectors, rAd5 vector resulted in lower upregulation of the Stat4 and Stat5a genes. Notably, the group B vectors also showed some upregulation of STATs to varying degrees with the exception of STAT4, which showed no change.
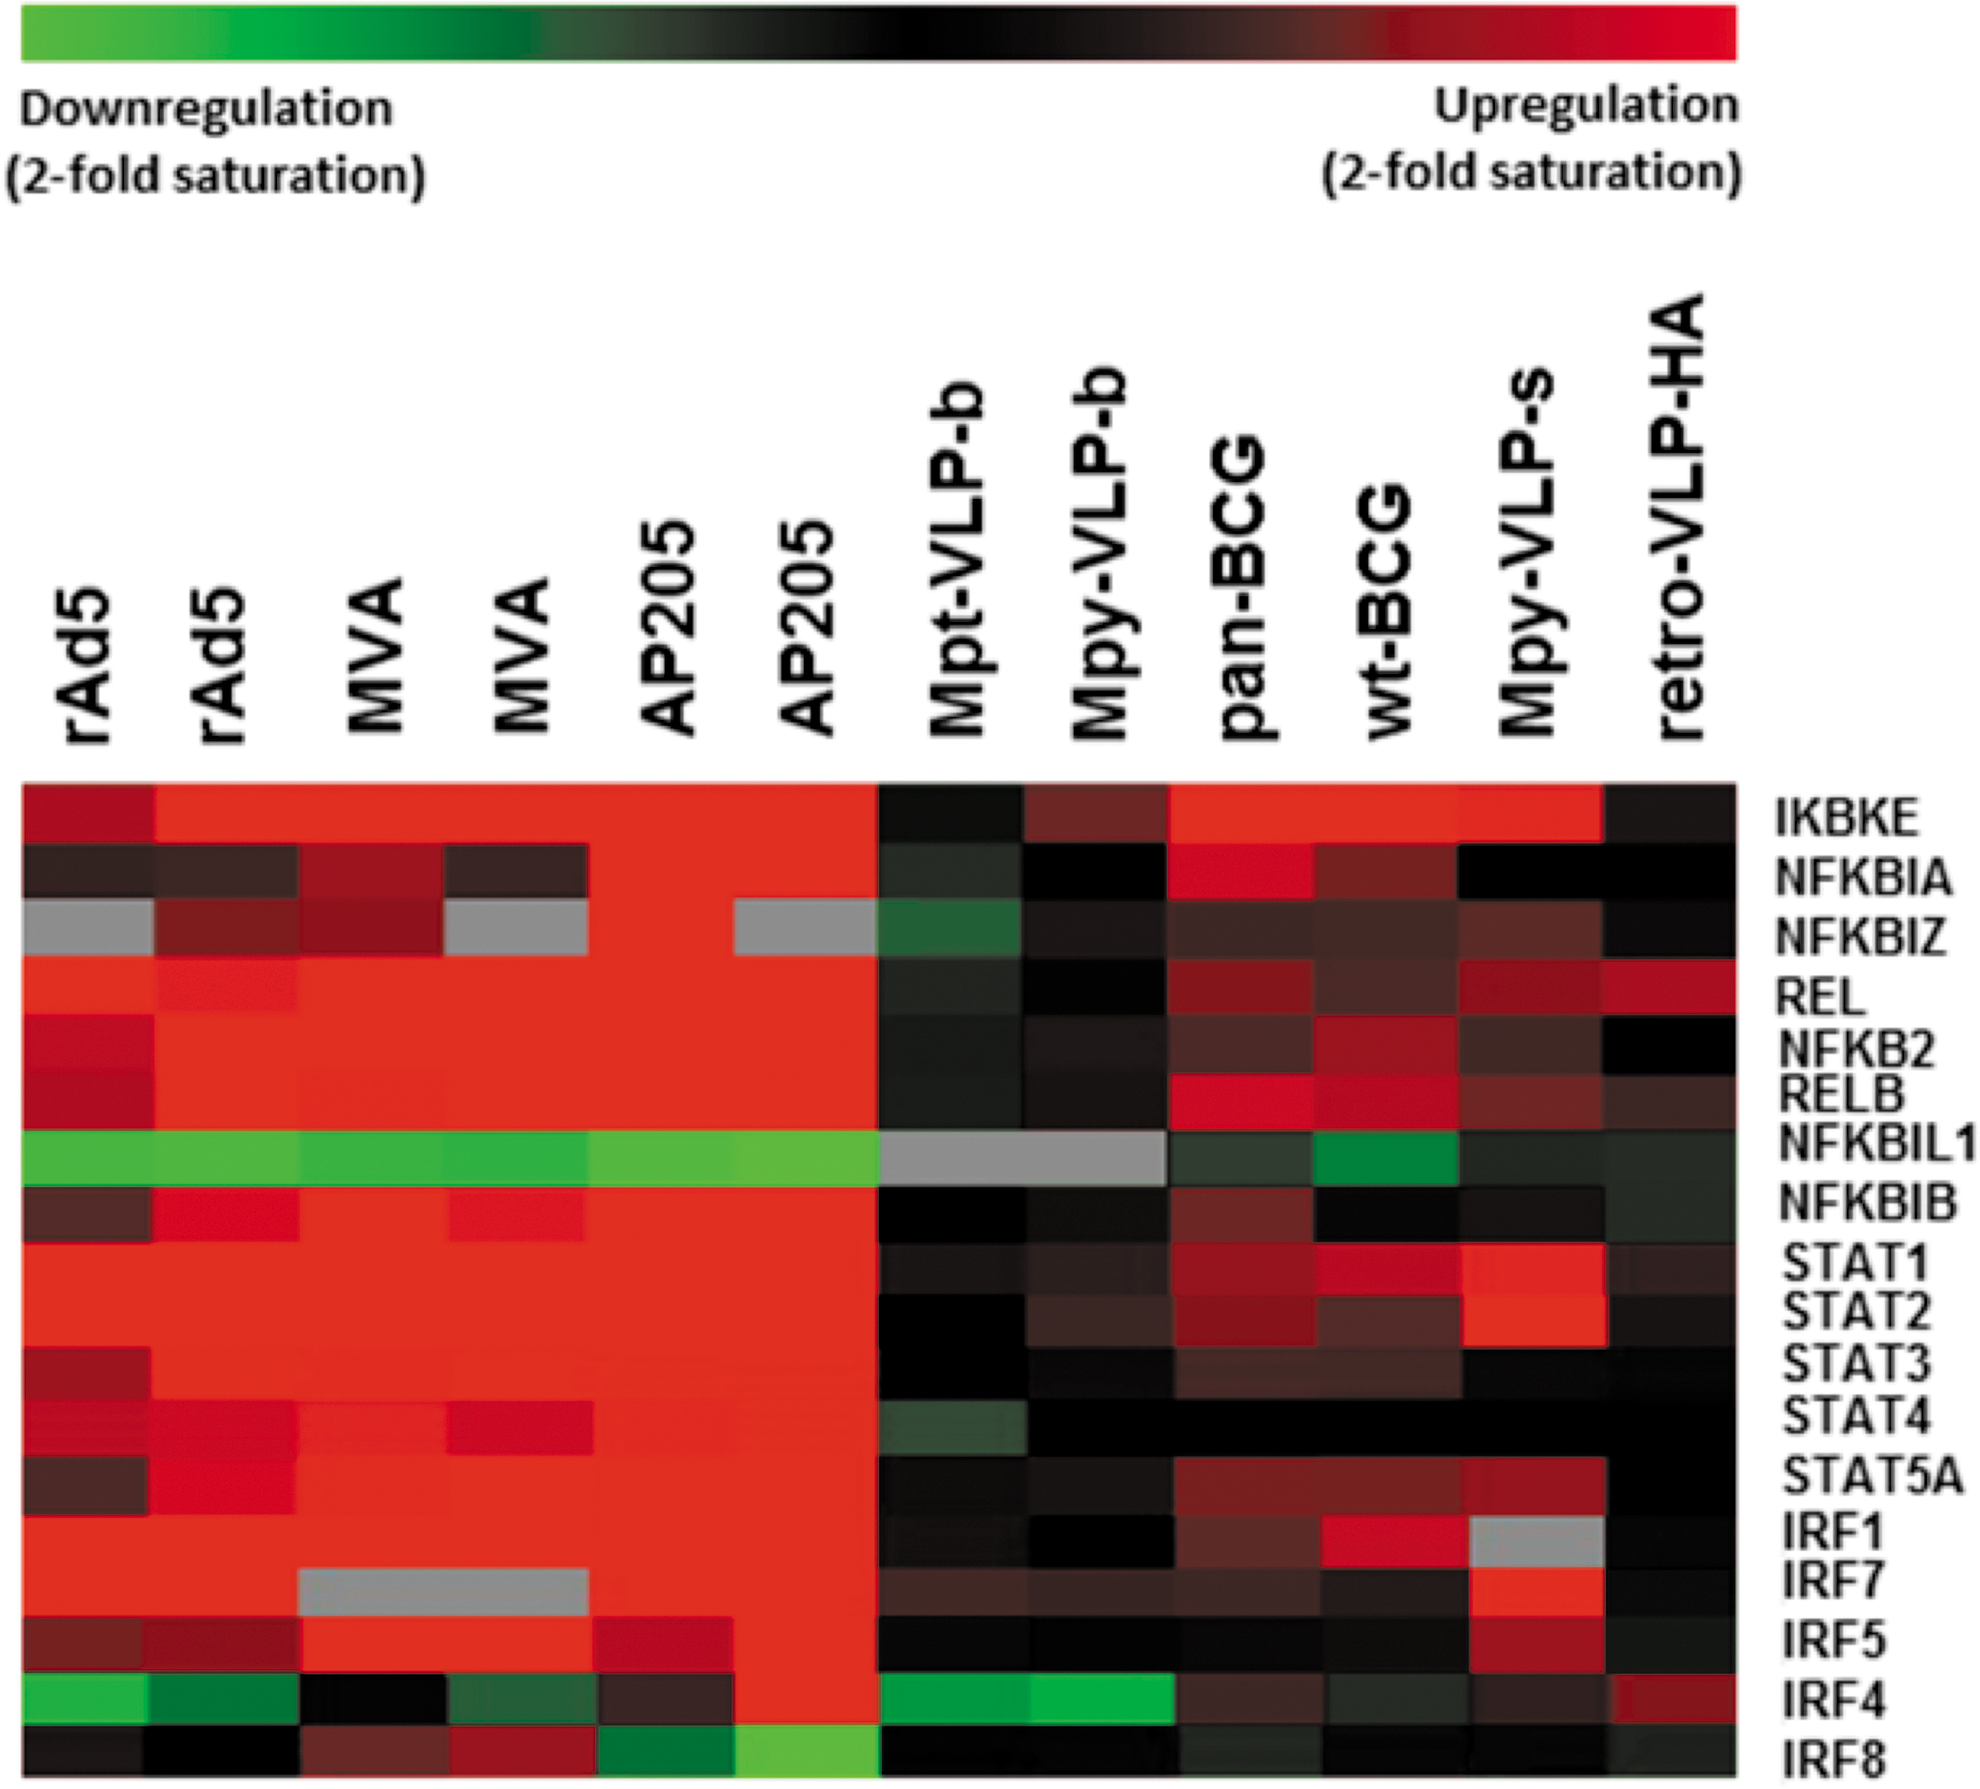
Representation of STAT, IRF, and NF-κB transcription factor expression for each vector. Each horizontal line represents a single probe and each column represents independent experiments. Coloring of the probes reflects the ratio of expression in the vaccine versus the control samples and ranges from saturated green (downregulation ≥2-fold) to saturated red (upregulation ≥2-fold) (gray, no value for these probes). IRF, interferon-regulatory factor.
Among the members of the IRF family of transcription factors found to be differentially expressed by the vaccine-stimulated DCs were Irf1, Irf4, Irf5, Irf7, and Irf8. Irf7 was highly upregulated in all group A vaccines and showed enhanced expression in the group B vaccines as well. Unlike Irf7, which was uniformly induced, Irf5 gene expression was higher in MVA-stimulated DCs and was less upregulated in rAd5-stimulated DCs, whereas it was absent in group B vectors with the exception of the yeast-produced MPy VLP. Irf5 and Irf7 both participate in the induction of type I interferon responses and the expression of certain chemokines and cytokines including TNF, and although their roles are similar they are cell type specific and nonredundant. 28,29 In our study the differences in Irf5 induction further emphasize vector-specific effects on the DC transcriptional profile during maturation.
Irf4 and Irf8 genes also showed vector-specific expression patterns. Irf4 was upregulated only by AP205-VLPs, whereas it was downregulated in adenovirus-stimulated DCs. The Irf4 gene was also downregulated by the insect cell-assembled MPy-VLPs and MPt-VLPs, which have been the most silent vaccines as measured by differential gene expression and surface expression of CD40, CD83, CD86, and MHC class II molecules. Irf8 gene expression, conversely, was downregulated in AP205-VLP-stimulated DCs, followed the opposite trend in the case of MVA, and did not change with rAd5. The changes in expression levels of the Irf4 and Irf8 transcription factors in the vaccine vector-stimulated DCs might be of particular importance. Irf8 is essential for the development of CD8α+ DCs and plasmacytoid DCs, whereas the development of CD4+ DCs requires IRF4. 30 Therefore, it could be suggested that MVA, rAd5, and AP205 injections affect differently the balance of DC subsets in the spleen and possibly result in differences in the DC presentation of vaccine antigens.
Interaction of DCs with the various vaccine vectors also induced upregulation of the NF-κB family of transcription factors including Rel (c-Rel), RelB, and NF-κB2 (p100/p52). The genes encoding RelB and NF-κB2, which are activated via the noncanonical NF-κB pathway, transmitting signals from the LTβR receptor, CD40, and BAFF, were strongly induced by most vaccine vectors in activated DCs. Three members of the IκB family of NF-κB inhibitors (IκB-α, IκB-β, and IκB-ζ) were also upregulated with the group A vectors. Nfkbib (ikBb) was upregulated in all group A vectors; Nfkbia (ikBa), on the other hand, was upregulated mostly in AP205-VLP-stimulated dendritic cells and showed only slight upregulation with most of the vectors in this study. This is an important observation that may suggest a need for containment of the activation of the NF-κB pathway in AP205 VLP-stimulated DCs. The BCG-based vaccines also stand out among the group B vectors in the upregulation of Nfkbia. Nfkbiz (IkBz), which is an NF-κB-inducible gene strongly upregulated by LPS or other innate immune response activators and believed to regulate both positively and negatively the transcriptional activity of NF-κB, was also found upregulated mostly in AP205-VLP-stimulated DCs.
Discussion
To date, most vaccines have been developed empirically with a poor understanding of the molecular mechanisms by which they elicit protective immunity. 1,2 Given the current emphasis on rationally designing vaccines on the basis of known correlates of immune protection, this study was designed to systematically investigate and compare the DC-stimulatory potential of diverse vaccine delivery vectors. To this end, a mouse model, based on the systemic administration of vaccine vectors by intravenous injection and subsequent isolation of the total splenic CD11c+ DC population, was used. The vaccine vectors analyzed were the recombinant viral vectors MVA and rAd5, and the virus-like particles Retro-VLP-VSVg, Retro-VLP-HA, MPt-VLP-b, MPy-VLP-b, MPy-VLP-s, and AP205-VLP assembled in the presence of CpG oligonucleotides. Moreover, the bacterial vectors derived from bacillus Calmette-Guérin, wt-BCG and pan-BCG, were also tested. Notably, all of the above vaccine delivery vectors engineered to carry the immunodominant LCMV gp33–41 epitope model antigen have been previously shown to induce variable degrees of specific T-cell responses. 9
Comparative analysis of the interactions of each viral vector with spleen DCs demonstrated a strong relationship between the maturation of DCs with a distinct cytokine/chemokine profile, metabolic reprogramming with cell surface expression of maturation markers, and previously examined T-cell-specific immune responses. 9
The potency to stimulate DCs correlated strongly with the ability of the vectors to induce transcriptional changes with a magnitude surpassing the 2-fold change threshold. Specifically, MVA, AP205-VLP, and rAd5 collectively resulted in the upregulation or downregulation of 3,326 genes whereas the rest of the vectors did not induce more than 2-fold changes in gene expression. Analysis of the pathways involved in the obtained DC transcriptome by PANOGA revealed that group A vectors specifically affected the oxidative phosphorylation (OXPHOS) pathway, in contrast to group B vectors. Most of the genes in this pathway were downregulated, and the overall effect of all the changes suggested downregulation of oxidative phosphorylation. The process of DC maturation via PRRs and type I interferons is now well associated with a fast switch in metabolic activity characterized by increased glycolysis and reduction of OXPHOS. 31 –33 From our results, DCs responded to the group A vectors by transcriptional downregulation of mitochondrial complex I/IV/V, associating the reduction in OXPHOS with phenotypic maturation, prominent transcriptional reprogramming, and, importantly, stronger T-cell-specific immune responses.
In contrast to the OXPHOS pathway, the JAK/STAT and focal adhesion pathways were commonly affected pathways by either group A or group B vectors. The JAK/STAT signaling pathway comprises well-established innate immune response genes. Our results demonstrated that both groups of high and low DC-stimulatory vectors induced changes in this pathway albeit at varying strength as demonstrated by the fold change expression of the genes involved. Overall, the presence of Th1 cytokines such as TNF, IL6, and the combination of STAT1 and STAT2 upregulation suggested that the group A vectors favor a Th1 response by the DCs. With group B vectors these responses were down-scaled in accordance with low DC stimulation and weak late T-cell immune responses. This is in turn consistent with the metabolic switch demonstrated by decreased OXPHOS gene expression. Evidence underlines an essential role of the bioenergetics state of mitochondria during innate and adaptive immunity. 34 Therefore, understanding the metabolic changes during the DC immune response to vaccine vectors could provide new strategies for controlling immunogenicity.
In addition, our study also demonstrated the complex but distinct immune profiling elicited by each vaccine that was particularly highlighted by the expression of cytokine- and chemokine-related genes. The diversity of the response underlies the inherent complexity of the interaction of the innate immune system with similar yet distinct vaccine platforms that only through a direct comparative study can be appreciated.
Surface expression of DC costimulatory molecules such as CD40, CD83, and CD86 as well as MHC class II clearly showed that the vectors could be separated into two groups according to their potency to stimulate DCs at 6 h postvaccination. Specifically, MVA, AP205-VLP, and rAd5 were potent activators of DCs and were designated as group A vectors whereas the retro-VLPs, MPt- and MPy-VLPs, and BCG strains induced very low or no costimulatory molecule upregulation and were assigned to group B. Overall, the VLP preparations showed low DC-stimulatory capacities in contrast to the attenuated viral vectors, with the exception of the VLPs assembled by AP205 capsid protein in the presence of CpG-1668 oligonucleotides. AP205-VLP in the absence of CpG oligonucleotides showed low DC stimulation, suggesting that maturation of DCs by genome-free VLPs is reduced relative to whole viral vectors. This has important implications in the design of the VLP vaccine formulations, and our data confirm previous studies showing a need for adjuvants such as CpG oligonucleotides in order to strongly enhance VLP DC-stimulatory capacity. 35 Like the VLPs, the BCG vaccine formulations also showed a low DC-stimulatory response consistent with previously described inhibition of potent DC activation by the bacilli. 36
Costimulatory molecule expression was also consistent with the T-cell immune responses elicited against a common model antigen, the LCMV gp33–41 peptide, delivered by the various vaccine platforms that also separated the vaccines into two clear groups of strong and weak responders. 9 Among the DC surface markers tested, CD40 expression was best correlated with T-cell immune responses toward the LCMV immunodominant peptide, followed by MHCII. CD40 expression on DCs is indispensable for efficient induction of CD4 and CD8 T-cell responses and the linkage of innate to adaptive immunity by dendritic cells. 37
In this study, we analyzed the early effects of vectors on DC gene expression profiles. It is possible that for some vectors the effects would be delayed after 6 h, and not captured in this study. In this line, the retro-VLPs that are weak inducers of DC activation have proved quite efficient at inducing neutralizing antibody responses in mice and macaques, 38,39 as well as in humans. 40 This is likely due to other intrinsic properties of these vectors that have the unique capacity to express surface proteins in their correct conformation. Nevertheless, we also showed that the in vitro activation of DCs by such VLPs could be improved by the encapsidation of noncoding RNA, which likewise provided MyD88-dependent Toll-like receptor-dependent DC activation. 41
Overall, this study has described a murine model that can potentially be exploited for preclinical evaluation of vaccine vectors and/or vaccine formulations and that provides a detailed comparative analysis of transcriptomic data of splenic DCs stimulated with a diverse collection of vaccine vectors.
Footnotes
Acknowledgments
This work was sponsored by the European Commission (
Author Disclosure
No competing financial interests exist
References
Supplementary Material
Please find the following supplemental material available below.
For Open Access articles published under a Creative Commons License, all supplemental material carries the same license as the article it is associated with.
For non-Open Access articles published, all supplemental material carries a non-exclusive license, and permission requests for re-use of supplemental material or any part of supplemental material shall be sent directly to the copyright owner as specified in the copyright notice associated with the article.