
Abstract
The initial stages following the in vitro cytokine stimulation of human cord blood CD34+ cells overlap with the period when lentiviral gene transfer is typically performed. Single-cell transcriptional profiling and time-lapse microscopy were used to investigate how the vector–cell crosstalk impacts on the fate decision process. The single-cell transcription profiles were analyzed using a new algorithm, and it is shown that lentiviral transduction during the early stages of stimulation modifies the dynamics of the fate choice process of the CD34+ cells. The cells transduced with a lentiviral vector are biased toward the common myeloid progenitor lineage. Valproic acid, a histone deacetylase inhibitor known to increase the grafting potential of the CD34+ cells, improves the transduction efficiency to almost 100%. The cells transduced in the presence of valproic acid can subsequently undergo normal fate commitment. The higher gene transfer efficiency did not alter the genomic integration profile of the vector. These observations open the way to substantially improving lentiviral gene transfer protocols.
Introduction
Hematopoietic stem-cell (HSC) transplantation is an effective treatment for many hematological disorders. 1,2 Moreover, ex vivo genetic manipulation of HSCs followed by transplantation represents a promising strategy for the therapy of rare genetic diseases. 3 However, these applications are frequently limited by the low number of available HSCs, particularly when cord blood is used as the source. 4,5 In addition, in vitro manipulation of HSCs is known to impair their engraftment in the host organism and their capacity to produce normal blood cells. 4 This issue becomes even more important in the context of ex vivo gene transfer using lentiviral vectors (LV) because HSCs are known to be poorly permissive target cells. 6 Usually, prolonged in vitro culture and high vector doses are required to reach the high transduction levels. 6 Whether performed for research purposes or as a part of a therapeutic strategy, the neutrality of the gene transfer is a fundamental requirement and a safety prerequisite. One key aspect of gene transfer that has been addressed in depth is the risks related to insertion mutagenesis of LV. This led to a significant improvement in vector design, reducing the risk of undesired effects on the expression of genes neighboring the vector genome integration site. 7 However, insertional mutagenesis is not the only undesired effect associated with LV-mediated gene transfer that may raise safety concerns. The LV–host cell crosstalk during the gene transfer has been shown to induce systematic and widespread DNA methylation changes in the genome of the CD34+ host cells. 8,9 In particular, CpG islands of >1,000 genes are systematically become methylated. DNA methylation changes occur independently of the integration of the viral genome but require cellular entry of the viral particle. 8,9 Lentiviral transduction is typically performed during the first 2 days following CD34+ cell isolation. The first 48 h following cytokine stimulation have been shown to be critical for the fate choice and differentiation of the HSCs. 10 During this period, CD34+ cells undergo two major transcriptional and morphological transitions, and initiate the cell fate decision in the absence of cell division. 10 Treatment of histone deacetylases (HDAC-s) inhibitors such as valproic acid (VPA) can extend the time window of the cell fate decision and enhance the grafting potential of CD34+ cells after transplantation, suggesting that epigenetic mechanisms play a key role at the earliest stages of the differentiation process. 11 –14 Another study showed that VPA perturbed hematopoietic homeostatis. 15 Due to the time overlap between lentiviral gene transfer and fate decision of CD34+ cells, understanding how in vitro manipulation and lentiviral transduction impact the balance between self-renewal and fate commitment/proliferation during these earliest stages of CD34+ cell stimulation is crucial to improving the therapeutic applications of these HSCs.
The present work investigated whether lentiviral transduction interferes with the transcription pattern of the CD34+ cells using single-cell RNA expression analysis coupled to time-lapse microscopy. The observations show that LV transduced cells commit preferentially to common myeloid progenitor (CMP) lineage. Treatment of the cells with VPA prior to and during the lentiviral transduction increases the efficiency of the transduction while eliminating the preferential commitment to the CMP.
Methods
Ethics statement
Human umbilical cord blood (UCB) was collected from placentas and/or umbilical cords obtained from the Centre Hospitalier Sud Francilien (Evry, France) in accordance with international ethical principles and French national law (bioethics law no. 2011-814) under declaration no. 2012-1655 (the French Ministry of Research and Higher Studies).
LV production and titration
LV production and titration protocol have already been described. 8 Briefly, HEK-293T cells lines were transiently transfected with four plasmids: the gagpol (pKLgagpol) and rev (pKrev) expression plasmids, a transfer plasmid (pCCLsin.cPPT.hPGK.eGFP.WPRE), and a plasmid encoding for vesicular stomatitis virus glycoprotein (pMDG) envelope glycoprotein. The culture medium was collected and frozen at −80°C. Vector titers were determined as transduction units/mL (TU/mL) using flow cytometry 3 days after transduction of HCT116 cells, where TU/mL = (total number of HCT116 cells) × (% green fluorescent protein [GFP]+ cells at 3 days post transduction)/(volume of vector added for the transduction).
Human CD34+ cells culture and transduction
Human CD34+ cells were isolated using immunomagnetic beads from the mononuclear fraction of UCB samples. The AutoMACSpro (Miltenyi Biotec, Paris, France) was used to separate the cells automatically. CD34+ cells were then frozen by cryopreservation in Cryostor 10 (StemCell Technologies, Vancouver, Canada) and stored in liquid nitrogen.
CD34+ cells were cultured at 37°C in a humidified atmosphere containing 5% CO2 on a 48- or 96-well plate.
For the control condition, CD34+ cells were pre-stimulated with X-Vivo 20 (Lonza, Basel Switzerland) supplemented with 100 IU/mL penicillin, 100 μg/mL streptomycin (Thermo Fisher Scientific, Waltham, MA), 50 ng/mL h-FLT3, 25 ng/mL h-SCF, 25 ng/mL h-TPO, and 10 ng/mL h-IL3 (Miltenyi Biotec) for 4–8 days. 10,16
For LV and LV + VPA conditions, cells were pre-stimulated with the same medium as control during the first 24 h (from 0 to 24 h post stimulation [hps]) in the presence or absence of VPA (Sigma–Aldrich, St. Louis, MO) at a final concentration of 1.25 mM. At 24 hps, cells were incubated with VSVG-LV on a 96-well plate for 6 h at 5 × 10⁷ TU/mL with either 4 μg/mL protamine sulfate (Sigma–Aldrich) or 12 μg/mL vectofusin-1 (Miltenyi Biotec). At 30 hps, transduced cells were washed and cultured in fresh medium supplemented as above.
For integrated VSVG-LV genome copy number determination (5 × 10⁷ TU/mL; multiplicity of infection [MOI] = 1205), the cells were cultured for 7–8 days with fresh medium (X-Vivo 20; Lonza) supplemented with 100 IU/mL penicillin, 100 μg/mL streptomycin (Thermo Fisher Scientific), 10% fetal bovine serum, 50 ng/mL h-FLT3, 25 ng/mL h-SCF, 20 ng/mL h-IL6, and 10 ng/mL h-IL3 (Miltenyi Biotec). After 3 or 7–8 days post transduction (5 × 10⁷ TU/mL; MOI = 1205), the percentages of living transduced cells (LV and LV + VPA conditions) and non-transduced cells (control) were calculated by excluding dead cells with 7-amino-actinomycin D (7-AAD; Sigma–Aldrich) labeling and by measuring GFP expression using flow cytometry (LSRII; BD Biosciences, Le Pont de Claix, France). The analyses were performed with FlowJo v10.1 (Ashland, OR).
The experiments were performed under identical conditions. The same absolute number of vector particles and identical final volumes were used, that is, the same finale concentration of vector was used in every experiment. The different MOI values result from the different number of cells. Since the MOI is defined as a ratio between the absolute number of vector particles and cells, it is very sensitive to the number of cells. However, >10, the system is fully saturated, and every cell encounters the vector, and their probability of being transduced is identical.
Single-cell quantitative reverse transcription polymerase chain reaction and data normalization
Ninety-six single living transduced (5 × 10⁷ TU/mL; MOI = 200) and non-transduced cells were sorted on the negative 7-AAD labeling at 48 and 96 hps. GFP+ cells were identified after sorting with the MoFlo Astrios cell sorter (Beckman Coulter, Villepinte, France).
Single-cell quantitative reverse transcription polymerase chain reaction (qRT-PCR) and data normalization have been described previously. 10 Briefly, single cells were sorted directly on a 96-well plate containing a RT mix solution and spikes (Thermo Fisher Scientific). RNA was denatured and reverse transcribed. Twenty cycles of preamplification of 96 primers (Thermo Fisher Scientific) at a final concentration of 500 nM were performed by denaturing the cDNA at 96°C for 5 s, followed by annealing and extension at 60°C for 4 min. Free primers were cleaned up with exonuclease I (New England Biolabs, Ipswich, MA), and preamplified products were diluted fivefold. qPCR was done with EvaGreen® Supermix with low ROX (Bio-Rad, Hercules, CA), and inventoried DeltaGenes assays in 96.96 Dynamic Arrays on a BioMark HD System (Fluidigm Corp., San Francisco, CA). Cycle threshold (Ct) values were measured with the system's software (BioMark Real-Time PCR Analysis; Fluidigm).
Ct values obtained were normalized using synthetic RNA Ct values, spike 1 and spike 4 (Thermo Fisher Scientific), added according to a set of rules provided below. For each gene, inconsistent readings (Ct value = 999) or “failed” quality control readings were removed. Cells with failed or discordant detection of spikes were excluded. Normalized Ct values of each cell were calculated by subtracting the geometric average of Ct values from spike 1 and spike 4 in the corresponding cell. An arbitrary differential cycle threshold (dCt) value of −17 was assigned for all the genes with a dCt value <−17.
Single-cell qRT-PCR data analysis
First, the data were analyzed as described by Moussy et al. 10 Briefly, the normalized single-cell quantitative gene expression data obtained for the different time points were merged in a single database and screened for subpopulations by k-means clustering. The number of statistically distinguishable groups was inferred using gap statistics. 17 The groups were visualized on heat maps and on a two-dimensional plot using t-distributed stochastic neighbor embedding (tSNE). Preprocessing (e.g., normalization, dimensional reduction) and clustering analysis were performed with R software, 18 using ggplot2, 19 k-means, Rtsne, 20 and Heatmap3 packages. 21 t-Distributed stochastic neighbor embedding (t-SNE) and gap statistics calculations were performed as described. 17 To be coherent with Fig. 1B, the t-SNE representation of Fig. 1C was flipped.

Single-cell analysis of gene expression at different time points after lentiviral transduction in the absence or presence of valproic acid (VPA).
Then, a recently developed algorithm (Clustering And Lineage Inference in Single-Cell Transcriptional Analysis [CALISTA]) was applied for the lineage progression and trajectory of the cells during the differentiation process.
22
CALISTA was performed by using the Matlab version of the algorithm (
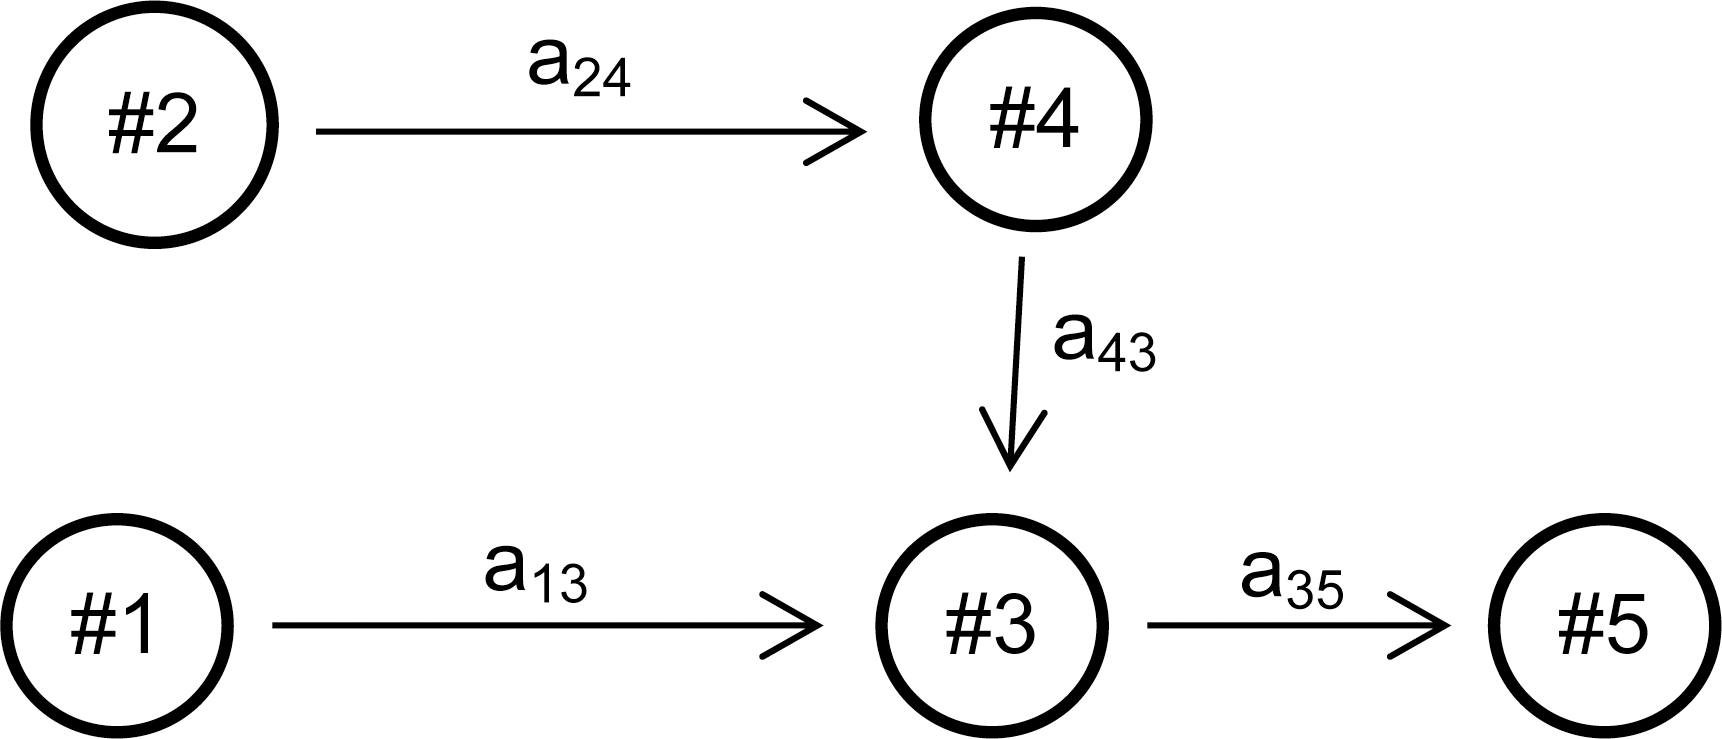
CALISTA transition edges were calculated as follows:
For the two conditions (control and LV), first Pi
(t48) and Pi
(t96), the fraction of cells in cluster i at time 48 or 96 hps, were calculated.
Example:
The mass balance equations were formulated based on CALISTA transition edges inferred previously:
Each condition, based on P Control and P LV, results in:
For control:
For LV:
Determination of vector copy numbers
Vector copy number (VCN) was calculated by real-time TaqMan PCR assay and by droplet-PCR. By real-time TaqMan PCR assay, gDNA was mixed with 1 × TaqMan Master Mix (Applied Biosystems, Foster City, CA), PCR primers (albumine-R: 5′-ACTCATGGGAGCTGCTGGTTC-3′, albumin-F: 5′-GCTGTGATCTCTTGTGGGCTGT-3′, PSI-R: 5′-TCCCCCGCTTAATACTGACG-3′, PSI-F: 5′-CAGGACTCGGCTTGCTGAAG-3′) at a final concentration of 100 nM and FAM-PSI (5′-CGCACGGCAAGAGGCGAGG-3′) and VIC-albumin (5′-CCTGTCATGCCCACACAAATCTCTCC-3′) probes at 100 nM. The real-time TaqMan PCR assays were conducted using the 7900HT Fast Real-Time PCR System (Thermo Fisher Scientific). A first step of denaturation was done at 95°C for 15 min. Then, a second step of amplification with 40 cycles was performed by denaturing cDNA at 95°C for 15 s followed by an annealing and extension at 60°C for 1 min. Data were analyzed with SDS software (v2.4.1) and normalized by the percentage of GFP+ cells.
To verify that the GFP– cells did not integrate the GFP transgene, GFP+ and GFP–cells of LV and LV + VPA conditions were sorted 7 days post transduction, and their VCN were measured by droplet-PCR. Briefly, gDNA were mixed with 2 × ddPCR Supermix for probes (Bio-Rad), PCR primers (same primers as real-time TaqQan PCR) at a final concentration of 900 nM, PCR probes (same primers as real-time Taqman PCR) at a final concentration of 250 nM, and HaeIII (Fermentas, Waltham, MA) at 2.5 IU per reaction. When the droplet generation was done by ddPCR AutoDG (Bio-Rad), the PCR was performed by using a C1000 touch thermocycler (Bio-Rad) using the following thermal cycles: 95°C for 10 min, (94°C for 30 s, 60°C for 1 min) × 40, 98°C for 10 min, and 12°C for infinite time. The fluorescence and VCN were analyzed using a QX200 Droplet Digital PCR System (Bio-Rad).
BLAM-LV fusion assay
The BLAM-LV fusion assay has been described previously. 23 Briefly, cells were pre-stimulated for 24 h with or without VPA. After 24 h, cells were transduced for 2 h 30 min with VSVG-BLAM-LV at 8 × 10⁶ μg/mL in the presence of protamine sulfate (4 μg/mL). VSVG-BLAM-LV particles contain β-lactamase (BLAM)-Vpr chimeric proteins and express a truncated form of the low-affinity nerve growth factor receptor (ΔNGFR). At 2 h 30 min post transduction, some of the cells were incubated overnight with the CCF2 substrate. The next day, the percentage of intracellular cleaved CCF2 was measured using flow cytometry (LSRII; BD Biosciences). The remaining cells were transferred to a differentiation medium for 3 days, and the percentage of transduced cells was evaluated after cell surface NGFR staining and flow cytometry analysis (LSRII; BD Biosciences).
Integration site identification
The integration site library protocol has been described previously. 24 Briefly, transduced cells (LV + VPA at 5 × 10⁷ TU/mL; MOI = 133) were cultured for 7 days in a differentiation medium, and gDNA was extracted. Then, 1 μg gDNA was digested by MseI (New England Biolabs), ligated to custom linkers, and digested by SacI (New England Biolabs). Multiple nested PCRs were done with specific primers adapted for Illumina sequencing annealing to the custom linker and the 3′ vector long terminal repeat.
Analysis of the LV integration site data
Integration sites in the LV + VPA condition were calculated, as previously described. 24 Six series of 11,984 integration sites were randomly sorted from the database of Poletti et al. 24 and were used as a control. Genes hosting at least one integration site were identified as target genes. The list of target genes from VPA-treated cells was individually compared to the six series of control genes. The difference in the number of integrated vector copies between VPA-treated cells and controls was determined in each gene. The statistical significance of the differences was calculated using Fisher's exact test. A genomic sequence between the most upstream transcription start site and the most downstream 3′ end was defined as a gene. Calculations for determining the number of integration sites per target gene were done with R using the HiAnnotation package. 25
The list of the integration sites is available on BioProject (ID PRJNA497248; VPA-treated cells).
Microgrid cell culture and time-lapse microscopy
The same protocol was adopted as described previously. 10,26 Briefly, at 30 hps, transduced (LV or LV + VPA) or non-transduced cells (control) were transferred in a specialized culture dish divided into four parts (Hi-Q4; ibidi, Munich, Germany) containing a polydimethylsiloxane microgrid array (Microsurfaces, Melbourne, Australia) of 1,024 microwells (125 μm wide, 60 μm deep). Each part of the dish was previously filled with pre-stimulation medium. A suspension of 5 × 10³ cells per case was added at a concentration likely to provide a high number of wells with a single cell. Time-lapse acquisitions were performed with the Biostation IM time-lapse microscope (Nikon Instruments Europe B.V., Amsterdam, Netherlands). Between 35 and 40 field positions were recorded, covering four microwells each. Phase contrast images were acquired around every minute for 3 days using a 20 × magnitude phase contrast objective, and GFP fluorescence images (505–550 nm bandpass filter) were taken with an interval of 24 h. Only microwells containing a single cell were considered in the analyses. These experiments were run in triplicate.
All images were analyzed using Fiji. 27 The number of transduced (GFP channel) and non-transduced cells was determined. The morphologies of only second-generation cells were analyzed. A cell counter plugin was used to identify the moment when cell switches from a round to a polarized morphology and vice versa.
Time-lapse data were analyzed using R, as previously described. 10 Cell-cycle length and switch frequency were calculated with custom-made R scripts. Wilcoxon's test was performed to calculate statistical differences between conditions.
Results
Gene expression and fate choice in LV transduced cells
To elucidate the influence of lentiviral transduction on the gene expression pattern of CD34+ cells during cell differentiation, time-course experiments were performed, as illustrated in Fig. 1A (see Methods for further details). First, CD34+ cells isolated from human cord blood were stimulated in vitro by using early-acting cytokines. The culture conditions were identical to those used in clinical settings. 28,29 At 24 hps, cells were incubated for 6 h with VSVG-LV carrying a GFP-coding transgene (Fig. 1A).
Single cells were randomly sorted for transcription profile determination at 48 and 96 hps. The transcript levels of 93 genes (same as in a previous study 10 ) were determined in individual cells using single-cell qRT-PCR. This method is highly suitable for comparing the transcription profiles of individual cells in a heterogeneous cell population. 10 The normalized data obtained for the non-transduced (control) and transduced cells (LV) were merged into a single set and analyzed using k-means clustering to identify cell subpopulations. The number of statistically meaningful groups was determined using Gap statistics. 17 The single-cell gene expression data were visualized on a 2D plot using t-SNE. 30,31
First, the transcription profile of 91 non-transduced cells and 92 transduced cells was analyzed at 48 hps. Two major cell subpopulations were identified, with only a small number of cells outside the two cell clusters (Fig. 1B). As reported earlier, the two subpopulations of cells correspond to the two known major types of hematopoietic progenitor cells. 10 Cells in one subpopulation (the multipotent subset) express marker genes associated with the multiprimed state such as CD133, GFI1, KLF4, and FLT3, whereas cells in the other subpopulation (the CMP subset) have higher expression of CMP-like marker genes such as EPOR and GATA1. 10 The gene expression level of the data is shown in the heat map in Supplementary Fig. S1. Both the control and the cells incubated with the VSVG-LV are equally represented in the two clusters (Fig. 1B).
Since the expression of GFP is a clear indication of a successful cell transduction, it was recorded while sorting the cells for transcription analysis. Of the 92 sorted cells, 33% integrated the GFP transgene. This enabled the GFP expression of these to be correlated with their transcription profile. Interestingly, almost all GFP+ cells displayed CMP-like gene expression profile (Fig. 1B, right panel; CMP subset cluster). In order to verify that GFP– cells in the LV condition did not integrate the GFP transgene, GFP+ and GFP–cells were separated with a cell sorter 7 days post transduction and analyzed for the presence of vector genomes using digital PCR (Supplementary Fig. S2). It was found that GFP–cells did not harbor any vector-derived DNA, indicating that these cells failed to integrate the viral vector in their genome. (Supplementary Fig. S2). These observations suggest that successful integration and expression of the transgene are associated with the CMP fate choice.
To investigate this point further, the cells were treated with VPA, a HDAC inhibitor (Fig. 1A; see Methods). Earlier studies showed that VPA-treated cells have increased long-term reconstituting capacity when grafted in mice. 11 –14 This is due to the capacity of VPA to generate a gene expression profile typical for uncommitted cells. 10 If the capacity of the LV to transduce cells varies, depending on the stage of fate commitment, then one would expect the transduction of the VPA-treated cells to vary compared to the non-treated cells. Therefore, the cells were cultured with 1.25 mM VPA during the pre-stimulation and lentiviral transduction, and the drug was washed out at 30 hps (Fig. 1A). The analysis of the transcription profiles in randomly sorted individual cells was done at 96 hps, leaving time for the cells to consolidate their fate choice. The single-cell quantitative gene expression data obtained for 84 control, 88 LV, and 89 LV + VPA cells were screened for subpopulations by k-means clustering, and the number of statistically meaningful groups was inferred using gap statistics. The results are represented on a 2D tSNE plot (Fig. 1C). Three clusters were identified. Two clusters out of three are characterized by transcript profiles that are similar to those seen at 48 hps (i.e., the less committed multipotent [multipotent subset] and CMP cells [CMP subset]; Fig. 1C and Supplementary Fig. S3). A third cluster (labeled as the GMP subset in Fig. 1C) of cells was also identified. The transcription profile of the cells in this group differs from the two other clusters by the lack of expression of genes that are typical for a multipotent or CMP profile (CD34, CD133, FLT3, GFI1, EPOR, GATA1, and CD71; Supplementary Fig. S3) and the high expression of known neutrophil markers, CXCR2 and CXCR4. 32 –34 These cells are presumably on the way to granulocyte–monocyte phenotype (GMP).
All three clusters at 96 hps contain cells from the control, LV, and LV + VPA groups, demonstrating that neither the VPA treatment nor the LV transduction induces new cellular phenotypes and the overall process of fate commitment follows a similar path as in the untreated control cells (Fig. 1C). However, upon examining the distribution of GFP-expressing cells among the groups (35% of LV and 98% of LV + VPA groups sorted are GFP+), substantial differences were found. Likewise, at the 48 hps time point, GFP+ cells from the LV group are almost exclusively characterized by a CMP-like gene expression profile (Fig. 1C). In contrast, at 96 hps, almost 100% of the cells treated with VPA (LV + VPA) expressed GFP at a high level, and these cells are distributed equally across all three clusters (Fig. 1C). This is a clear indication that VPA increases the transduction efficiency.
To investigate the lineage progression and trajectory of the cells during the differentiation process further, a recently developed algorithm, CALISTA, was applied to the expression data. 22 Briefly, CALISTA is a likelihood-based approach for cell clustering, lineage inference, and pseudo-time cell ordering. 22 The data sampled under the three experimental conditions (control, LV, and LV + VPA) and at the two sampling time points (48 and 96 hps) were analyzed together. The optimal number of clusters was detected based on the eigengap heuristics. 22 Consistent with the previous clustering analysis computed with k-means (Fig. 1), CALISTA also identified five cell clusters: clusters #1 and #2 in an early stage mostly (but not exclusively) composed of cells at 48 hps, and clusters #3, #4, and #5 in a late stage of differentiation with a majority of cells at 96 hps (Fig. 2A and Supplementary Fig. S4).
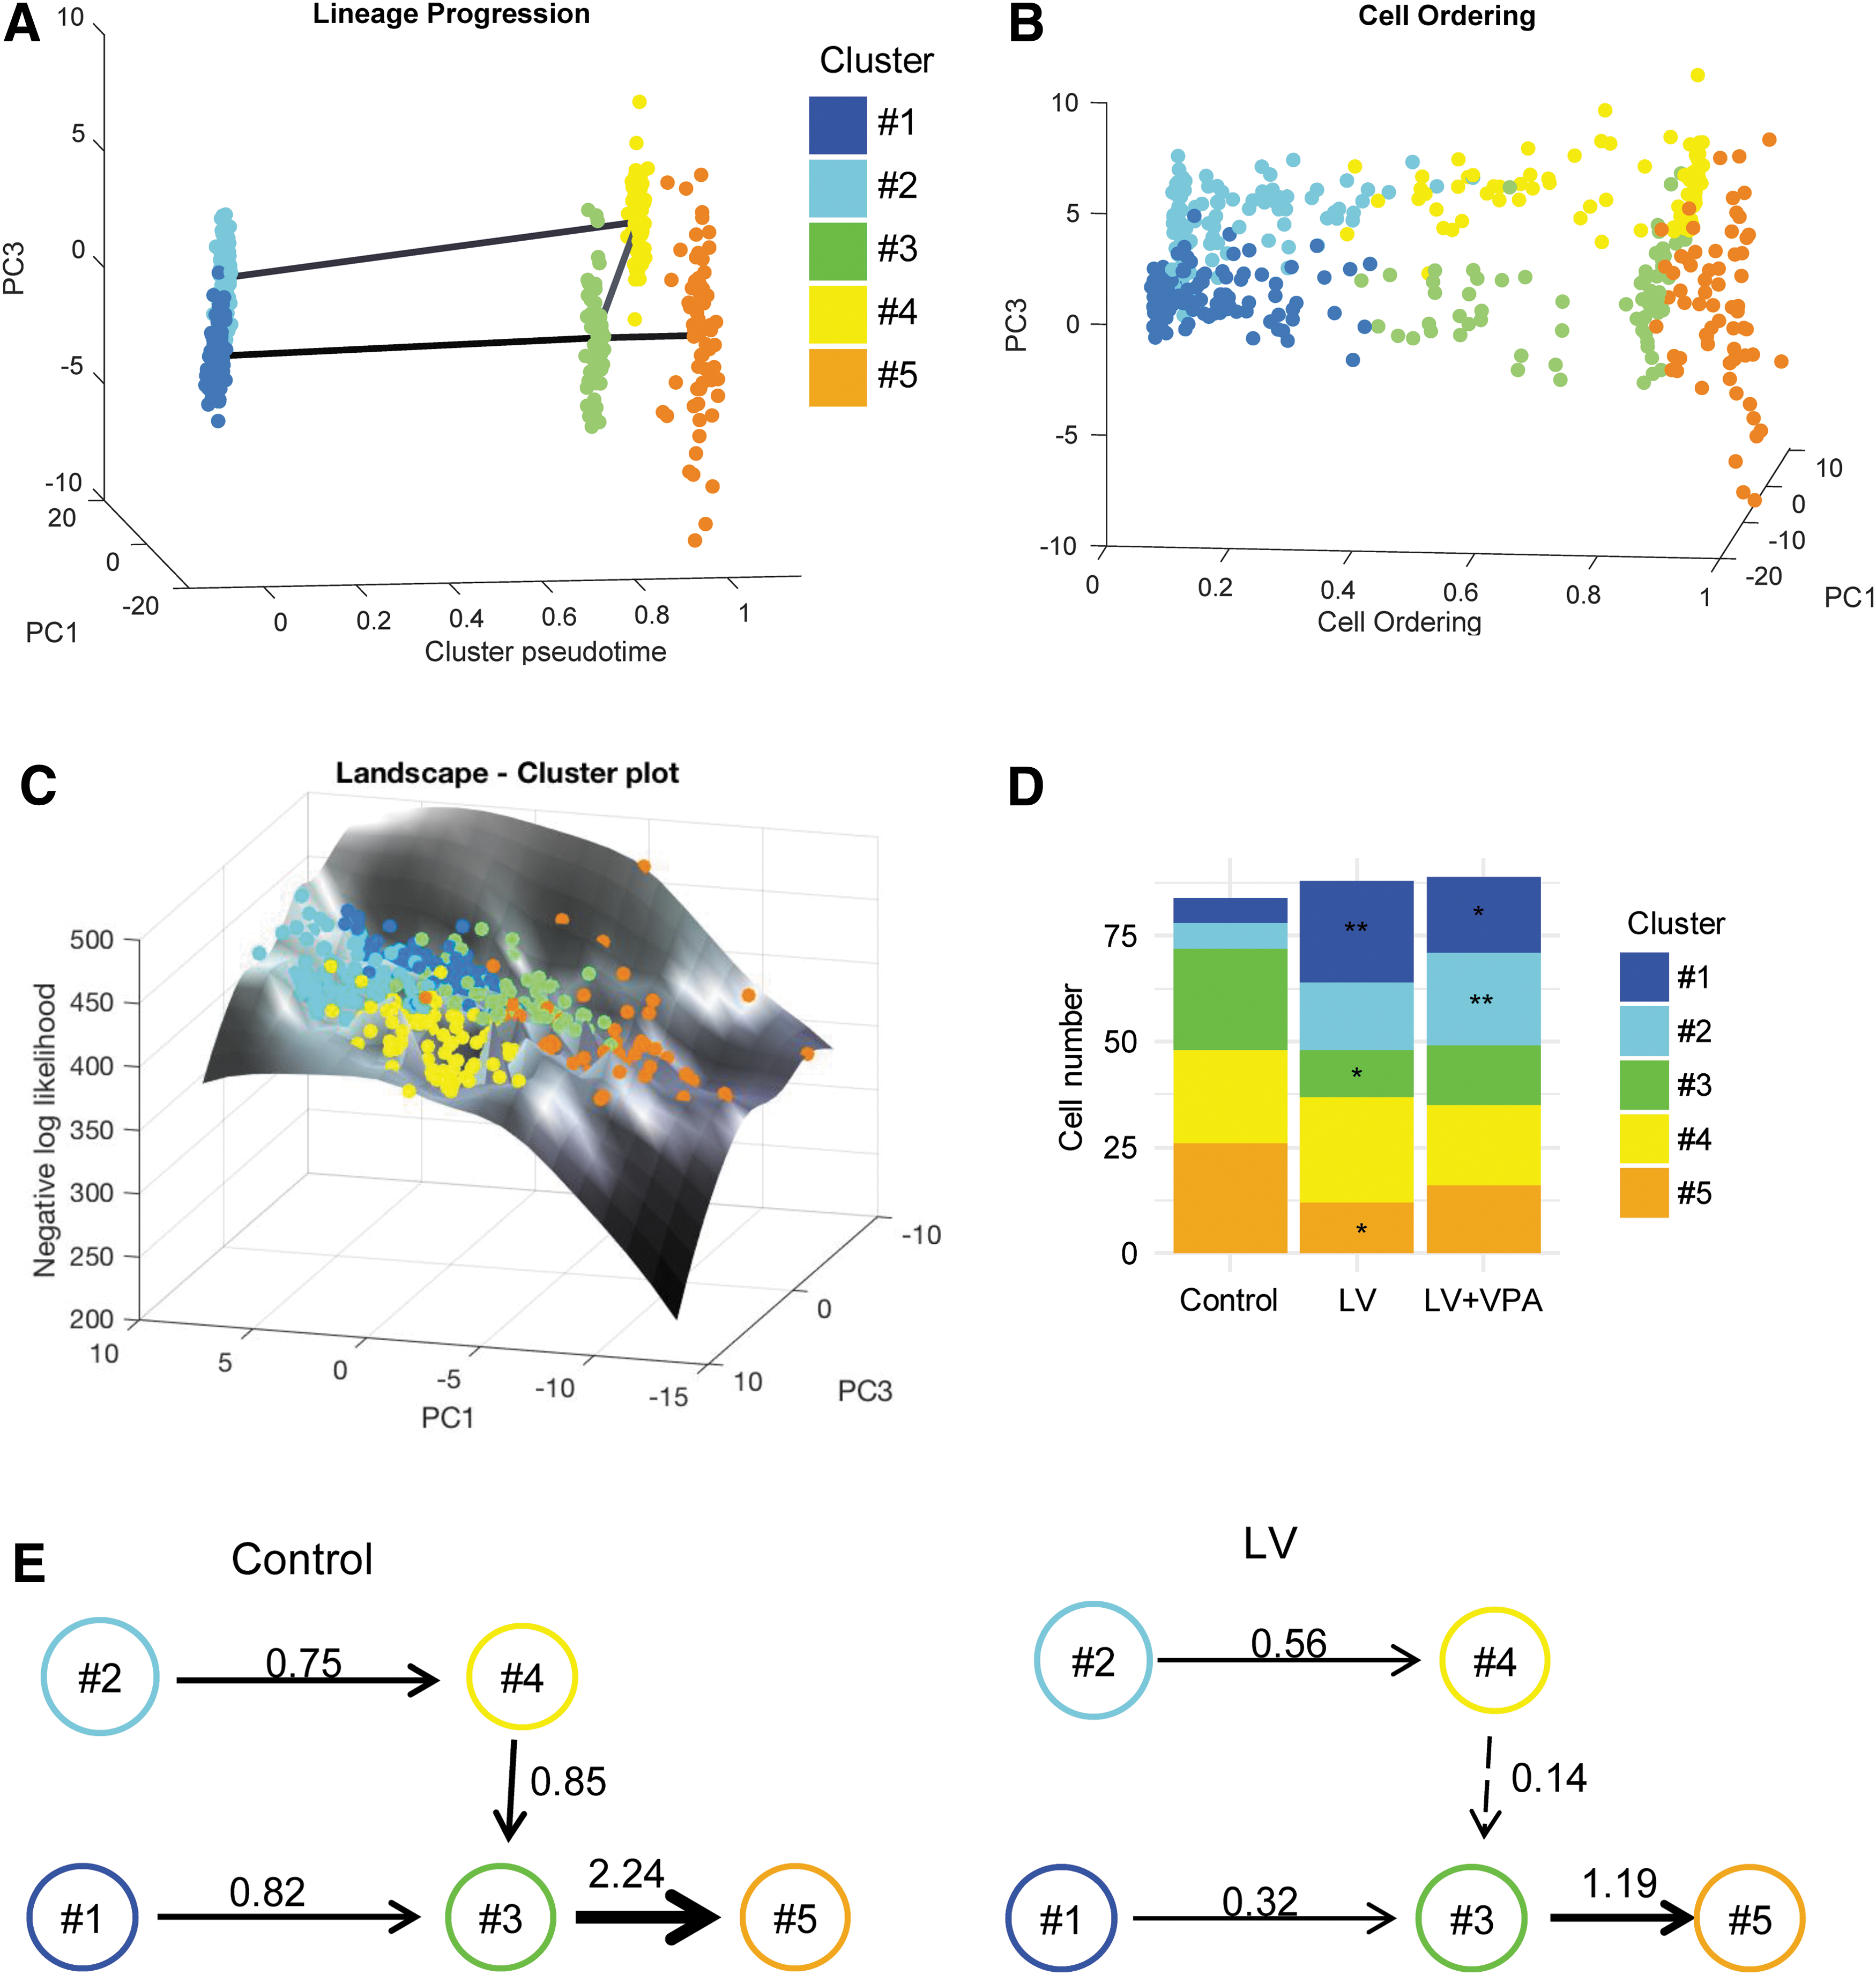
Clustering And Lineage Inference in Single-Cell Transcriptional Analysis (CALISTA) analysis of single-cell gene expression data sampled at 48 and 96 hps considering all three experimental conditions: controls (non-transduced cells), LV (transduced cells), and LV + VPA (transduced cells cultured with VPA).
Then, CALISTA inferred the lineage relationships among the predicted states, assuming that state transitions more likely occur between similar clusters. For this purpose, CALISTA calculated the cluster distances between each pair of clusters and built the lineage relationships by sequentially adding “transition” edges in increasing magnitude of cluster distances. 22 The inferred connected progression graph is depicted in Fig. 2A. Finally, CALISTA ordered cells along the reconstructed lineage by maximizing the cell likelihood values based on their gene expression (Fig. 2B). The cell likelihood is a characterization of the uncertainty in the gene expression distribution of the cell subpopulation (cluster) to which the cell belongs. CALISTA generated a cell likelihood surface over the first two principal components of the single-cell gene expression, resembling the Waddington's epigenetic landscape (Fig. 2C). 22,35 This cell likelihood landscape plot provides a visual representation not only of the fate commitment process as a “flow,” but also of the “cellular journey” along the differentiation paths from a more uncertain state toward a more certain state. Such a plot also illustrates the high cellular heterogeneity in the differentiation process.
The cluster composition was further evaluated based on the contribution of control, LV, and LV + VPA cells. Results showed an unequal distribution among the clusters (Fig. 2D). More specifically, clusters #1 and #2 mainly included LV transduced cells at 96 hps, whereas clusters #3, #4, and #5 were mostly composed of control cells sampled at 96 hps (Fig. 2D). The unequal distribution of the control and LV cells suggests that the treatment may impact the kinetics of the cell progression process. In order to quantify this effect, the cell population balance equations were formulated based on CALISTA transition edges among the clusters inferred previously, and the transition rates between the clusters were calculated (see Methods; Fig. 2E). The results indicate that the rates of progression of the LV-treated cells are much slower than those of controls (Fig. 2E). The cells treated with VPA prior and during transduction were sampled only at 96 hps, so it was not possible to calculate the transition rates.
The emerging picture from the single-cell gene expression studies is that LV transduction delays the progression of the cells toward a committed state. The cells that express GFP protein are preferentially oriented toward the CMP lineage. Conversely, VPA treatment prior and during the transduction increases the efficiency of transduction and yields almost 100% of GFP-expressing cells (Fig. 1C).
Dynamic phenotype of the LV transduced and VPA-treated cells is different
The fate commitment in the CD34+ cells is a highly dynamic and continuous process, which occurs during the first few cell cycles after cytokine stimulation. 10,36,37 CD34+ cells display at least three different dynamic phenotypes: stable round, stable polarized, and “hesitant,” characterized by frequent switches between a polarized and round morphologies 10 (Fig. 3A). To test whether and how both lentiviral transduction and VPA treatment reshape the dynamics of CD34+ cells, time-lapse records were performed. Briefly, cells were cytokine stimulated (at 0 hps) and transduced (at 24 hps; see Methods). Then, individual cells were placed in microwells and were imaged at a frequency of 1 image/1.7 min for 72 h following the protocol described in Moussy et al. 10
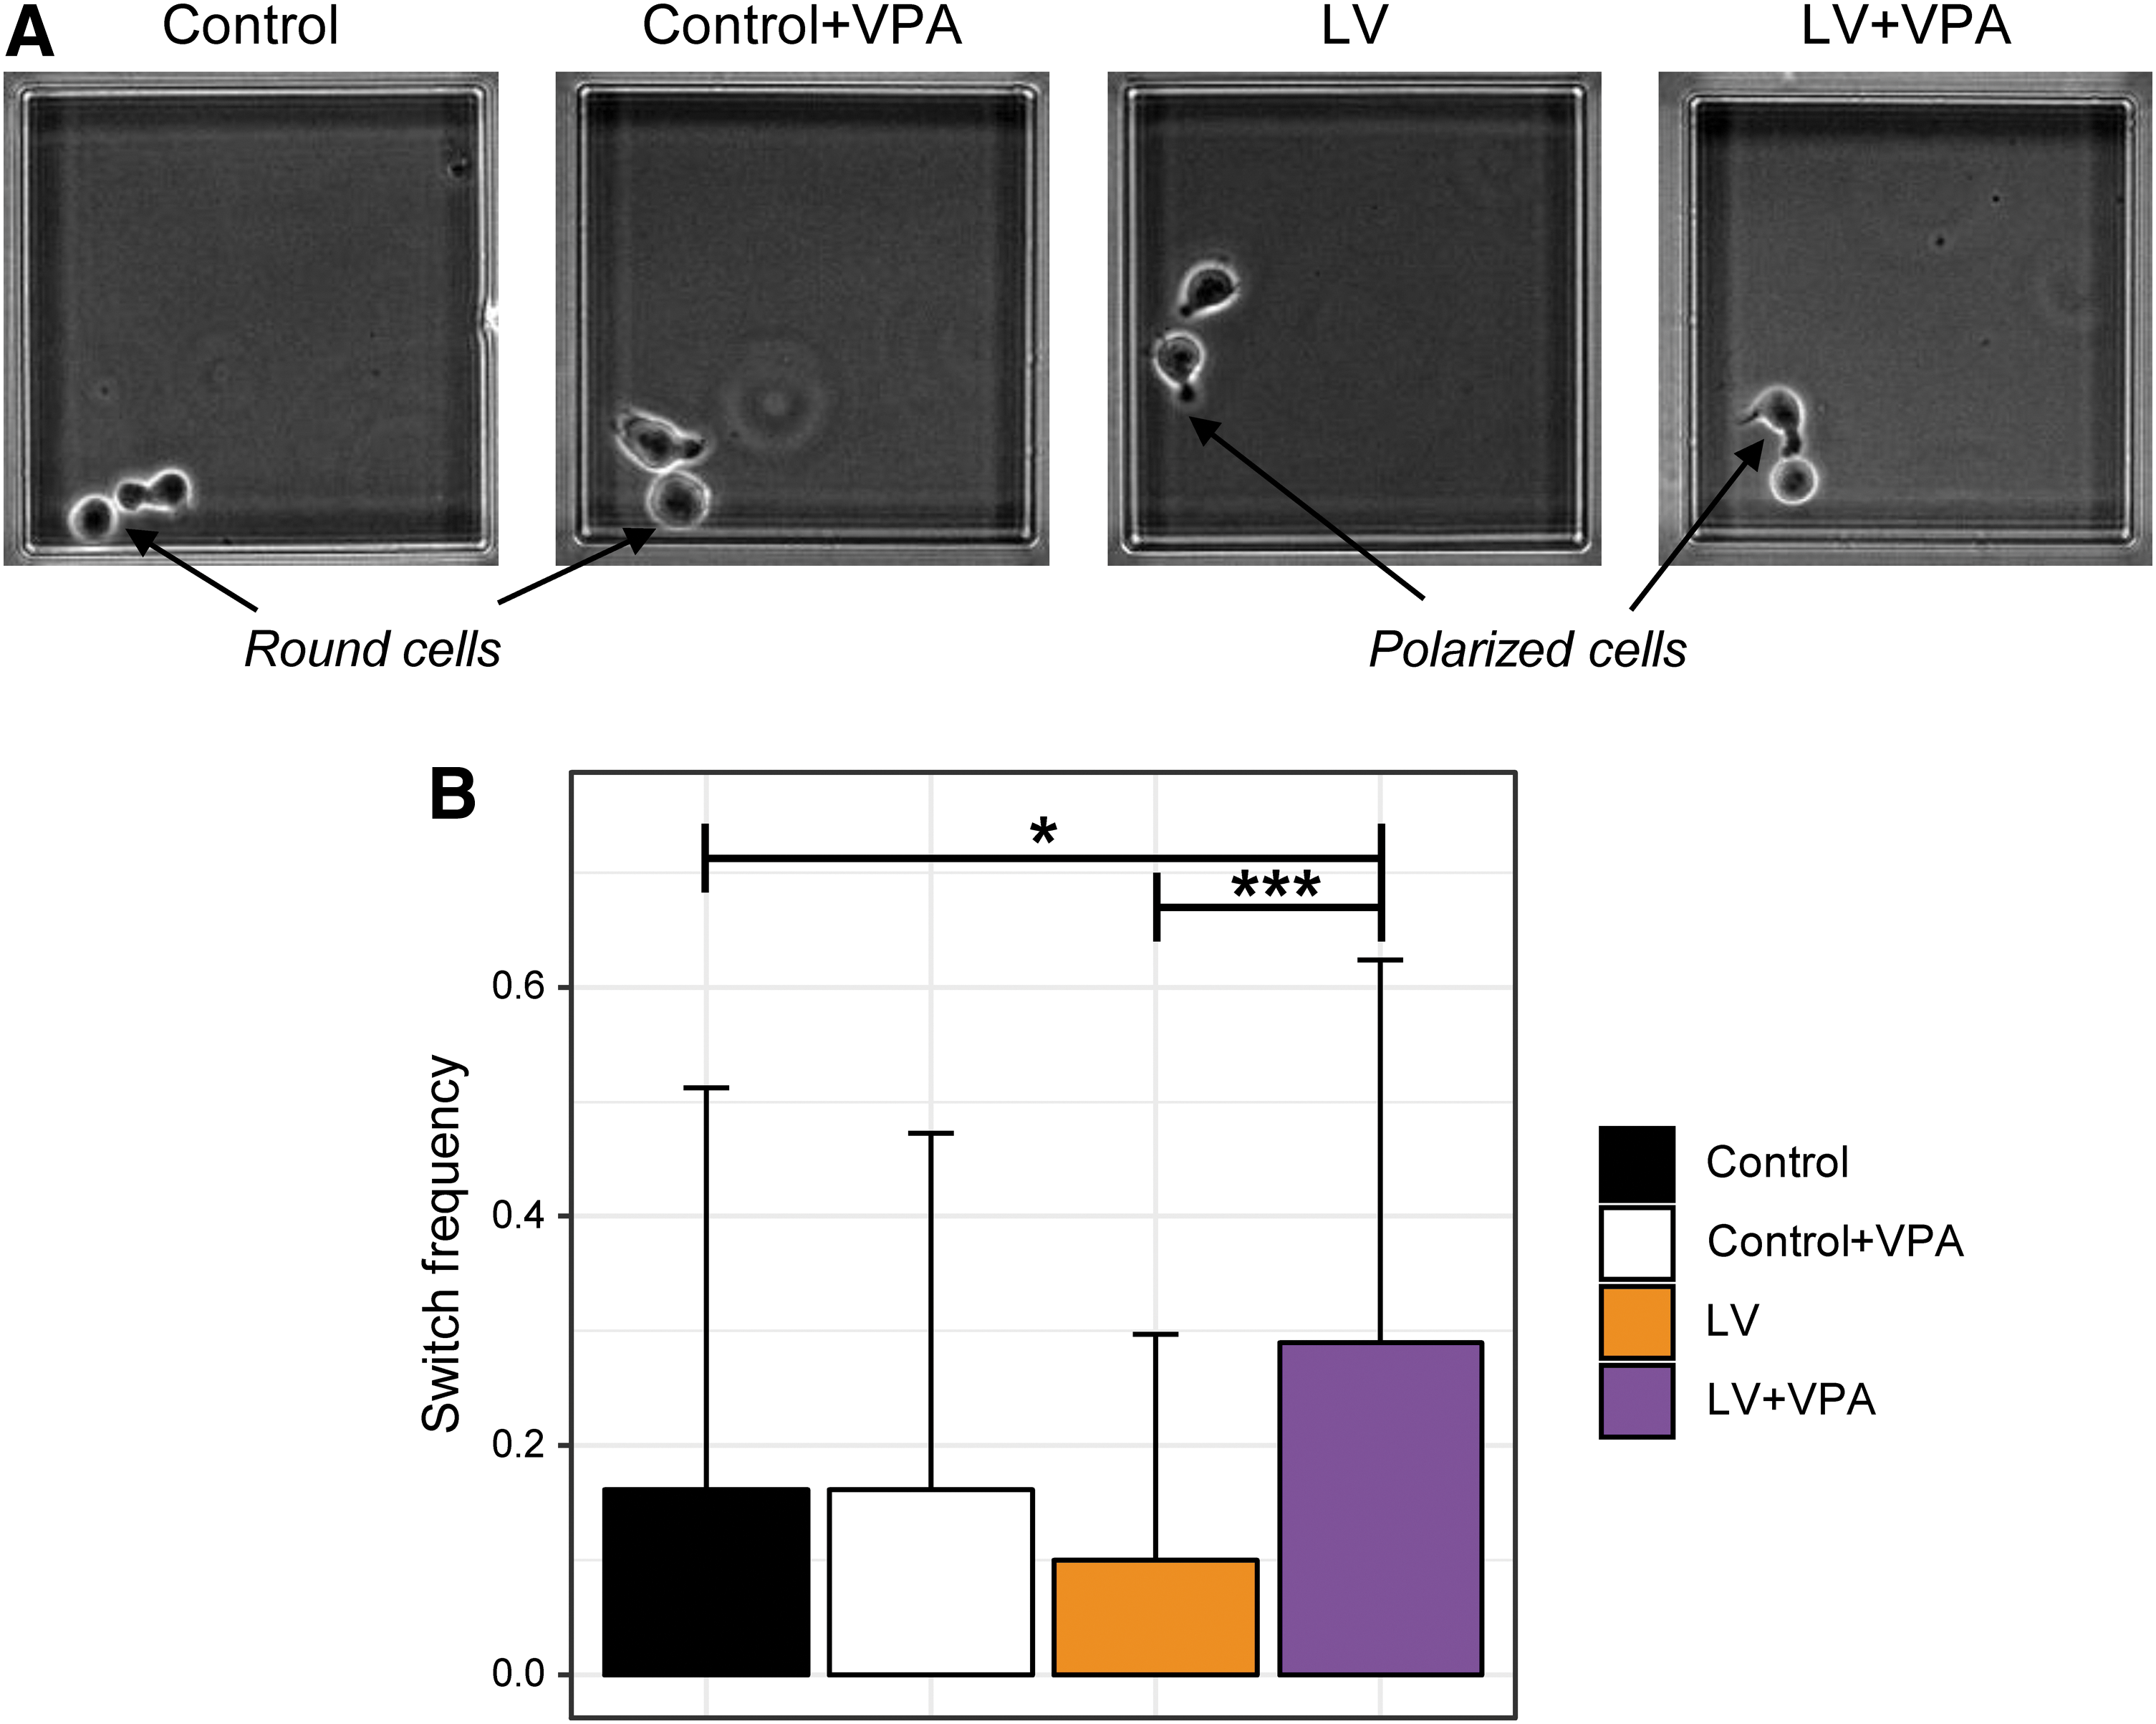
Time-lapse observations of the CD34+ cells between 30 and 96 hps.
Based on the records, the length of the cell cycles, the ratio of the time spent as round and polarized, and the frequency of the switches between the two morphologies were calculated. Only second-generation cells were analyzed. No differences in the cell-cycle length were observed between control, control + VPA, LV, and LV + VPA conditions (not shown). However, the frequency by which the cells fluctuated between the two morphologies was significantly higher in the LV + VPA condition (Fig. 3B). This increase reflects the effect of the VPA to generate a cell state with uncertain commitment. 10 No effect of LV on cellular dynamic behavior was observed.
Vector genome integration
As indicated earlier, VPA treatment resulted in a substantial increase in the proportion of GFP-expressing cells. The study investigated how the effect of VPA is related to the cellular entry of the vector particles. VPA alone significantly increased the fraction of GFP-expressing cells. The same increase can be observed if VPA is used with the additives protamine sulfate or vectofusin-1, which are known to enhance the rate of viral vector entry 38,39 (Fig. 4A).

Effect of VPA on lentiviral transduction.
VPA has a cumulative effect with either protamine sulfate or vectofusin-1. With vectofusin-1, the proportion of GFP+ cells reached 100% (Fig. 4A). This raised the question of whether VPA improves the cellular entry of the vector particle, like vectofusin-1 or protamine sulfate, or enhances the capacity of the vector DNA to integrate into the host cellular genome. It is possible to monitor the efficiency of LV entry and LV integration separately and concomitantly using the BLAM-LV assay. 23 This test showed that VPA has no significant effect on the entry of the viral particles into the cell but doubles the number of cells expressing the transgene (Fig. 4B). Therefore, the increased number of LV transduced cells in the VPA-treated condition is due to an improvement in the post-entry events.
Next, the average number of integrated vector genomes in cells transduced in the presence or absence of VPA was determined. qPCR was used on the DNA extracted from the bulk population and normalized by the percentage of GFP+ cells. No significant increase in VCN was found in the cells transduced in the presence of VPA (Fig. 4C). In order to ensure that GFP– cells did not carry integrated vector genome copies in transduced cells, GFP+ and GFP– cells were isolated by cytometry 7 days after transduction. The average copy number of the integrated vector genomes was analyzed using digital PCR. Only GFP+ cells contained integrated vector genomes in both control and VPA-treated cells (Supplementary Fig. S2).
VPA is a well-known HDAC inhibitor that affects chromatin structure. 40 Vector genome integration occurs through interaction with the host cellular chromatin. 41 The study therefore investigated whether treating cells with VPA before and during transduction can modify the distribution of the vector DNA integration sites. The distribution of 11,984 integration sites identified in VPA-pretreated cells compared to an identical number of sites from control cells revealed no significant differences (Fig. 4D and Supplementary Fig. S5). The numbers of integration per gene were compared (Fig. 4D). The list of most targeted genes was very similar in VPA-treated and control cells (Supplementary Table S1).
Discussion
The observations presented here draw attention to several important fundamental and practical aspects of HSC biology. This study was prompted by the observations showing systematic DNA methylation changes of the host cellular genome after lentiviral transduction. 8,9 It was therefore logical to investigate if LV transduction also impacts the pattern of gene expression of the cells. Since population-level analysis is not suited to detect pattern changes in a heterogeneous population, single-cell analysis was used. On the basis of previous work, the CD34+ cells isolated from human cord blood were analyzed at two different time points after lentiviral transduction. 10 At 48 hps, single-cell transcription profiling is able to distinguish two different subpopulations expressing genes representative of either CMP- or multipotent-like cells. As expected, the same two subpopulations were found in both the control and LV-treated cells. Hence, the CD34+ cells were able to initiate their phenotypic transition, and LV had no impact on the gene expression profile. However, LV seems to slow down the progression of the cells along the fate commitment pathway. The multiparametric analysis of the single-cell transcription data using a novel algorithm, CALISTA, showed that the transition rates between the successive stages were lower in cells that were in contact with LV (Fig. 2E). How LV can slow down the process of fate commitment remains unknown. Nevertheless, this is a new sign indicating that the vector–cell crosstalk is more complex than previously thought.
When the efficiency of the gene transfer was examined, it was found that the successfully transduced cells carrying vector genomes and expressing the GFP transgene displayed almost exclusively a CMP gene expression profile. One possible explanation would be that LV is preferentially integrated into cells destined to form CMPs. However, CD34+ cells first encounter the vector at 24 hps while they still display a multilineage-primed gene expression profile without signs of commitment to any lineage. 10 Therefore, the LV infection precedes the specification of the two committed populations and hence cannot be its consequence. A most likely explanation is that while almost every cell encounters and can internalize the LV particles, only those that commit to CMP are permissive to integrate the vector genome and express the transgene with higher efficiency.
VPA is known to act on CD34+ cells by generating a multipotent undetermined state with high engrafting potential. 11 –14 The study investigated if VPA can impact LV transduction. It was found that VPA increases the efficiency of the vector genome integration and expression. This effect is independent of the vector entry into the cells. Moreover, VPA not only increases the permissiveness toward LV, but transduced cells can undergo normal fate commitment. These effects can be explained by the action of VPA as a HDAC inhibitor. By making the chromatin more accessible, VPA increases the efficiency of post-entry mechanisms such as integration and transgene expression, resulting in a higher fraction of GFP-expressing cells and a slightly higher number of integrated vector genomes. VPA is known to maintain cells in a multilineage-primed state and to delay the fate specification in CD34+ cells. 10
The present observations have potentially important practical implications. Significant improvements of LV gene delivery process can be obtained based on two crucial points. First, a common limiting factor in all applications using LV is the low efficiency of the lentiviral gene delivery to HSCs. 6 The observations reported here show that the culture of the freshly stimulated CD34+ cells with VPA allows 100% of transduced cells to be reached in a single round of transduction lasting only 6 h. Therefore, both the time of ex vivo manipulation of the cells and the amount of vectors used can be reduced. This spectacular effect is presumably achieved by removing the intrinsic barriers known to decrease lentiviral transduction in hematopoietic stem and progenitor cells, 6 but the exact mechanism of action remains to be elucidated. As a HDAC inhibitor, VPA makes the host genome more accessible to transcription factors, RNA polymerases, and other proteins. By this action, it relieves the constraining effect of LV on cell fate commitment and makes possible the efficient genomic integration and expression of the transgene into the genome.
The second improvement may come from the effect of VPA on the CD34+ cells. Although not tested in this study, VPA is known to improve the engraftment capacity of CD34+ cells. 11 –14 If this also turns out to be true with the LV transduction setting used in this study, then the benefit of using VPA will be even more significant. It would improve the permissiveness toward the vectors and the grafting potential of human HSC without altering the lentiviral integration profile.
Footnotes
Acknowledgments
The study was funded by an ANR research grant SinCity (no. ANR-17-CE12-0031-02), Ecole Pratique des Hautes Etudes (no. 11REC/BIMO), and Genethon and INSERM UMR_S951. Equipment funds were from Genopole Research-Evry, University Evry Val d'Essonne, Conseil General de l'Essonne, and Region Ile de France.
The authors are grateful to Peggy Sanatine and Simon Jimenez (Imaging-Cytometry Platform of Genethon) for the precious help with cell sorting, to Khalil Seye for the VSVG-LV production, and to Nadège Brunel-Meunier for her help in the use of Biomark HD System (FluExGen Platform of Saint Antoine Hospital, Paris, France). The authors are also grateful to Anne Galy for the internal UCB samples management and to the mothers and staff of the Centre Hospitalier Sud Francilien (Evry, France) for UCB sampling.
Author Disclosure
The authors declare no conflicts of interest.
Supplementary Material
Supplementary Figure S1
Supplementary Figure S2
Supplementary Figure S3
Supplementary Figure S4
Supplementary Figure S5
Supplementary Table S1
References
Supplementary Material
Please find the following supplemental material available below.
For Open Access articles published under a Creative Commons License, all supplemental material carries the same license as the article it is associated with.
For non-Open Access articles published, all supplemental material carries a non-exclusive license, and permission requests for re-use of supplemental material or any part of supplemental material shall be sent directly to the copyright owner as specified in the copyright notice associated with the article.