
Abstract
We have evaluated the retinal morphological changes in normal C57BL6/J mice and a retinal degenerative disease (rd12 mice) model using scanning electron microscopy. A method of sample preparation for electron microscopy was developed and the cryosectioned retina was used to study the retinal thickness. Our data demonstrate variation in the neural retina texture between rd12 mice and C57BL6/J mice.
Introduction
Preclinical evaluation of gene therapy for Leber congenital amaurosis type 2 has largely relied on the use of rd12 mice, which recapitulates several anatomical and phenotypic characteristics of the human disease. 1,2 Although the success of the therapeutic intervention in this model is measured by several endpoint assays (e.g., electroretinogram analysis), there is lack of adequate information on the neural layer architecture after gene therapy. Spectral domain ocular coherence tomography has been commonly used to study the retinal thickness of the posterior segment of murine retina such as that of C57BL/6J mice (∼210 ± 1.09 μm). 3 Although this is an excellent method for noninvasive data acquisition, the requirement of a dedicated equipment and its low resolution in capturing the ultrastructure and the texture of the retina necessitate the availability of a simple technique to measure retinal thickness in murine models. Thus, we have utilized high-resolution scanning electron microscopy (SEM) to investigate the retinal architecture in rd12 mice in comparison with that of normal mice.
Methods
Eyeballs from 3- to 5-month-old C57BL6/J and rd12 (B6(A)-Rpe65rd12 /J; The Jackson Laboratory, Bar Harbor, Maine) mice (n = 4 eyes/group) were collected by enucleation and fixed in 4% paraformaldehyde for 30 min. 4 Fixed eyeballs were dehydrated using a sucrose gradient (10%, 20%) for 30 min each at 4°C and a final dehydration in 30% sucrose solution overnight at 4°C. The dehydrated eyeballs were later embedded in polyfreeze medium (Sigma Aldrich, St. Louis, MO) and serial cryosections of 10 μm thickness were collected in glass coverslips. The retinal sections were further washed with phosphate-buffered saline to remove the optimal cutting temperature compound (Polyfreeze) and dried in room temperature. The dried sections were gold coated for 90 s in a gold sputter coating unit (JEC 3000; JEOL, Peabody, MA) and imaged in a field-emission scanning electron microscope (Nova nanoSEM 450, FEI; Thermo Fisher Scientific, Waltham, MA). Statistical comparison between the images acquired from C57BL6/J and rd12 mice groups was performed with GraphPad Prism software (GraphPad, La Jolla, CA) by student's t-test. A p-value <0.05 was considered to be statistically significant.
Results and Discussion
SEM imaging of murine retina captured the retinal layer cross-section morphology and further differentiation between retinal architecture was possible by this method. Figure 1 shows the retinal architecture of a 3-month-old rd12 mouse. To further quantify the variations in retinal thickness between C57BL6J and rd12 mice (Supplementary Figs. S1 and S2), we measured the total retinal thickness (TRT) of the sections from inferior, nasal, temporal and superior retina. The mean TRT was computed from 36 data points for each murine eye from three sections (four images per section were taken and three TRT measurements per image were made) for a total of four eyes per group. This analysis demonstrated that the mean TRT measurements between the C57BL6/J and rd12 mice were significantly different by SEM analysis. The mean TRT values were 200 ± 14 μm in C57BL6/J mice and 151 ± 6 μm (p < 0.05) in rd12 mice at 3 months of age. Similarly, in 5-month-old C57BL6/J and rd12 mice, the mean TRT values were 191 ± 14 and 155 ± 23 μm (p < 0.05), respectively. Our data confirm previous findings 5 that a time point between 3 and 5 months of age is ideal to test retinal gene delivery into the rd12 mice. Further SEM analysis of murine retina is a simple yet sensitive approach to visualize not only retinal degeneration but also to capture the morphology of individual cells within the neural retina. Thus, this method should be a valuable tool to follow up the efficacy of novel gene or cell therapy strategies tested in rd12 mice, to document their impact at a cellular level (e.g., retinal pigmental epithelial cells), and to enable accurate depiction of morphological and phenotypic reconstitution, if any, of the neural retina after an intervention.
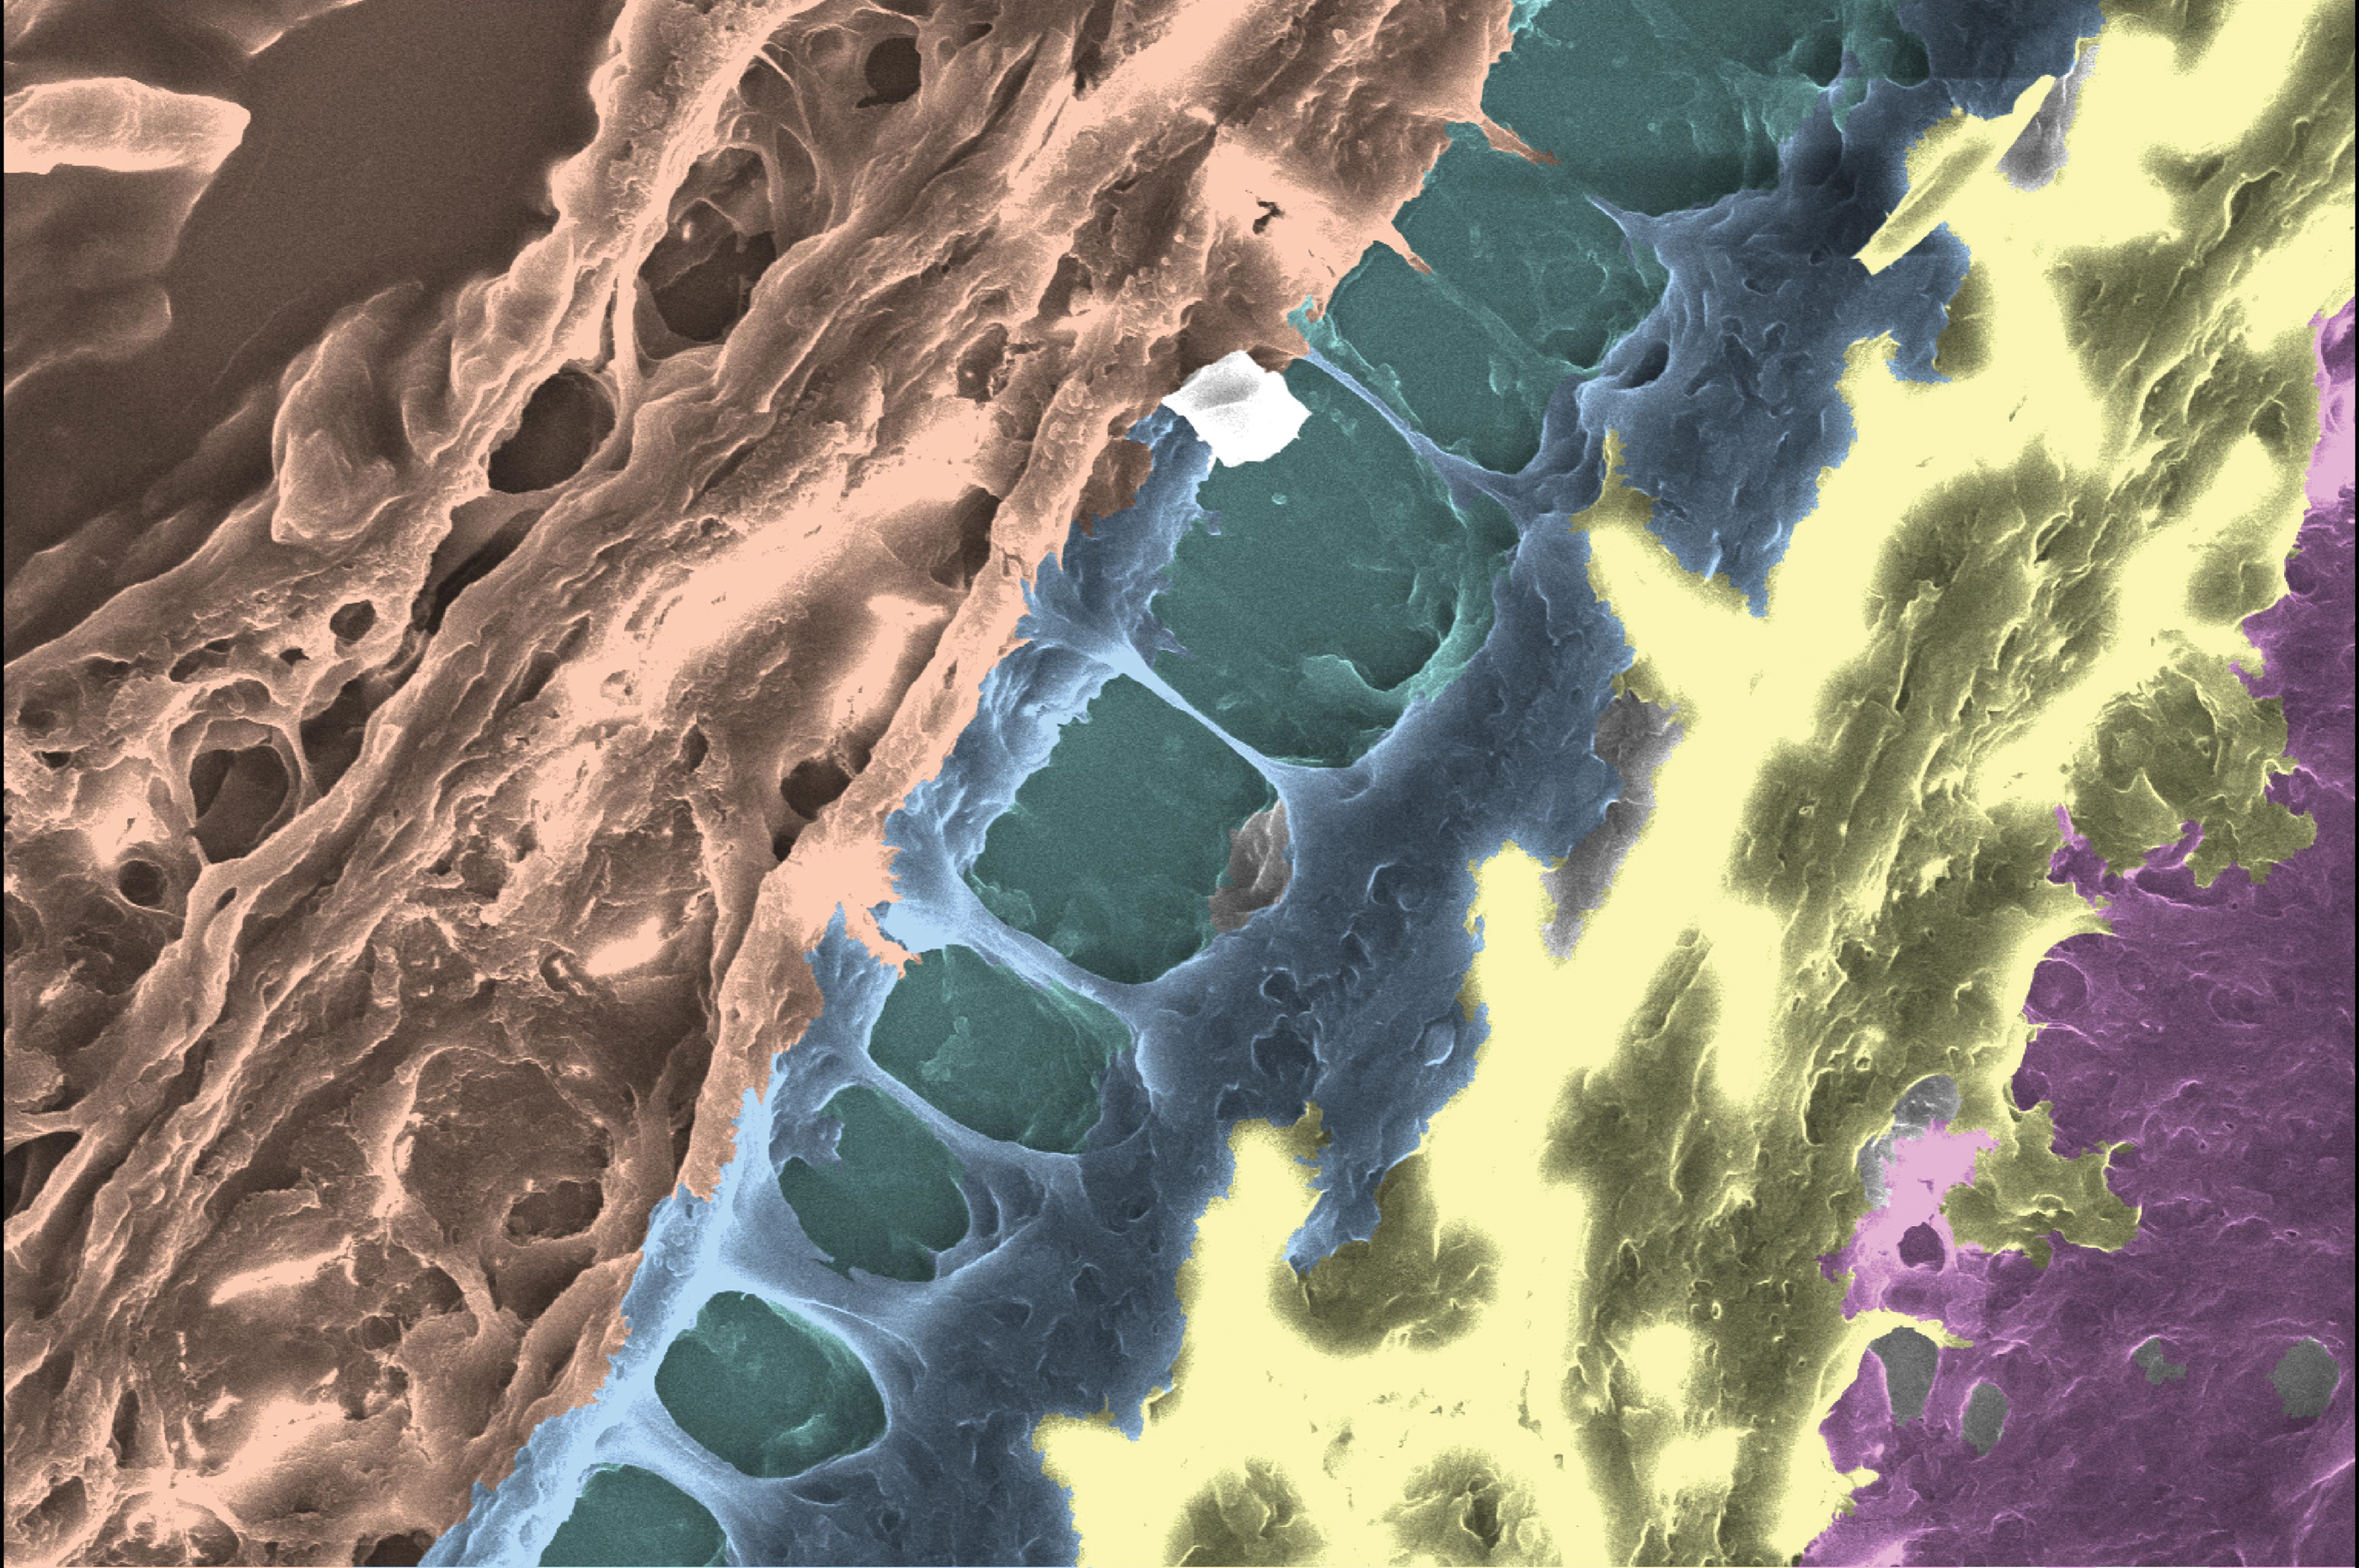
Retinal architecture of rd12 mice. Pseudocolored SEM image of rd12 mice retina (3 months old) at 2,000 × magnification showing degeneration in the outer segments. Colorization of the SEM image was done by MountainsMap® SEM software. The original image is presented in Supplementary Fig. S1B and the scale bars were derived in comparison with the original image. SEM, scanning electron microscopy.
Footnotes
Acknowledgments
G.R.J. is supported by a research grant from Wellcome Trust DBT India Alliance fellowship and an initiation grant (2014-256) from IIT Kanpur. B.M. is supported by a Ministry of Human Resource and Development PhD fellowship. We thank Dr. Sankalp Verma and Dr. Vivek Verma, Material Science and Engineering Department, IIT Kanpur, for help in SEM analyses.
Author Disclosure
No competing financial interests exist.
Supplementary Material
Supplementary Figure S1
Supplementary Figure S2
References
Supplementary Material
Please find the following supplemental material available below.
For Open Access articles published under a Creative Commons License, all supplemental material carries the same license as the article it is associated with.
For non-Open Access articles published, all supplemental material carries a non-exclusive license, and permission requests for re-use of supplemental material or any part of supplemental material shall be sent directly to the copyright owner as specified in the copyright notice associated with the article.