
Abstract
Accumulating evidence indicates that the onset of myocardial infarction (MI) shows obvious circadian rhythmicity. Clinical studies have shown that MIs that occur in the early morning have a poor prognosis, but the mechanisms involved are still unknown. In this study, we showed that the expression level of Period 2 (per2) in the heart of mice is lower in the early morning than at noon and that increasing the expression of per2 in H9C2 cells and rat cardiomyocytes increases autophagy levels. Further studies indicated that overexpression of per2 after an MI improved cardiac function by increasing autophagy. In summary, this study has shown that the circadian clock protein, per2, may be a regulator of MI.
Introduction
Myocardial infarction (MI) is the most prevalent endpoint of cardiovascular disease. It is a leading cause of morbidity and mortality worldwide. 1 After an MI, insufficient oxygen and blood supply to the myocardium caused by acute and persistent occlusion of the coronary artery leads to ischemic/hypoxic injury in cardiomyocytes. It has been reported that long-term hypoxia can induce various harmful effects, including myocardium hypertrophy, 2 apoptosis, 3 and necrosis. 4 Thus, preventing cardiomyocyte apoptosis and necrosis is an important challenge in the treatment of MI.
The circadian clock is a prominent mechanism that affects mammalian physiological processes and diseases. All body clocks are under the control of a light-sensitive master oscillator in the suprachiasmatic nucleus of the hypothalamus. 5 The clock is important for synchronization of different processes inside organisms in response to a periodic, 24-h light/24-h dark environmental cycle. Cardiovascular clinical events, such as myocardial ischemia, 6 –8 frequently follow a circadian pattern with a peak incidence in the morning. Significant circadian oscillations in infarct size have also been found in patients according to the time of day of onset of an ST-segment elevation MI (STEMI). The infarct size of an STEMI with onset during the dark-to-light transition period (6:00–noon) was found to be significantly larger. 9 However, the mechanisms behind these phenomena are not clear. In recent years, more attention has been paid to the abnormal expression of circadian rhythm genes in diseases. Period 2 (per2), as a member of circadian rhythm genes, has been shown to play an important role in cardiovascular diseases. Studies have shown that per2 downregulation decreased autophagy levels in fibroblast cells. 10 However, there have been no studies about per2 and myocardial autophagy in the MI model.
Autophagy has been demonstrated to play physiological and pathophysiological roles in many kinds of cells and tissues. In eukaryotic cells, the autophagy process involves the formation of autophagosomes, which then fuse with the lysosome, the principal organelle for bulk degradation. Autophagy is a complex process that involves multiple factors. In mammals, LC3B-I is conjugated with phosphotidylethanolamine, forming LC3B-II and resulting in maturation of autophagosomes. Autophagy-related genes (Atg) are a family of genes that correlate with each other to regulate the process of autophagy. Atg5 is important to form autophagosome by promoting the lipidation of LC3. Beclin 1 is a protein recognized as being necessary for initiation of autophagy. The AMPK pathway was shown to positively regulate autophagy-dependent mitochondrial homeostasis in embryonic stem cells, contributing to stemness properties. 11
Under physiological conditions, autophagy plays essential roles in maintaining intracellular homeostasis by removing damaged or excess organelles and protein aggregates and preserving cardiomyocyte function and survival. 12 Autophagy dysregulation is associated with a number of cardiac diseases, including cardiomyopathy, 13 ischemic heart disease, 14 and heart failure. 15 –17 There are some controversial studies regarding the role of autophagy and the interaction between autophagy and apoptosis in cell survival during MI. We aimed to investigate the effects of per2 on hypoxia-induced apoptosis and autophagy and the mechanisms underlying these effects in an in vitro model and MI-induced chronic ischemia in vivo.
Materials and Methods
Animal model and experimental protocol
A total of 36, ten-week-old, healthy, male C57BL/6 mice were obtained from Beijing Vital River Laboratory Animal Technology Center. MI was produced by ligation of the coronary artery. There were 12 mice in each group. The mice were anesthetized by intraperitoneal injection of pentobarbital sodium (50 mg/kg) and mechanically ventilated with a respirator (Inspira ASVP, HARVARD). Then, left thoracotomy and pericardiotomy were performed. The left anterior descending coronary artery was ligated with a 7-0 silk suture 2–3 mm away from the left atrial appendage. After that 6 × 10⁸ (10 μL) pfu of adenovirus-per2 (ADV-per2) was injected into the myocardium around the ligation area (above, below, left, and down), and each area was injected with 2.5 μL. For the green fluorescent protein (GFP) group, the ADV-GFP was injected into the ligation area. Sham-operated mice underwent the same surgery without coronary artery ligation. The mice were sacrificed 4 weeks after the echocardiographic measurements. The procedures were in accordance with institutional guidelines and approved by the Animal Care and Use Committee of Shandong University.
Echocardiography
The M-mode echocardiograms were conducted before surgery and 4 weeks after surgery to assess the left ventricular dimension and function, using a 30-MHz linear array transducer with a digital ultrasound system (MS400, Vevo 2100; Visual Sonics). All measures were averaged over three cardiac cycles, and the reader was blinded to the treatment group.
Myocardial infarct size
After cardiac echocardiography, the mouse hearts were harvested at 7:00–9:00 h in the morning. The infarct size was determined by Masson trichrome staining. Tissue sections were fixed in 4% paraformaldehyde and embedded in paraffin. The collagen fibers were stained blue, nuclei were stained black, and the cytoplasm was stained red.
Immunohistochemistry
The paraffin-embedded sections, 5 μm thick, were deparaffinized and rehydrated with xylene and a graded alcohol series. Three slices were selected for each tissue that included the infarcted border zones, and three to four fields were selected for each slice. The average values were calculated and three or four mice in each group were selected. After blocking endogenous peroxidase with 3% H2O2, the tissue sections were washed in PBS. Then, the tissue sections were blocked with 5% goat serum and incubated with antibodies against per2 (NB100–125; Novus) and LC3B (ab48394; Abcam) for immunostaining identification of per2 and LC3 protein expression.
Terminal deoxynucleotidyl transferase dUTP nick end labeling
Apoptotic nuclei in the cardiac tissues were labeled with a terminal deoxynucleotidyl transferase dUTP nick end labeling (TUNEL) immunostaining assay (Roche, Meylan, France) following the manufacturer's instructions. The 5-μm-thick paraffin-embedded sections were deparaffinized for TUNEL analysis. Three slices were chosen from each sample. Total tissue cell nuclei were labeled by DAPI, whereas apoptotic cell nuclei were labeled with red fluorescein staining. Four fields were randomly selected from each sample to count the number of apoptotic cells, and the counts were expressed as the percentage of the total number of cells in the four fields in each sample. Data from each mouse were averaged and then entered for statistical processing.
Cell culture
Neonatal rat cardiomyocytes (NRCMs) were isolated as described previously. 18 Briefly, 3-day-old Sprague-Dawley rats were euthanized, and after sterilization with alcohol, the heart atriums were removed. The ventricles were minced and digested with 0.1% collagenase. Cells were centrifuged; resuspended in DMEM with 10% FBS, 100 U/mL penicillin, and 100 μg/mL streptomycin; and plated for 1.5 h under standard culture conditions. After 24 h, NRCMs were attached and cultured in complete medium with 0.1 mM 5-Brdu. The rat cardiomyocyte cell line H9C2, which was purchased from the American Type Culture Collection (ATCC), was cultured in DMEM supplemented with 10% FBS at 37°C in a humidified atmosphere containing 5% CO2 and 95% air. For the chloroquine (CQ, an autophagy inhibitor that can inhibit the fusion of autophagosome and lysosome) group, CQ was added to cells at a concentration of 50 μM and 24 h later, the cells were harvested. For the compound C (also called dorsomorphin, which has been widely used in cell-based, biochemical, and in vivo assays as a selective AMPK inhibitor) group, it was added to cells at a concentration of 10 μM and 30 min later, the cells were collected. 19
ADV-mediated overexpression of per2 and hypoxia induction
For the per2 overexpression experiment, 5 × 10⁵ cells were cultured in 35-mm culture dishes. The cells were transfected with ADV-per2 and an ADV-GFP was used as the control. After transfection for 48 h, the cells were cultured in a hypoxic incubator (H35 hypoxystation) with 94% N2, 5% CO2, and 1% O2 for 24 h to mimic the ischemic condition. Cells cultured in a normoxic incubator were used as the control group.
Monomeric red fluorescent protein-GFP-LC3 assay
The autophagic flux was measured as described previously. 20 NRCMs were plated in eight-well chamber slides and incubated with an monomeric red fluorescent protein (mRFP)-GFP-LC3 lentivirus (Hanbio Co., Ltd., Shanghai, China). Then, 48 h later, cells were visualized at 405, 561, and 488 nm using a confocal laser scanning microscope (LSM710; Zeiss). Autophagic flux was then measured by counting of GFP+/mRFP+ (yellow) and GFP−/mRFP+ (red) cells.
Western blotting
Proteins were extracted from H9C2 cells by adding 1 × RIPA lysis buffer (P0013B; Beyotime). The proteins (10–20 μg) were separated on SDS-polyacrylamide gels (10–15%) and electrically transferred to polyvinylidene difluoride (PVDF) membranes (Millipore). The membranes were probed with primary antibodies at a 1:500–1:1,000 dilution, including anti-LC3B, anti-GAPDH (internal reference; CST), anti-Beclin 1 (3495S; CST), anti-phospho-AMPK (Thr172, 2535s; CST), anti-AMPK (5831s; CST), anti-Atg5 (12994; CST), anti-Bmal1 (14020; CST), anti-Bax (14796; CST), and anti-Bcl-2 (3498; CST). After incubation with the secondary antibody (1:5,000, 14708s; CST), ECL was added to the membranes (Millipore). Densitometric analysis was performed using ImageJ software.
Flow cytometry analysis
To study the effects of per2 on cell survival, we stained the cells with an Annexin V-APC/7-AAD Detection Kit and analyzed them by flow cytometry. Briefly, the cells (6 × 10⁵) were gently washed with PBS. Then, cells were resuspended in 100 μL of binding buffer solution containing 5 μL of Annexin V-APC and 5 μL of 7-AAD in the dark for 10 min at room temperature, after which 400 μL of binding buffer was added to the mixture. The cells were then analyzed by flow cytometry within 1 h after halting the reaction. H9C2 cells stained with Annexin V-APC, 7-AAD, or both were, respectively, designated as early apoptotic, necrotic, or late apoptotic cells. The flow cytometry data were assessed using BD FACS Diva software, v7.0 (Becton Dickinson).
Statistical analysis
All data are presented as the mean ± SD of at least three independent experiments. Differences between two groups were evaluated using Student's t-test, and multiple comparisons were performed using one-way ANOVA; p < 0.05 was considered statistically significant.
Results
per2 and LC3 expression levels are different at different times in the heart
The majority of studies have shown that symptom onset between midnight and 6 a.m. is associated with the worst outcomes. 21,22 Circadian rhythm genes may play an important role in an MI model. In our study, we found that the per2 expression level was different at different times. In addition, there was a correlation between the expression of per2 and LC3. We obtained mouse hearts at 6:00, 12:00, and 18:00 h under natural lighting conditions. The per2 protein level varied with the collection time. At 12:00 and 18:00 h, the per2 protein showed a higher expression level, although the difference between 12:00 and 18:00 h was not significant (Fig. 1A–C). We also found that the LC3 protein showed the highest expression at 12:00 h (Fig. 1C, E).
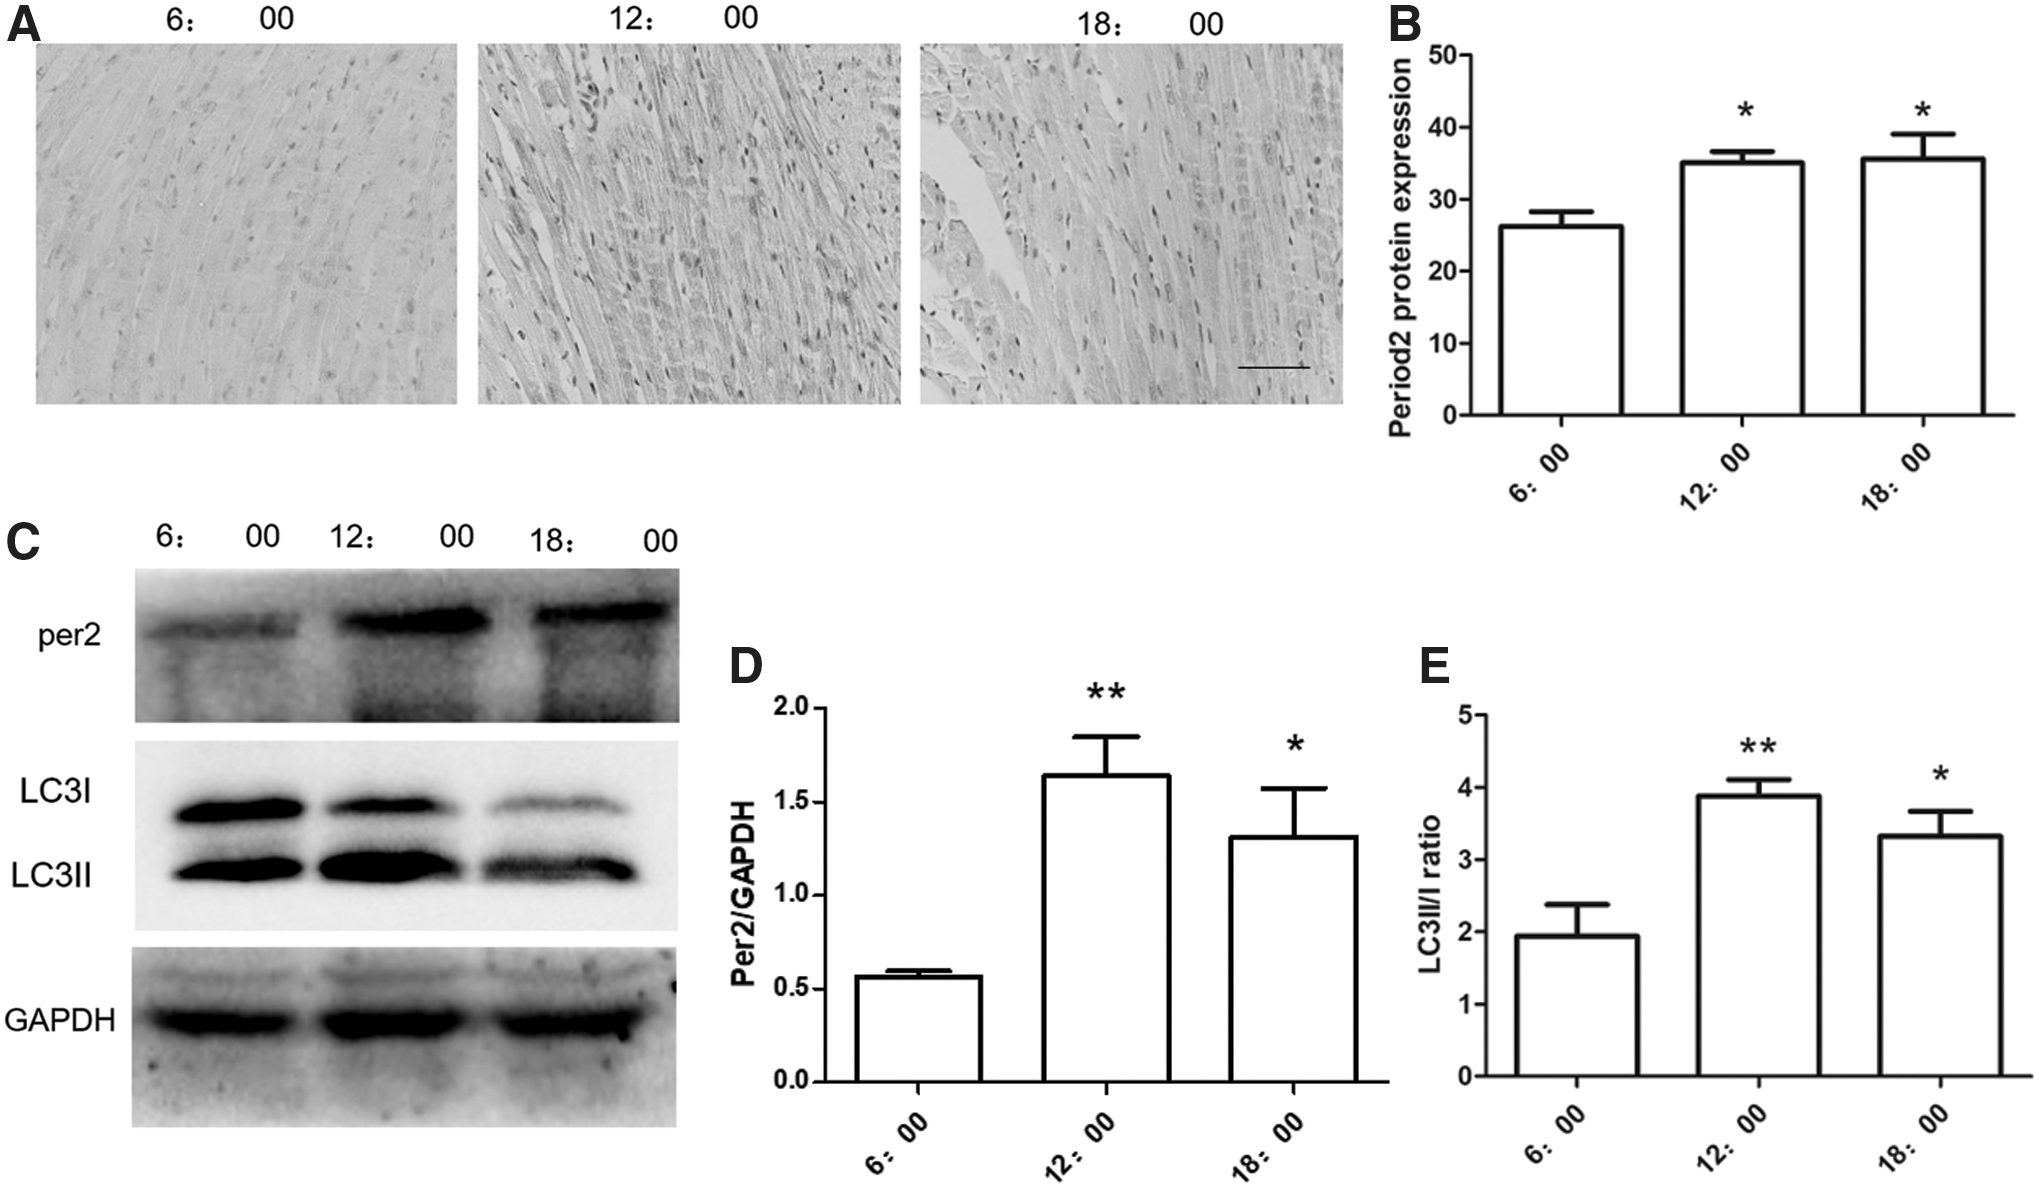
Different expression levels of per2 and LC3 in the heart at different times.
Overexpression of per2 after an MI improves cardiac function and decreases the infarct area
We injected ADV-conjunct per2 into the myocardium after an MI. Per2 protein expression is shown in Supplementary Figure S1 and Supplementary Figure S4A. The cardiac function decreased after the MI. MI mice with myocardial overexpression of per2 showed better cardiac function. There was a higher left ventricular ejection fraction and fractional shortening in the per2 overexpression mice (Fig. 2). Mice with per2 overexpression showed a smaller infarct area than that of the ADV-GFP group (Fig. 3A, B).

Representative echocardiograms of mice after myocardial infarction.
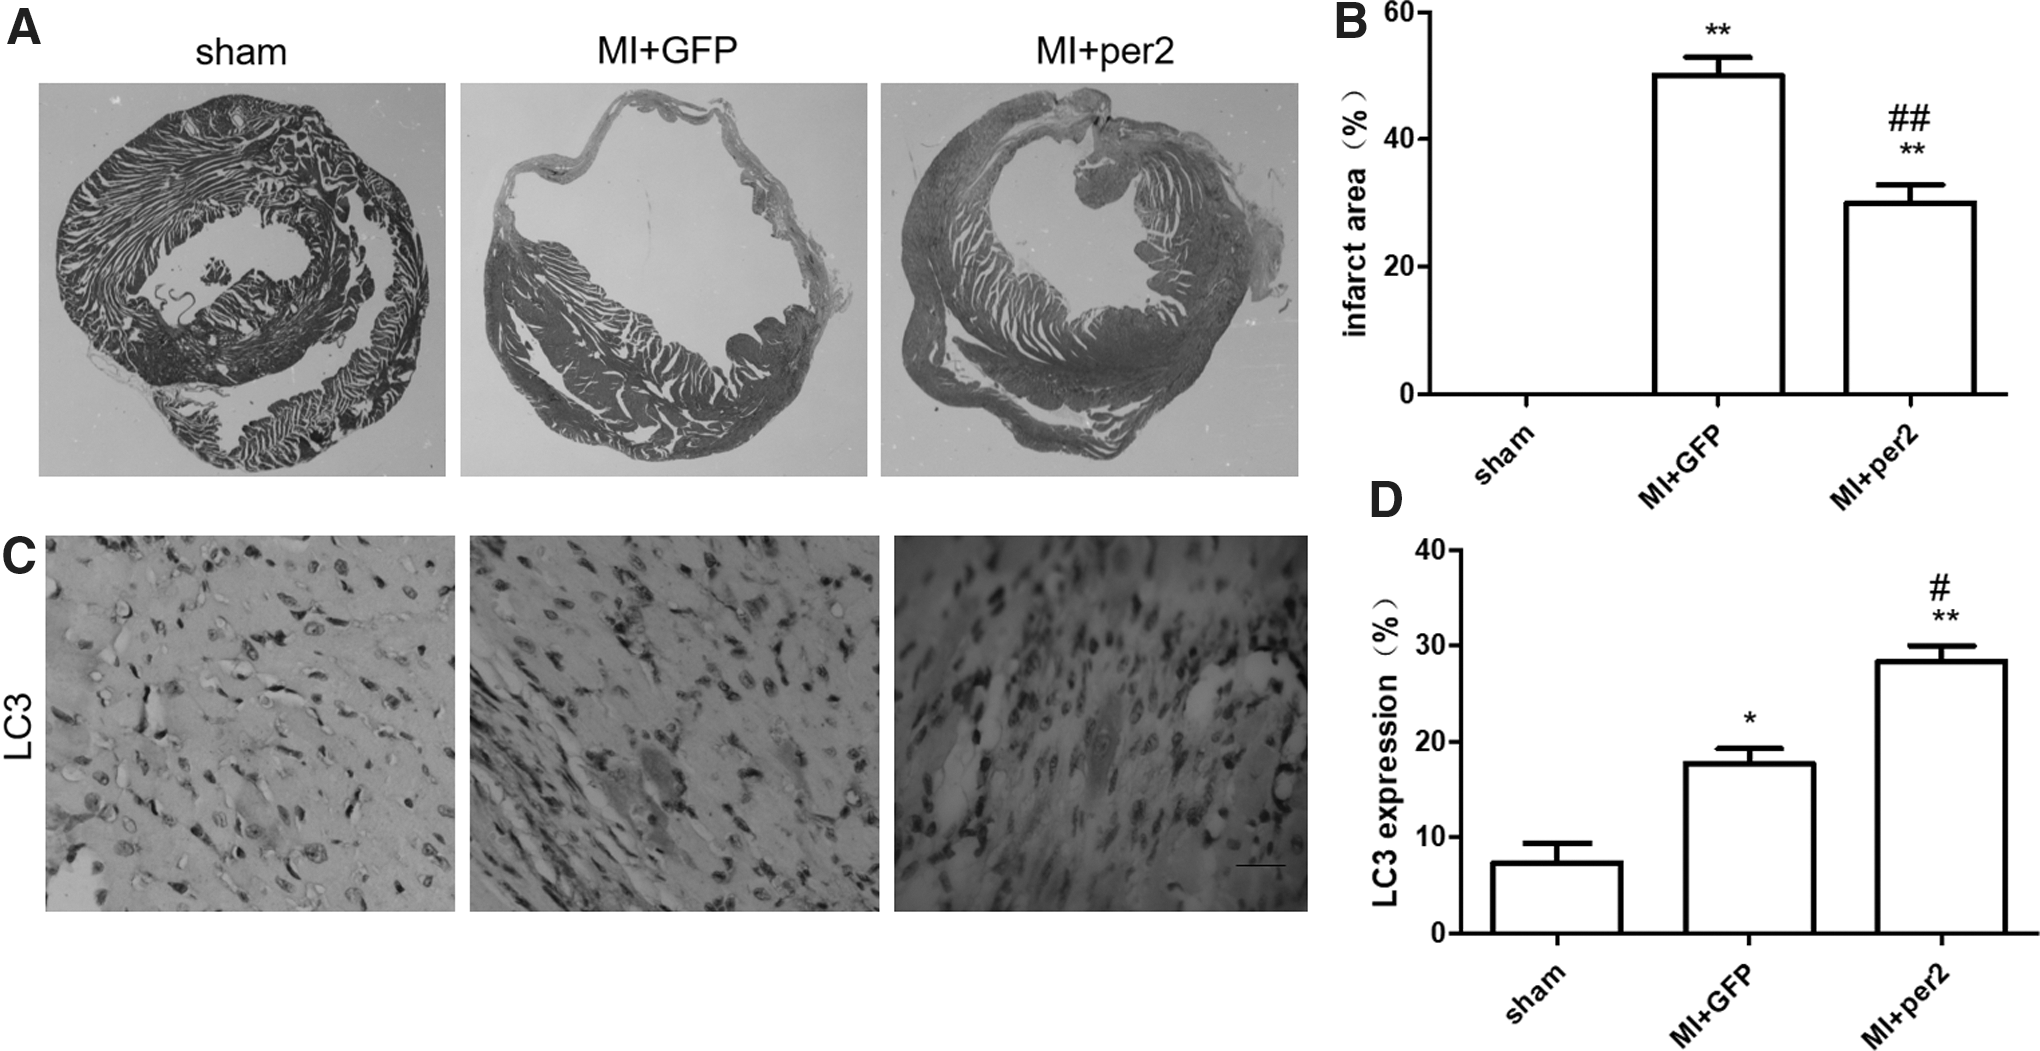
Different infarct areas and different LC3 expression levels in the sham group, MI+GFP group, and MI+per2 group.
Overexpression of per2 increases myocardial autophagy after MI
The role of autophagy after MI is still controversial. Chi et al. found that myocyte autophagy progressively decreased at 1, 4, and 8 weeks after MI, 23 but Yan et al. found that the LC3-II/I ratio and Beclin 1 increased in chronic ischemic myocardium. 24 Mice with per2 overexpression showed high expression levels of LC3 (Fig. 3C). Overexpression of per2 increased the LC3-II protein level. Further study was used to observe whether overexpression of per2 increased the conversion of LC3-I to LC3-II. The results showed that per2 overexpression further increased the LC3-II/I ratio. The level of Atg5 was increased after per2 overexpression in the MI model (Supplementary Fig. S2, Supplementary Fig. S4B). Beclin 1, as a mammalian autophagy gene, is another rate-limiting factor of autophagosome formation from the available LC3-II in cardiac myocytes. 25 Per2 overexpression increased Beclin 1 expression (Fig. 4, Supplementary Fig. S2, Supplementary Fig. S4C).
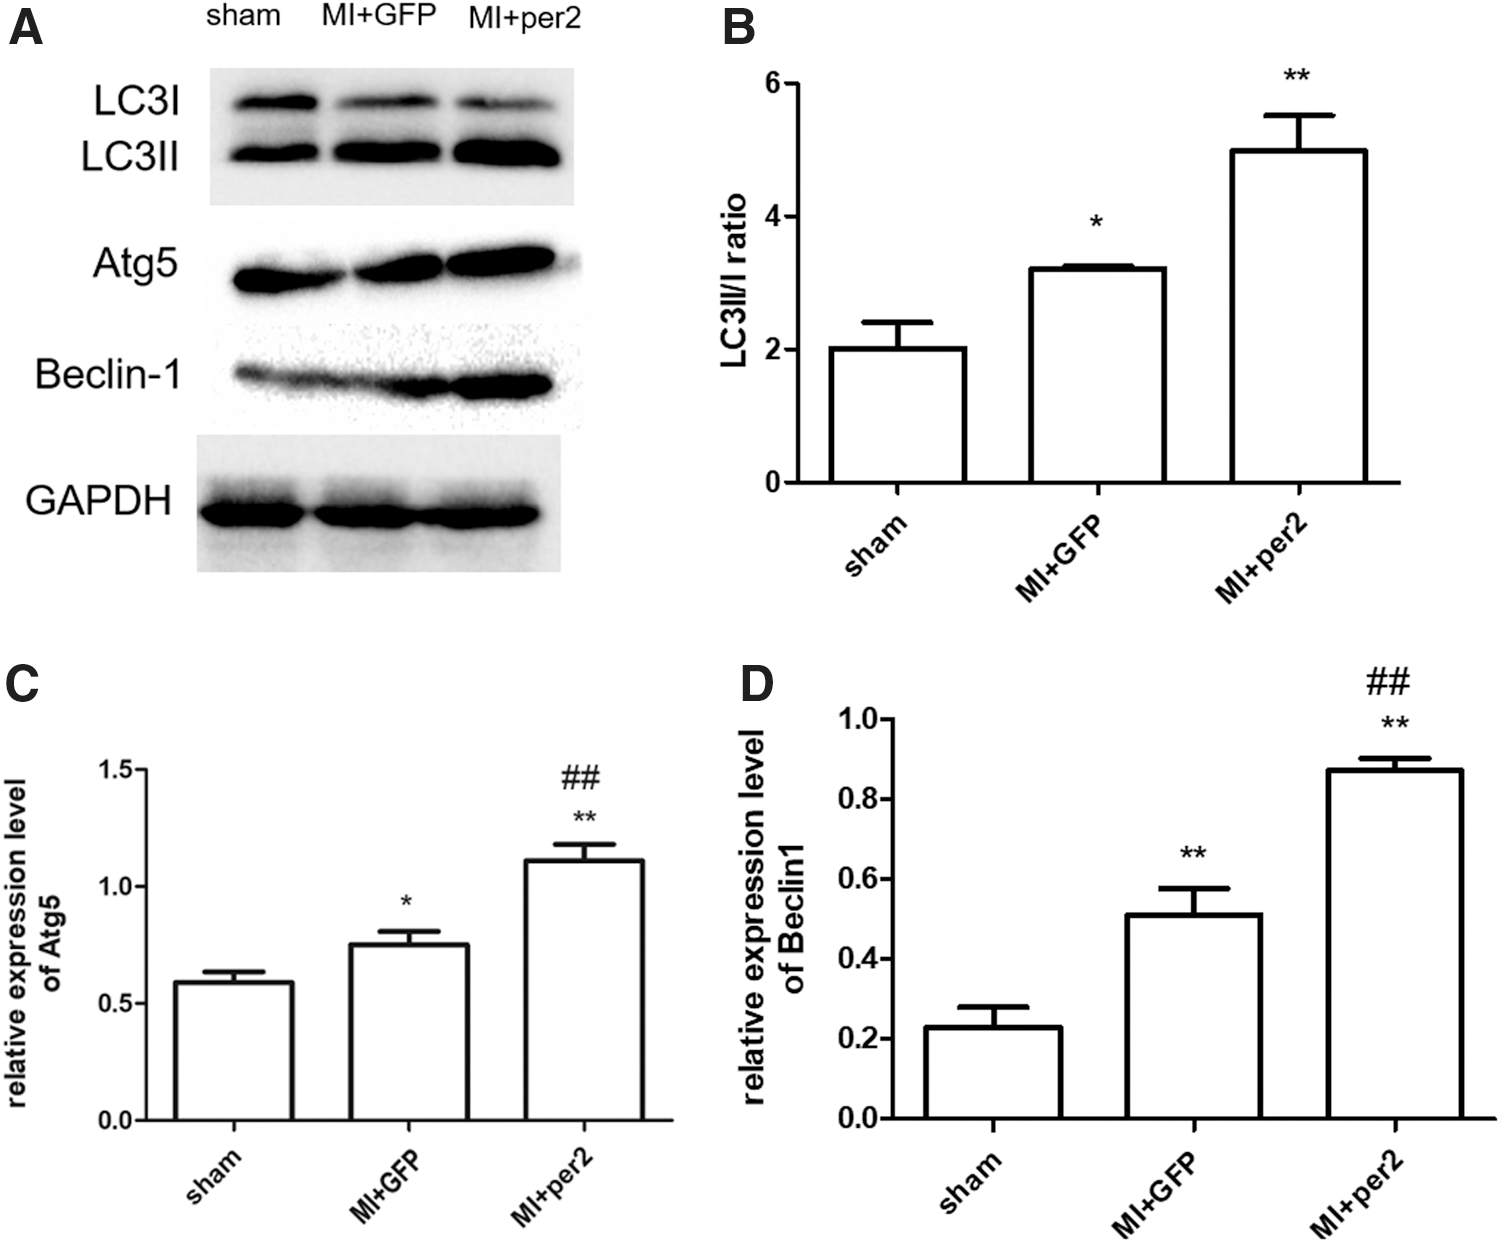
Western blot analysis of autophagy-related protein expression in heart tissues.
Overexpression of per2 inhibits hypoxia-induced myocardial apoptosis after MI
Cell apoptosis in the border zone of the heart after MI was increased and the results showed that overexpression of per2 decreased cell apoptosis compared with the control group. These results suggested that per2 may partially improve cardiac function after MI by inhibiting cell apoptosis (Fig. 5).

TUNEL staining of heart tissue.
In cultured NRCMs, per2 overexpression increases hypoxia-induced autophagy
To further study the effects of per2 on hypoxia-treated cardiomyocytes, we induced per2 overexpression in NRCMs and H9C2 cells by transfecting the cells with ADV-per2. The efficiency values of these transfections are presented in Fig. 6A.
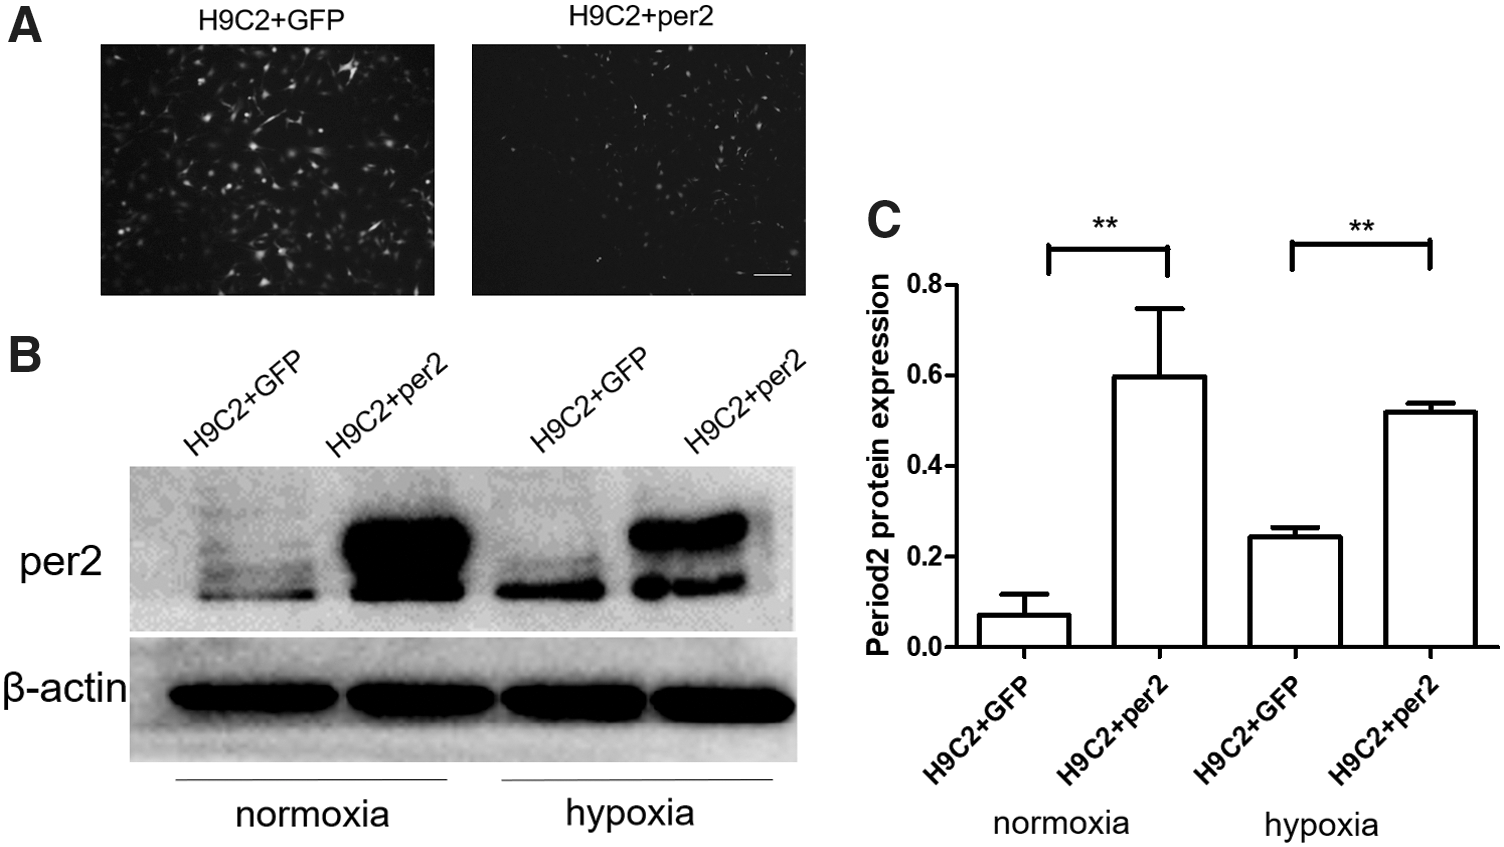
Efficiency values of overexpression of per2 in H9C2 cells under both normoxia and hypoxia.
Enhanced levels of autophagy were also observed in the heart during MI in our study. Western blot analysis demonstrated that overexpression of per2 in H9C2 cells promoted the conversion of LC3-I to LC3-II under both normoxic and hypoxic conditions (Fig. 7B, Supplementary Fig. S4D). These observations were also strengthened by fluorescence microscopy experiments performed in NRCMs expressing an mRFP-GFP tandem fluorescence-tagged LC3B construct (Fig. 7A, Supplementary Fig. S3). At the same time, we also found that Atg5 and Beclin 1 were promoted by per2 overexpression (Fig. 7B). Additionally, the overexpression of per2 decreased Bmal1 protein expression, and phosphorylation of AMPK was increased (Fig. 7C). Autophagosome accumulation can be indicative of an increased de novo autophagosome biosynthesis or of autophagy inhibition. 26 As expected, CQ treatment caused an increase of LC3B conversion from I to II, which reflects the basal level of autophagy of these cells. The effect was more evident when cells were exposed to a combination of per2 and CQ (Fig. 7D), demonstrating that overexpression of per2 can induce a complete autophagic flux in these cells.

Overexpression of per2 increased autophagy.
per2 overexpression increases autophagy, in part, through activating AMPK phosphorylation
We analyzed the impact of per2 on AMPK, a sensor kinase that when activated, can inhibit the mTOR pathway and/or activate the ULK1 protein complex, which is responsible for the initiation step of autophagy. As shown in Fig. 7C, per2 overexpression increased AMPK phosphorylation at Thr172. To test whether the increased autophagy by overexpression of per2 is dependent on AMPK phosphorylation, compound C (an inhibitor of AMPK) was used. Compared with cells with per2 overexpression, cells overexpressing per2 in combination with compound C showed a decreased LC3-II/I ratio (Fig. 7E).
Overexpression of per2 reduces H9C2 apoptosis induced by hypoxia
To further examine the effects of per2 on hypoxia-treated cardiomyocytes, we induced per2 overexpression in H9C2 cells by transfecting the cells with an ADV combined with per2. The results of the flow cytometry analysis of H9C2 cells grown under normal culture conditions revealed that per2 can significantly decrease cell apoptosis. After hypoxia treatment, the number of apoptotic cells increased, while cells overexpressing per2 decreased cell apoptosis induced by hypoxia (Fig. 8A, B). Western blot analysis showed that overexpression of per2 increased Bcl-2 expression and decreased Bax expression under hypoxia (Fig. 8C, D).
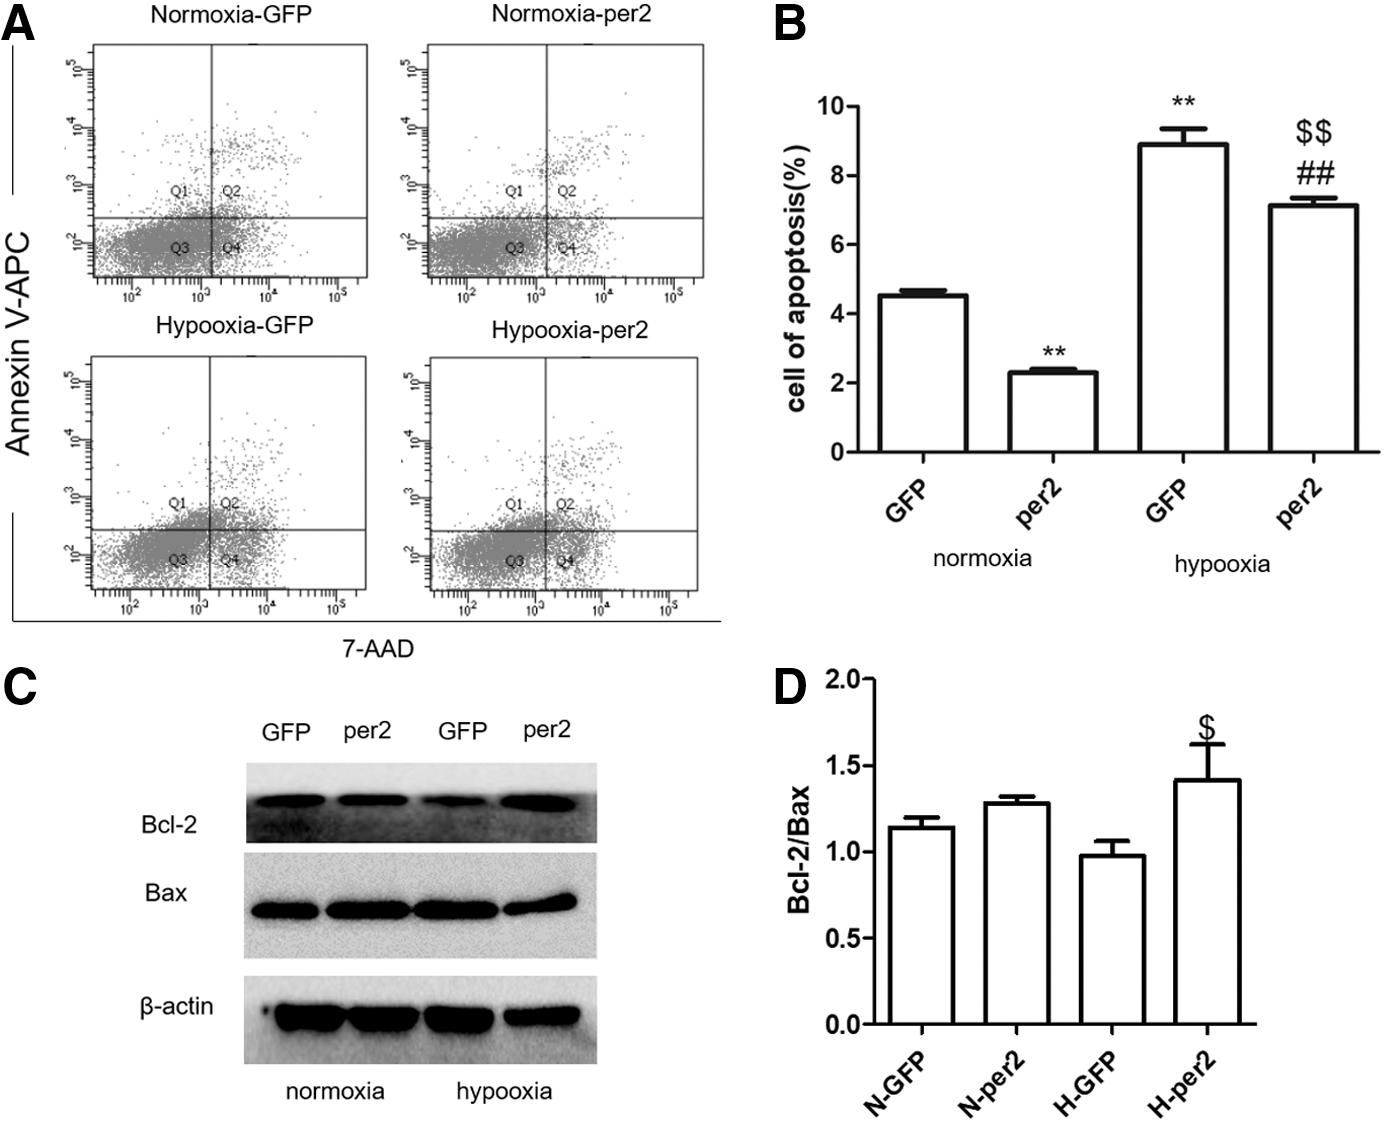
Overexpression of per2 decreased hypoxia-induced apoptosis.
Discussion
Circadian expression of clock genes in the mouse heart was first described in 2001. 27 In rat cardiomyocytes, the presence of 2.5% fetal calf serum in the culture medium is sufficient to maintain rhythmic expression of the core clock genes, Bmal1, Rev-erbα, and per2, and the energy metabolism genes, pyruvate dehydrogenase kinase 4 and uncoupling protein 3. 28 per2 has been the focus of studies regarding cardiovascular diseases. 29 In this study, we demonstrated a circadian pattern of per2 protein expression and the LC3-II/I ratio in the mouse heart. Previous studies had found that there was a circadian rhythmicity of MI incidence, infarct size, and clinical outcomes in STEMI. 22
To detect the role of per2 in the infarct area, ADV-per2 was injected into the myocardium after an MI. Four weeks after the MI, hearts with overexpression of per2 showed a smaller infarct area. To further study the mechanisms of how per2 reduced the myocardial infarct area, the level of autophagy was detected. The central finding of our study is that the rhythm of MI is related to the regulatory effect of the per2 gene on myocardial autophagy. When the per2 gene was overexpressed, it could reduce the damage to myocardial cells caused by ischemia or hypoxia through increasing myocardial autophagy.
In previous studies, per2 was found to be a protective gene against myocardium ischemia. 30 In addition, per2 has also been demonstrated to play a role in cell-autonomous autophagy regulation. 10 Sciarretta et al. found that trehalose reduced MI-induced cardiac remodeling and dysfunction through activation of autophagy. 31 In our study, we found that autophagy was increased by overexpression of per2. Meanwhile, Bmal1 protein expression was reduced.
However, it should not be presently concluded that other clock genes also likewise play a role in myocardium autophagy regulation after an MI. Kalfalah et al. 10 showed that siRNA-mediated downregulation of per2 decreased murine fibroblast autophagy levels. They also found that the maximum autophagic flux in skin cells is reached in the middle of the dark phase. However, in the liver, autophagic flux is maximal in the middle of the light phase. 32 Our study showed that the highest autophagic relative protein LC3-II/I appeared at 12:00 h.
Although the role of autophagy in cardiomyocytes remains controversial, it is adaptively induced to meet the needs of cellular metabolism, eliminating damaged mitochondria and alleviating apoptosis. There is also growing evidence that activation of autophagy could play a protective role in early postnatal life 33 and early stages of diseases. 34,35 When the degree of autophagy is high, the ability of cells to clear damaged organelles increases, which may explain why infarct size varies at different time points. In line with these differences, the contribution of the circadian clock to autophagy regulation might vary depending on different tissues.
Meanwhile, per2 overexpression also reduced myocardium apoptosis after MI. In a cell study, per2 overexpression decreased hypoxia-induced apoptosis. Bax and Bcl-2 were found to participate in per2-regulated cell apoptosis under hypoxia. Yan et al. observed that peak autophagic activity was concurrent with the decline in apoptosis after ischemia, which suggests that autophagy may be involved in protection against apoptosis in the setting of chronic ischemia. 36 In different cells and the microenvironment, per2 plays a different role in expression of Bcl-2/Bax. Mice that received diethylnitrosamine showed a lower expression of per2 and a higher Bax/Bcl-2 ratio in the liver. 37 However, in young per2 knockout mice, the ratio of Bcl-2/Bax is increased. 38 The interaction between Bcl-2 and Beclin 1 is necessary both in autophagy and apoptosis. 39 Beclin 1 can interact with the Bcl-2 family protein through a BH3 domain. The protein modification of Bcl-2 and Beclin 1 also plays important roles in regulation of autophagy and apoptosis, but the main regulatory factors are still unclear. Many problems need to be researched and discussed deeply.
Emerging evidence indicates that the circadian clock regulates the major pathways of autophagy. Our investigation produced multiple lines of evidence to support the concept that autophagy is upregulated in the setting of chronic myocardial ischemia in vivo and in vitro. In the present study, per2 overexpression was found to promote cell autophagy after hypoxia based on an analysis of the ratio of LC3B-II/I, Atg5, Beclin 1 expression, and autophagic flux. It is well established that optimal autophagic activation is critical to maintain cellular function and homeostasis, whereas excessive autophagy may be maladaptive and may promote cell death. 40 We hypothesized that overexpression of per2 might upregulate myocardial autophagy within a safe range and protect the heart from hypoxic injury.
AMPK is known to regulate cell survival and proliferation. 41 AMPK is activated in rapidly proliferating cells such as cardiac fibroblasts and cancer cells. 42,43 Furthermore, in some cell types, AMPK is critical for cell cycle regulation, the decision to enter autophagy or apoptosis, and other cell fate decisions during development. 38 In the process of myocardial ischemia, an increase of AMP may lead to AMPK activation, which has made AMPK a key regulator of autophagy. AMPK activates autophagy by directly binding to and phosphorylating ULK1, which is an upstream component of the core autophagy machinery. 26 Moreover, per2 overexpression significantly enhanced AMPK-dependent autophagy and protected against hypoxia-induced cell death. AMPK-induced autophagy may contribute to ATP production and promotion of cell survival in the ischemic myocardium. In this study, per2 overexpression enhanced the occurrence of autophagy, which was blocked by compound C. This suggests that the increase in cardiac myocyte autophagy by overexpression of per2 is AMPK dependent. In summary, our study investigated the effects of per2 on hypoxia-induced apoptosis and autophagy. per2 expression was lower in the morning and higher at noon. The expression pattern of LC3-II/I was the same as that of per2. In the mouse MI model, per2 overexpression improved cardiac function, in part, through increasing myocardium autophagy. Since per2-induced autophagy can be inhibited by compound C, per2 partially increases cardiomyocyte autophagy through the AMPK signaling pathway. In the future, changes in per2 expression may be become part of MI therapy.
Footnotes
Author Disclosure
No competing financial interests exist.
Funding Information
The present study was supported by the National Natural Science Foundation of China (Grant Nos. 81600344, 81500339, 81800382, and 81402218), Shandong Key research and development program, China (2019GSF108276), Taishan Scholar Project of Shandong Province of China (Grant No. tsqn20161066), Shandong Provincial Natural Science Foundation, China (Grant Nos. ZR2016HQ29, ZR2017BH055, and ZR2017BH013), China Postdoctoral Science Foundation (Grant Nos. 2018M642673 and 2018M640638), and Shandong Province Outstanding Young Scientists Research Award Fund (Grant No. BS2015YY026).
Supplementary Material
Supplementary Figure S1
Supplementary Figure S2
Supplementary Figure S3
Supplementary Figure S4
References
Supplementary Material
Please find the following supplemental material available below.
For Open Access articles published under a Creative Commons License, all supplemental material carries the same license as the article it is associated with.
For non-Open Access articles published, all supplemental material carries a non-exclusive license, and permission requests for re-use of supplemental material or any part of supplemental material shall be sent directly to the copyright owner as specified in the copyright notice associated with the article.