
Abstract
The incidence of type 2 diabetes mellitus (T2DM) has been increasing annually, which is a serious threat to human health. Fibroblast growth factor 21 (FGF21) is one of the most popular targets for the treatment of diabetes because it effectively improves glycolipid metabolism. In our experiment, human FGF21 (hFGF21) was injected and stably expressed in the liver tissues of a rat T2DM model with lentivirus system. Based on clinical and histopathological examinations, islet cells were protected and liver tissue lesions were repaired for >4 months. Glucose metabolism and histopathology were controlled perfectly when hFGF21 was stably expressed in partial liver of T2DM rats. The results showed that the liver tissue cell apoptosis was reduced, the lipid droplet content was decreased, the oxidative stress indexes were improved, the glycogen content was increased, and the islet cells were increased too. Besides, insulin sensitivity and glycogen synthesis-related genes expression were increased, but cell apoptosis-related genes caspase3 and NFκB expression were decreased. The effectiveness of results suggested that injecting hFGF21 to rats liver could effectively treat T2DM.
Introduction
Type 2 diabetes mellitus (T2DM) is a metabolic disorder that can potentially cause a series of complications that endanger human health due to increased serum insulin levels and dysfunction. 1 The blood glucose in prediabetic or diabetic subjects can reach higher levels that can be stimulatory to glucagon secretion, because glucose level has action and reaction on glucagon release. 2,3 Glucagon controls gene expression and metabolic zonation in the liver through a counterplay with the Wnt/β-catenin signaling pathway. 4 The liver constitutes a key organ in systemic metabolism, contributing substantially to the development of insulin resistance and T2DM. 5 In recent years, >90% of patients with diabetes have been diagnosed with type 2 diabetes, the incidence has increased annually, and individuals have been diagnosed with the disease at an increasingly young age. The most effective method to control complications is to control blood glucose levels. Traditionally, thiazolidinedione and insulin have been used to treat diabetes. However, these drugs do not meet the requirements for physiological rhythmic release, which cannot lead to a long-lasting hypoglycemic effect and damage to the body. 6 –8
Fibroblast growth factor 21 (FGF21) is a newly discovered member of the FGF family that was isolated from embryonic mouse tissues by Nishimura et al. in 2000. 9 It is a newly discovered metabolic regulator that specifically affects liver, pancreas, and adipose tissues. 10 FGF21 specifically regulates glucose uptake in adipocytes, improves insulin resistance, protects islet beta cells, lowers blood lipid levels, and reduces other lipid metabolism functions in diabetes, indicating that it has great potential as a clinical treatment for metabolic syndromes, such as diabetes, obesity, atherosclerosis, and hepatic adipose infiltration, among other conditions. 11 –17 FGF21 protein is expressed at high levels in the liver, particularly in the fasted state, and causes a series of glycolipid metabolic reactions. 18 –21 In addition, FGF21 is the only FGF member that has not been shown to promote mitosis, which may reduce the risk of side effects in clinical treatments. 22 FGF21 has been considered a promising therapeutic target for the treatment of T2DM and metabolic syndromes because of its unique biological and pharmacological properties. 23,24 FGF21 has been proved as treatment for obesity and insulin resistance by AAV-mediated gene therapy in mice. 25,26
Although the lentiviral vector is an HIV virus that is still potentially dangerous to humans, lentivirus is one of the best vehicles in delivering exogenous genes for therapeutics. 27 In view of FGF21 is highly expressed in liver tissue, it would be interesting to discover whether injecting human FGF21 (hFGF21) targeting liver could exhibit antidiabetic effect on T2DM rats. In this study, we increased the expression of hFGF21 on the liver using a lentiviral vector to investigate the effects of hFGF21 in rat T2DM models. This strategy allowed hFGF21 to participate in regulating glucose and lipid metabolism to meet the demands of the body's physiological circadian rhythm; it also solved problems, such as a short half-life and the difficulty in accurately controlling a repeated dosing regimen. The effectiveness of the treatment was determined by clinical diagnosis and pathological analysis. We also analyzed glycogen synthesis in the liver and muscles as well as the expression of proteins related to glucose metabolism and cell apoptosis. These antidiabetic effectiveness results of hFGF21 targeted liver therapy could provide the basis for additional drug research and clinical applications.
Materials and Methods
Test animals
Forty Wistar male rats (5 weeks old) were obtained from the Institute of Medical Biology at the Chinese Academy of Medical Sciences. The rat models of T2DM were established using the technical procedures for modeling T2DM in the institute. Ten rats were fed with specific pathogen-free (SPF)-grade feed (Beijing Keaoxieli feed. CO., LTD). Thirty rats were intraperitoneally injected with streptozotocin (STZ) at a lower dose of 10 mg/kg body weight once a day for 3 consecutive days after the rats were fed with the diabetes-inducing diet for 2 months (protein 20%, fat 23%, cholesterol 1%, sodium taurocholate 1%, etc.). After 1 week, clinical features of hyperlipidemia, hyperglycemia, insulin resistance, and impaired glucose tolerance were observed in 90% of the rats, indicating the successful establishment of a rat model of T2DM. 28 All animal experiments were performed in the Animal Experimental Barrier System of the Institute of Medical Biology at the Chinese Academy of Medical Sciences. Eight normal rats were allocated to the control group and eight T2DM rats were allocated to the T2DM group and the T2DM–hFGF21 group. All experiments were approved by the Experimental Animal Ethics Committee of the Institute of Medical Biology at the Chinese Academy of Medical Sciences. The experimental animals were used in accordance with the principles of the 3Rs, and humane care was provided to the experimental animals. All rats were fed with SPF-grade feed (Beijing Keaoxieli feed. CO., LTD) and provided clean drinking water. Rats were intraperitoneally injected with a 30 mg/kg dose of sodium pentobarbital anesthesia before each surgery and with a 100 mg/kg dose of sodium pentobarbital for euthanasia at the end of the experiment.
Cell culture and lentiviral packaging
293T cells (preserved in our laboratory archive) were cultured in Dulbecco's modified Eagle's medium (DMEM; HyClone) containing 10% fetal bovine serum (FBS; HyClone) and incubated in a 37°C incubator with 5% CO2. 293T cells in the logarithmic growth phase were digested with trypsin, reseeded in 15-cm culture dishes at a density of 1.2 × 10⁷ cells/20 mL, and cultured with medium containing 10% FBS. After 24 h of incubation at 37°C with 5% CO2, when the 293T cells were ∼85% confluent, the culture medium was replaced with FBS-free medium for 2 h before transfection. Recombinant hFGF21-PLV-EF1a-EGFP[2A]Puro lentiviral vector, pHelper 1.0 plasmid, and pHelper 2.0 vector (Inovogen Tech. Co) were mixed at the proper ratio of 4:3:1 and incubated with serum- and antibiotic-free Opti-MEM (Gibco) for 5 min at room temperature and then with diluted EndoFectinLenti (GeneCopoeia) for 20 min. Finally, the mixture was transfected into the 293T cells. After an 8-h incubation at 37°C with 5% CO2, the transfection medium was replaced with fresh DMEM containing 10% FBS. The lentivirus-containing medium was harvested after an additional 48 h of incubation, centrifuged at 1,000 g for 20 min at 4°C and passed through a 0.45-μm syringe filter. The viral supernatant was transferred to a conical ultracentrifuge tube and centrifuged at 500 g for 20 min at 4°C to concentrate the virus. The remaining viral solution was packaged in cryotubes and stored at −80°C until use.
Liver-targeted hFGF21 overexpression
A 50-μL volume of lentivirus containing hFGF21 with a titer of 5 × 10⁹ viral particles (Vp)/mL 29,30 was injected into the livers of anesthetized T2DM rats in the T2DM–hFGF21 group (n = 8) using a liver biopsy needle. The rats in the control group and the T2DM group were injected with an equal volume of phosphate-buffered saline (PBS) as a control.
Immunohistochemistry and immunofluorescence
After antigen retrieval with sodium citrate buffer in a microwave oven and a 10-min incubation with hydrogen peroxide to block endogenous peroxidase activity, deparaffinized liver and pancreas sections were incubated with a primary rabbit antibody against hFGF21 (1:200, ab171941; Abcam) or caspase-3 (1:200; ADI-AAP-113; ENZO) or glucagon (1:200, ab10988; Abcam) and a primary mouse antibody against INS (1:100, GTX81555; GeneTex) overnight at 4°C. For immunofluorescence staining, the slides were washed three times with phosphate buffer, incubated with a goat antirabbit IgG H&L secondary antibody (1:200, ab150080; Abcam) for 60 min at room temperature, and then washed and cover slipped in VectaShield hard set mounting medium containing 4′6-diamidino-2-phenylindole (DAPI). Immunofluorescence staining was analyzed using a Nikon microscope (Nikon eclipse 80i) with Metamorph software. Postprocessing and quantitative analyses were conducted using ImageJ. For immunohistochemistry, the sections were washed three times with phosphate buffer and incubated with an HRP-labeled antibody for 60 min at room temperature using the GTVision™ III Detection System/Mo&Rb kit (Gene Tech Shanghai Company Limited) according to the manufacturer's instructions. Then, the sections were washed, stained with Dolichos biflorus agglutinin, and counterstained with hematoxylin. The sections were then subjected to 1% hydrochloric alcohol liquid differentiation, dehydration in an ethanol gradient, permeabilization with xylene, and sealing with neutral gum for microscopic analysis.
Total RNA preparation and quantitative real-time reverse transcription-polymerase chain reaction analysis
Total RNA was extracted from liver samples using TRIzol (Invitrogen). RNA was reverse transcribed into complementary DNA using Stratascript Reverse Transcriptase (Promega). The abundance of hFGF21 (exogenous), FGF21 (endogenous), and β-actin transcripts was assessed by real-time PCR using a quantitative reverse transcription-polymerase chain reaction Master Mix ( Promega Corporation) with the primer sequences given in Table 1 according to a standard PCR procedure. The samples were run in triplicate for each of the three genes using the BIO-RAD Real-Time PCR System (CFX96 Real-Time C1000 Touch System). Quantitative polymerase chain reaction (qPCR) data were normalized to the levels of β-actin transcript as determined by the standard curve.
Primers used for quantitative reverse transcription-polymerase chain reaction
Evaluation of clinical data
Body weight
The body weight of rats was recorded once a month from the induction of diabetes to the fourth month after the rats in the T2DM–hFGF21 group were treated with hFGF21.
Feed intake
The average daily intake was measured each month from the induction of diabetes in the rats in the T2DM group and the T2DM–hFGF21 group until the fourth month after the rats in the T2DM–hFGF21 group were treated with hFGF21.
Fasting glucose
The plasma glucose concentrations in each group were detected monthly using a Roche blood glucose meter (ACCU-CHEK®Performa) starting from the time the rats in the T2DM–hFGF21 group were treated with hFGF21. Four months later, the following tests were conducted.
Glucose tolerance test (GTT)
Rats were administered an intraperitoneal bolus of 50% dextrose (2 g/kg) after a 16-h fast. Blood was obtained from the tip of the tail at 0, 15, 30, 45, 60, 90 and 120 min, and the glucose levels were immediately measured using a Roche blood glucose meter.
Insulin tolerance test (ITT)
Rats were administered an intraperitoneal bolus of human insulin (1 U/kg; Novonordisk) after a 16-h fast. Blood was obtained from the tip of the tail at 0, 15, 30, 45, 60, 90, and 120 min, and the glucose levels were immediately measured using a Roche blood glucose meter.
Blood lipid test
After a 16-h fast, plasma was obtained by drawing blood through a venous catheter and evaluated using an automatic biochemical analyzer (AU400 automatic biochemical analyzer; Olympus). Homeostasis model assessment of insulin resistance (HOMA-IR) = fasting glucose (mM) × fasting insulin (mU/L)/22.5.
Enzyme-linked immunosorbent assay for serum protein expression
Whole blood was collected after daytime fasting, night fasting for 16 h and 1 h after feeding through the tail vein. Serum was collected after centrifugation and stored at −20°C. Insulin, adiponectin (ADP), leptin (LEP), and hFGF21 levels were detected using enzyme-linked immunosorbent assay (ELISA) kits (Bossbio Co.). Serum glucagon levels were detected using 4A biotech ELISA kit (Cat. CSPE0012). The absorbance values at 450 nm were measured using a TECAO Infinite M200PRO microplate reader. Subsequently, the protein content was calculated from the optical density (OD) values and analyzed using a standard curve.
Hematoxylin and eosin staining
Rats in each group were euthanized, and liver and pancreas samples were collected and fixed overnight in 4% paraformaldehyde. Tissues were then dehydrated, paraffin embedded, continuously sliced at a thickness of 4 μm, dewaxed with xylene, and then dehydrated with an ethanol gradient. Subsequently, they were stained with eosin, counterstained with hematoxylin, dehydrated with an ethanol gradient, cleared with xylene, and then mounted with neutral gum. Five images were obtained from randomly selected regions of each liver and pancreas slide using ACT software and a Nikon microscope (Nikon eclipse 80i) for analysis; data were analyzed using ImageJ.
Oil Red O staining
Lipids were visualized and quantified using Oil Red O (Sigma-Aldrich) staining. In brief, frozen sections of liver tissue were washed with water and then activated with 60% isopropanol for 10 min. Then, the samples were stained with a 0.7% Oil Red O solution for 30 min, rinsed with 60% ethanol, washed, and counterstained with hematoxylin for microscopic analysis.
Periodic acid-Schiff staining
Sections of liver and muscle tissue were dewaxed using a standard method, incubated with 0.5% periodic acid (Sigma) for 5 min at room temperature, and washed with tap water for 1 min. Then, the sections were stained with Schiff reagent for 10 min, washed, counterstained with hematoxylin, dehydrated with an ethanol gradient, and cleared with xylene. The conventional mounting medium already described was used to apply coverslips. The glycogen content in liver and muscle was observed using microscopy.
Western blot analysis
Liver tissues were obtained using the hepatocentesis method every month for 3 months after the rats in the T2DM-hFGF21 group were treated with hFGF21. In the fourth month, liver and muscle were obtained after the rats were euthanized in all groups. Liver and muscle tissues were homogenized in sucrose homogenization buffer using a glass-on-glass Dounce homogenizer and centrifuged at 1,000g to remove the connective tissue. Cells were lysed with protein lysis buffer, and the supernatant was obtained after centrifugation at 1,000g. Protein concentrations were measured with the BCA Protein Assay Kit (cwbiotech) as already described. Then, 20 μg of total protein from different samples was loaded onto gels and analyzed using sodium dodecyl sulfate–polyacrylamide gel electrophoresis. Then, they were transferred to a nitrocellulose membrane and blocked with 5% milk buffer for 30 min. Membranes were then incubated with anti-hFGF21 (1:1,000, ab171941; Abcam), anti-KLB (1:1,500, A7A002N; ThermoFisher), anti-FGFR1 (1:500, ab10646; Abcam), anti-NFκB (1:1,000, GTX17742; GeneTex), anti-IRS1 (1:1,000, ab40777; Abcam), anti-IRS2 (1:1,000, ab46811; Abcam), antiphosphoinositide 3 kinase (PI3K) p85α (1:500, ab40755; Abcam), anti-p-PI3K P85 (1:2,000, ab86299; Abcam), anticaspase-3 (1:1,000, ADI-AAP-113; ENZO), antiglycogen synthase kinase 3β (GSK3β, 1:1,000, ab131356; Abcam), and anti-β-actin (1:4,000, GTX629630; GeneTex) antibodies in blocking buffer overnight at 4°C. Membranes were washed with TBST buffer and incubated with HRP-conjugated antirabbit (1:4,000, ab6721; Abcam) or antimouse antibodies (1:4,000, ab6789; Abcam) for 1 h at room temperature. The enhanced chemiluminescence method was used to detect the signals, and band intensities were quantified using a ChemiDoc Touch imaging system (Bio-Rad).
Detection of oxidative stress indexes
Total protein in the liver tissues was quantified with a BCA Protein Assay Kit (Beyotime) and diluted. Oxidative stress indexes were measured using a Total Superoxide Dismutase Assay Kit (Beyotime) with WST-8, Catalase Assay Kit (Beyotime), and Lipid Peroxidation MDA Assay Kit (Beyotime) according to the manufacturer's instructions. The OD was measured using a microplate reader.
Detection of apoptosis using the TUNEL method
Apoptosis in the liver tissues was detected with the Colorimetric TUNEL Apoptosis Assay Kit (Beyotime). Liver tissue sections were dewaxed using a standard method, incubated with DNase-free Protease K for 30 min at 37°C, and washed with PBS buffer. Freshly prepared terminal-deoxynucleoitidyl transferase mediated nick end labeling (TUNEL) reaction buffer was incubated with the sections in the dark for 1 h at 37°C. Apoptotic bodies were detected with a fluorescence microscope.
Statistical analysis
Grayscale images of the immunohistochemical, periodic acid-Schiff, and Oil Red O staining were measured using ImageJ software. Image Lab software was used to analyze the Western blot results. Differences were assessed using two-tailed unpaired Student's t-tests when two groups were compared or analysis of variance with Bonferroni's multiple comparison test when three groups were compared. p-Values <0.05 were considered statistically significant. Data are reported as mean ± standard error of the mean.
Results
hFGF21 expression in the liver
The green fluorescence of the enhanced green fluorescent protein (eGFP) reporter was directly observed in liver tissues in the T2DM–hFGF21 group after a recombinant hFGF21-PLV-EF1a-EGFP[2A]Puro lentiviral vector was injected into the liver of T2DM rats (Fig. 1A). The levels of hFGF21 mRNA were significantly higher in the liver of the T2DM–hFGF21 group than in the control and T2DM groups (Fig. 1B). The expression of hFGF21 in the T2DM–hFGF21 group was substantially higher in the T2DM–hFGF21 group than in the control and T2DM groups at the fourth month (p < 0.01) (Fig. 1C). According to immunofluorescence staining, the lentivirus-transduced hFGF21 protein was expressed at the same site as the eGFP protein (Supplementary Fig. S1). However, neither eGFP nor the hFGF21 protein was detected in the control group or the T2DM group (Fig. 1D, E).

Lentivirus-mediated overexpression of hFGF21 in the rat liver.
Changes in clinical biochemical indexes in the T2DM rats treated with the lentivirus expressing hFGF21
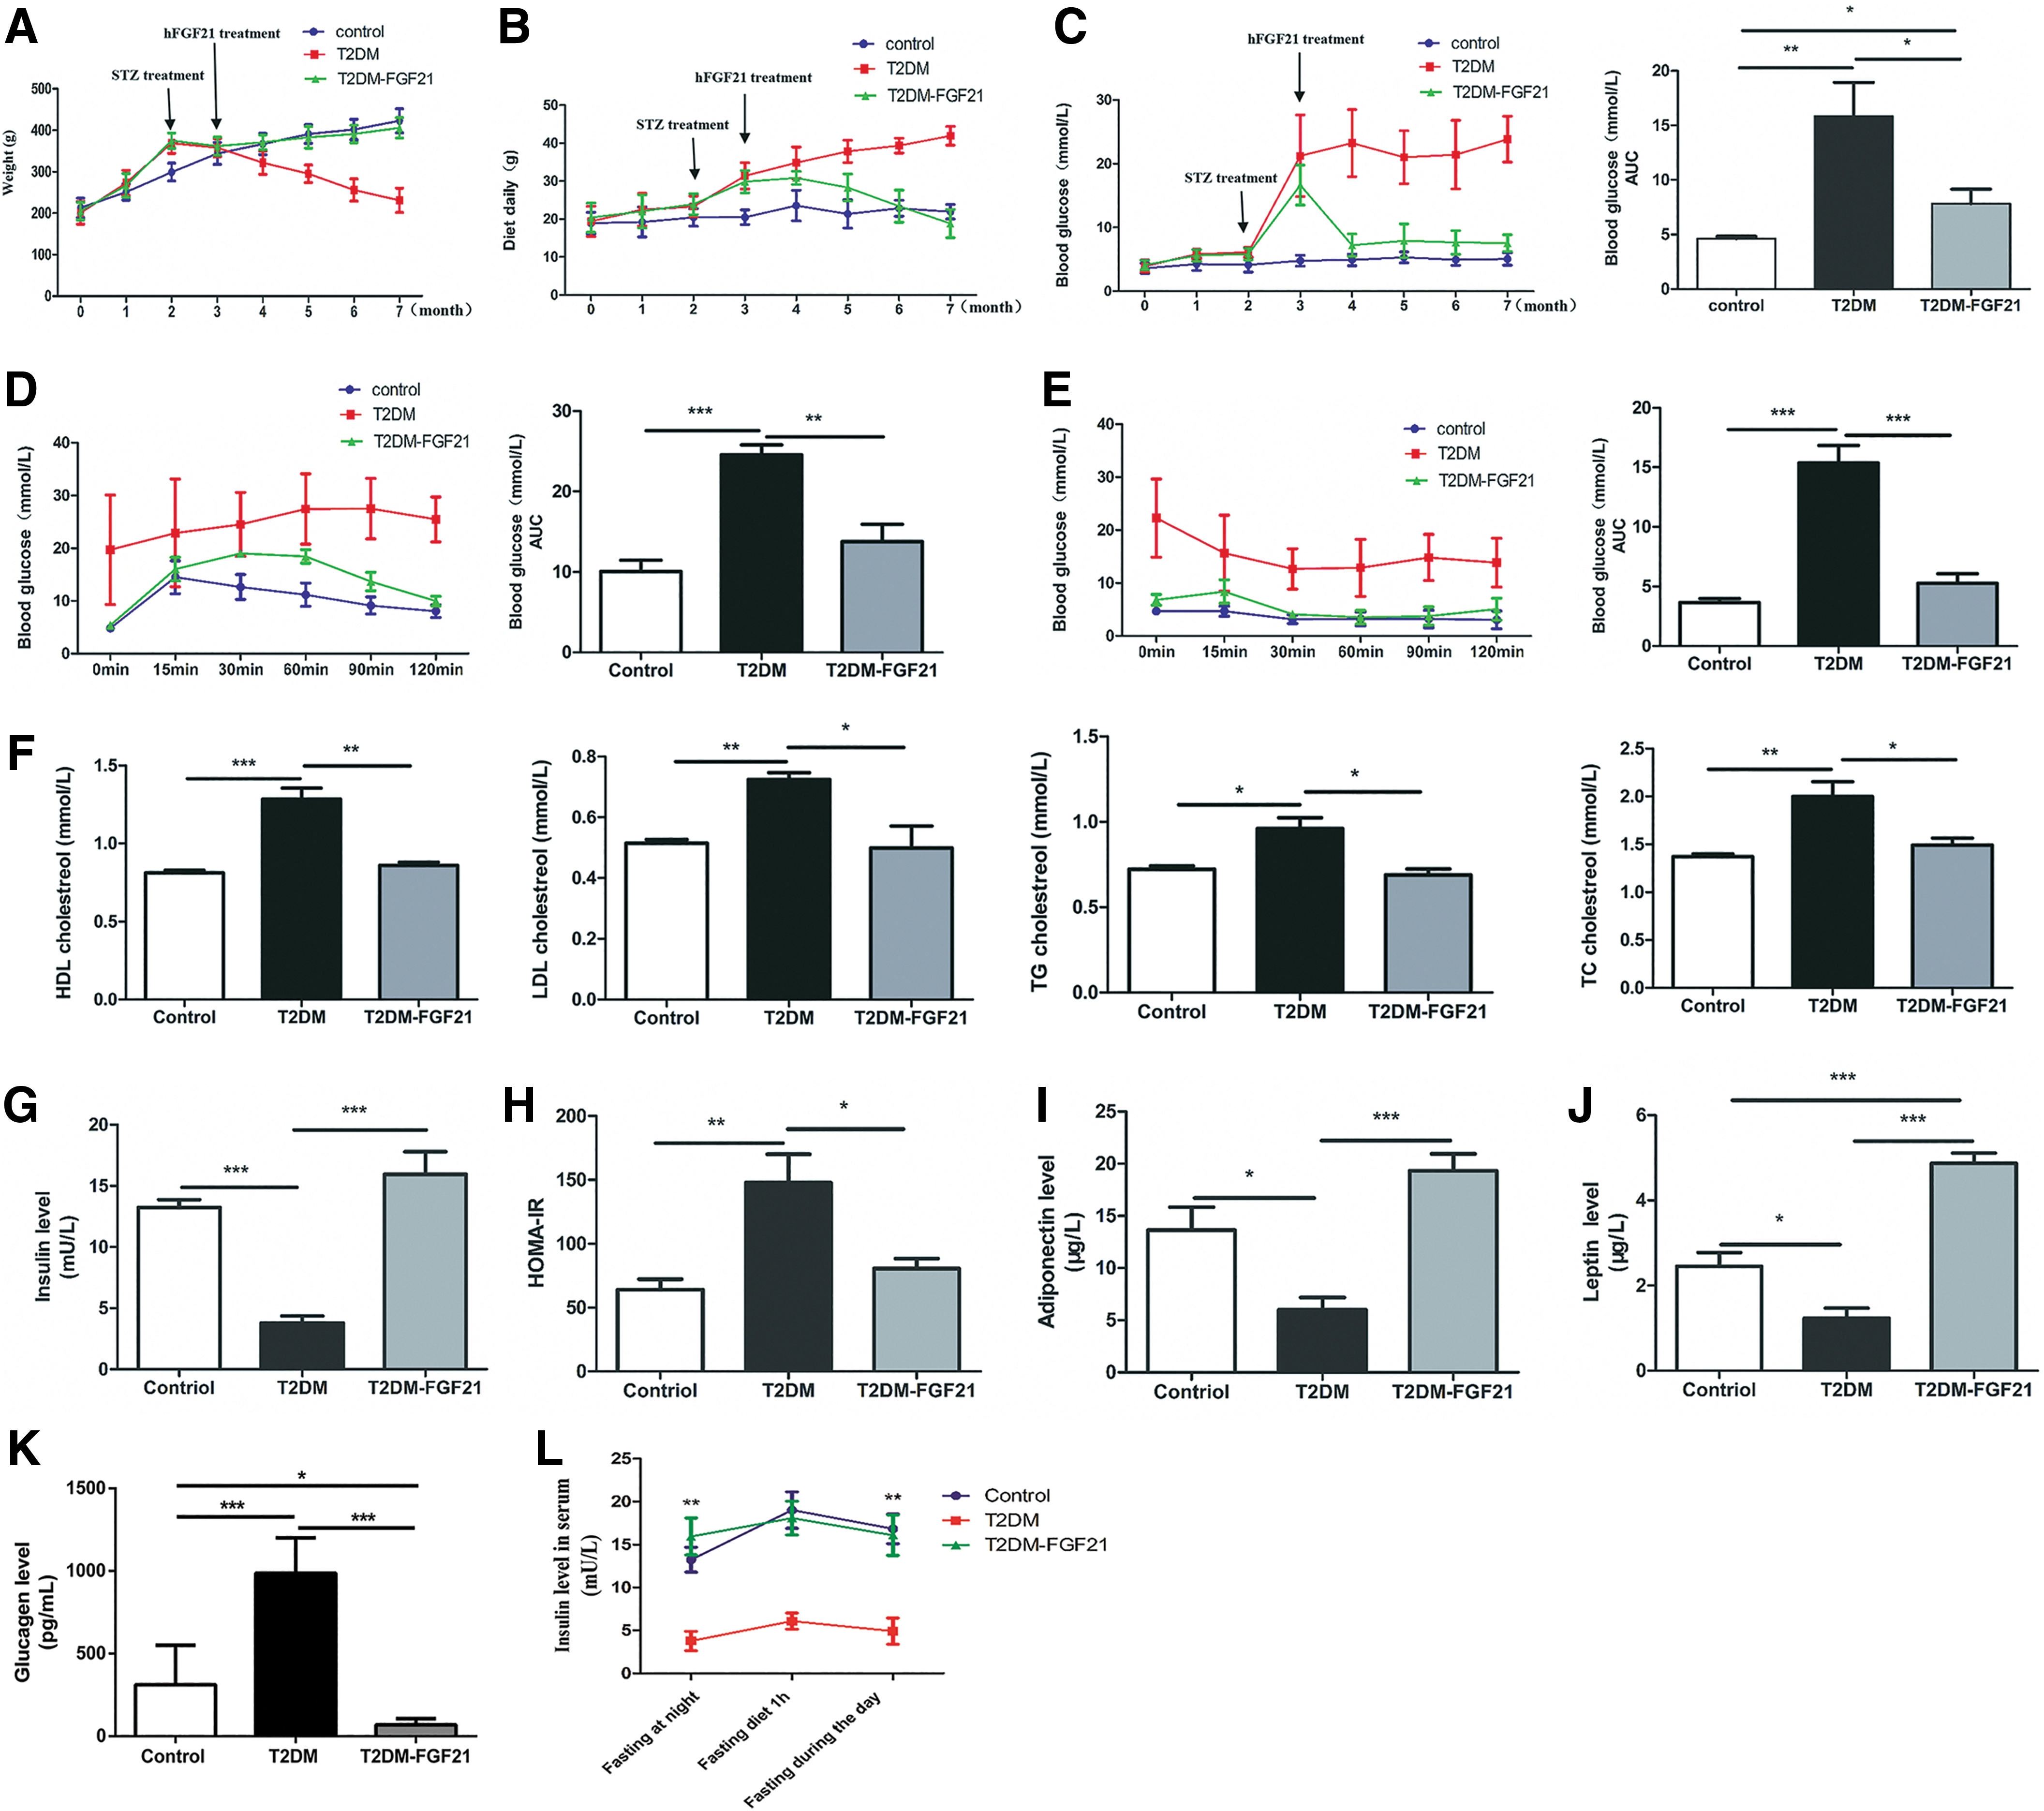
The body weights of rats in the T2DM and T2DM–hFGF21 groups were significantly higher than those in the control group in the first 2 months after T2DM induction. The rats in the T2DM group lost weight monthly due to T2DM rapid progression, whereas the rats in the T2DM–hFGF21 group steadily gained weight after treatment with hFGF21, as did those in the control group (Fig. 2A). Average daily food intake increased in the T2DM–hFGF21 group in the first 3 months, but decreased immediately after hFGF21 injection; food intake was 18.83 ± 3.73 g/day, which was lower than that in the control group. Conversely, the rats in the T2DM group lost weight despite increased food intake, and the food intake was 41.93 ± 2.96 g/day 4 months after T2DM induction (Fig. 2B). Over the 4-month experimental period, the fasting serum glucose concentration in the T2DM group was 22.1 ± 1.29 mM, which continued to increase, and the fasting serum glucose level in the control group was 5.0 ± 0.20 mM. However, the fasting glucose concentration in the T2DM–hFGF21 group decreased to 7.22 ± 1.76 from 16.65 ± 3.15 mM after 1 month of treatment, and it was maintained at that level with slight fluctuations for at least 4 months. According to the area under the curve (AUC) analysis, fasting glucose levels were significantly decreased in the T2DM–hFGF21 group compared with those in the T2DM group (p < 0.05), and the fasting glucose levels were effectively controlled (Fig. 2C). Blood glucose levels were increased during the GTT, and the 2-h blood glucose level was 25.48 ± 4.25 mM, which was far >11.1 mM in the T2DM group. The blood glucose levels reached record values of 30 min after the glucose injection, and the 2-h glucose values were 9.98 ± 0.92 mM after the rats in the T2DM–hFGF21 group had been treated with hFGF21 for 4 months. The 2-h glucose concentrations in the control group were ∼8.05 ± 1.19 mM. AUC analysis of the changes in blood glucose values in the GTT did not reveal significant differences between the T2DM–hFGF21 group and the control group (p > 0.05), but a very significant increase was observed in the T2DM group compared with those in the control group (p < 0.001) (Fig. 2D). According to the ITT, blood glucose levels continued to decrease 15 min after the rats in the T2DM–hFGF21 and control groups received insulin injection. However, the blood glucose level in the T2DM group remained at a higher level than that in the other two groups. AUC analysis did not reveal significant differences in the glucose levels between the rats in the T2DM–hFGF21 and control groups after insulin injection (p > 0.05). The T2DM group exhibited a very significant increase in glucose levels compared with the control group (p < 0.001) (Fig. 2E). Of the four parameters assessed in the blood lipid tests, high-density lipoprotein cholesterol levels were significantly increased in the T2DM group (p < 0.01). The low-density lipoprotein cholesterol, triglyceride (TG), and total cholesterol (TC) levels were significantly increased in the T2DM group compared with those in the control group (p < 0.05), but no significant differences were observed in the T2DM–hFGF21 group (p > 0.05) (Fig. 2F). In addition, 4 months after the rats in the T2DM–hFGF21 group were treated with hFGF21 by liver-targeted injection, the fasting plasma insulin levels were 15.95 ± 2.14 and 13.24 ± 1.43 mU/L, respectively, in the T2DM–hFGF21 and control groups, which were much higher than those in the T2DM group (3.79 ± 1.12 mU/L) (p < 0.001) (Fig. 2G). HOMA-IR in the T2DM–hFGF21 group and control group was 80.60 ± 15.51 and 64.13 ± 24.53, respectively (p > 0.05), but it was significantly lower than that in the T2DM group (147.69 ± 44.96) (p < 0.05) (Fig. 2H). The adiponectin (ADP) concentration in the T2DM–hFGF21 group increased to 19.31 ± 3.65 μg/L, whereas that in the T2DM group was 6.00 ± 3.13 μg/L (p < 0.001) (Fig. 2I). The leptin level in the T2DM–hFGF21 group was 4.78 ± 0.47 μg/L, which was much higher than that in the control group (2.45 ± 0.72 μg/L) and the T2DM group (1.23 ± 0.54 μg/L) (p < 0.001) (Fig. 2J). The glucagon level in the T2DM–hFGF21 group was 69.73 ± 8.51 pg/mL, which was lower than that in the control group (p < 0.05) and the T2DM group (p < 0.001) (Fig. 2K). ELISA results showed that insulin concentrations before feeding and 1 h after feeding were increased by approximately fivefold in the T2DM—hFGF21 group after the rats were treated with hFGF21 for 4 months compared with the T2DM group. There were significant differences in the insulin secreted before or after feeding (p < 0.01) (Fig. 2L).
Clinical biochemical index changes in T2DM rats treated with lentivirus mediate expression of hFGF21.
Histopathological manifestations in the liver and pancreas
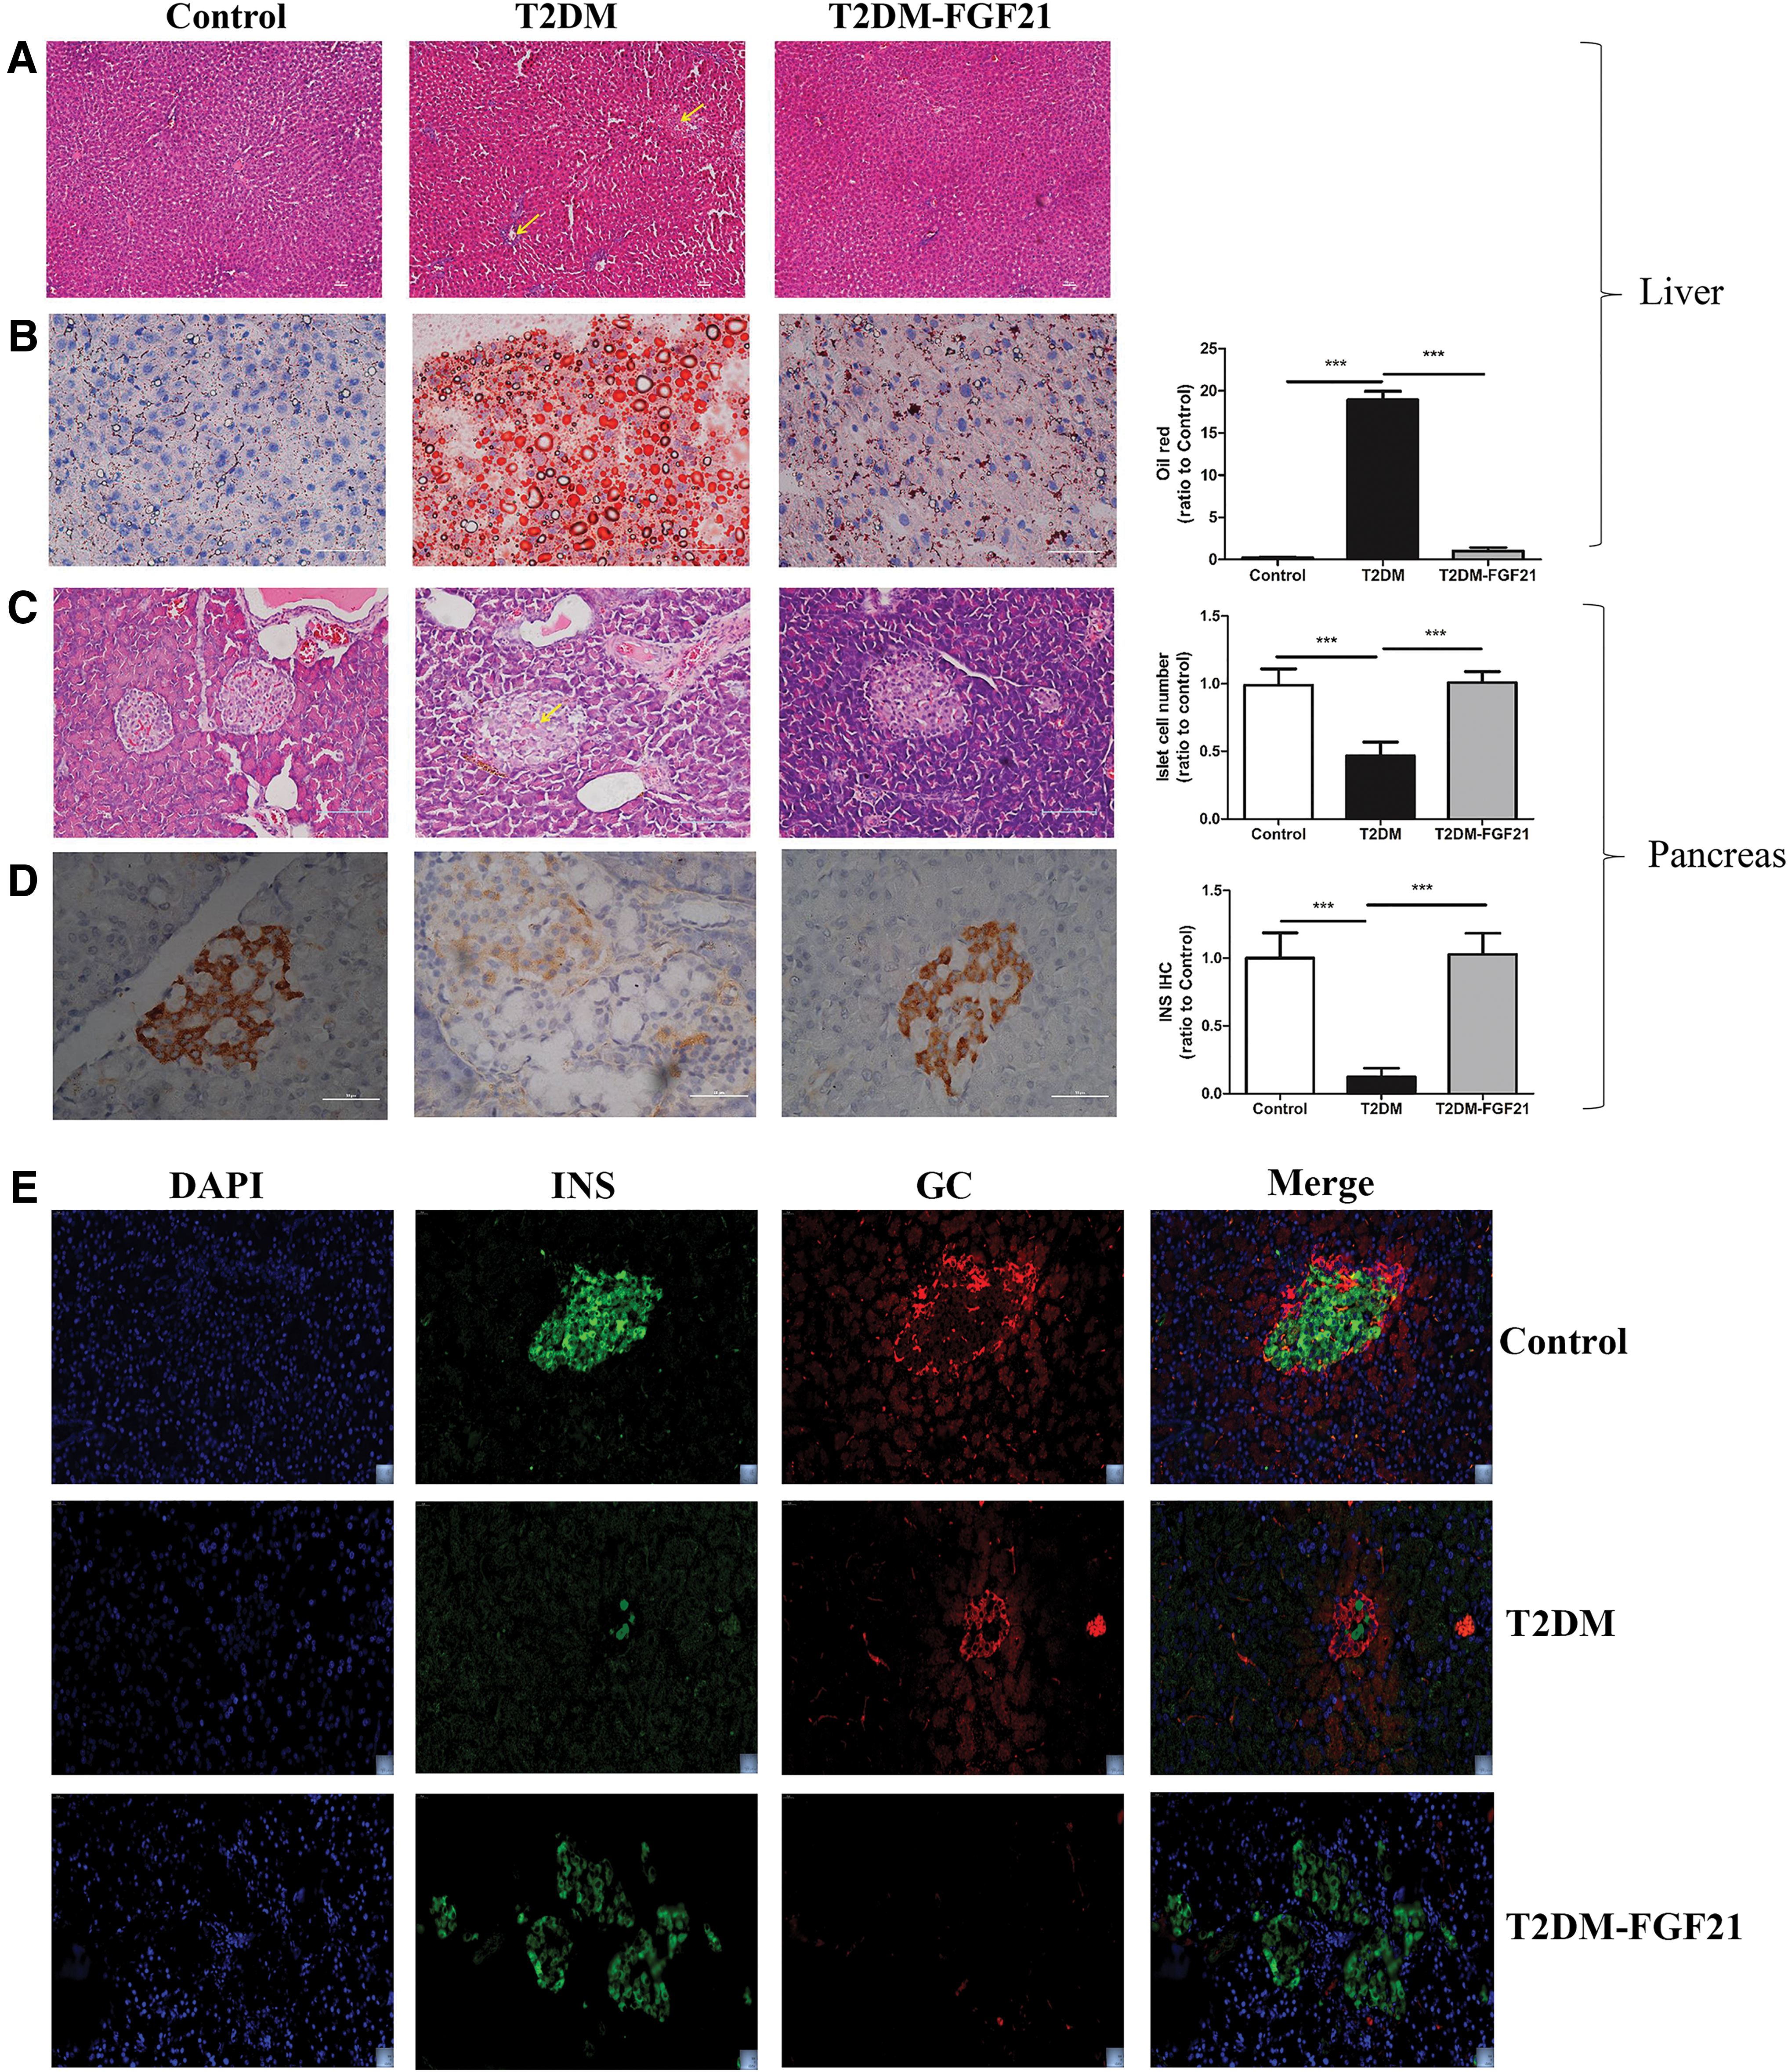
Hematoxylin and eosin-stained liver tissues did not reveal abnormalities in the control group or the T2DM–hFGF21 group. However, in the T2DM group, the central veins in the liver lobe and the nearby liver sinusoids exhibited expanded congestion, and some of the liver cells showed signs of edema and coagulation necrosis (Fig. 3A). The number of adipose droplets stained with Oil Red O was significantly increased in the livers of the T2DM group compared with that in the livers of the control and T2DM–hFGF21 groups (p < 0.001). However, no significant differences were observed between the T2DM–hFGF21 group and the control group (p > 0.05) (Fig. 3B). A substantial number of islet cells were lost in the T2DM group compared with the control group, and a smaller number of islet cells were lost in the T2DM–hFGF21 group (p < 0.001) (Fig. 3C). Immunohistochemical results indicated that insulin levels were markedly increased in the T2DM–hFGF21 group compared with those in the T2DM group (p < 0.001) (Fig. 3D). The double immunofluorescence staining for insulin and glucagon results indicated that insulin expression was increased in the T2DM–hFGF21 group than in the T2DM group, too. But glucagon expression was significantly decreased in islets of the T2DM–hFGF21 group (Fig. 3E).
Histopathological manifestations in the liver and pancreas.
Analysis of glycogen levels and the expression of glucose metabolism-related proteins in the liver and muscle tissues
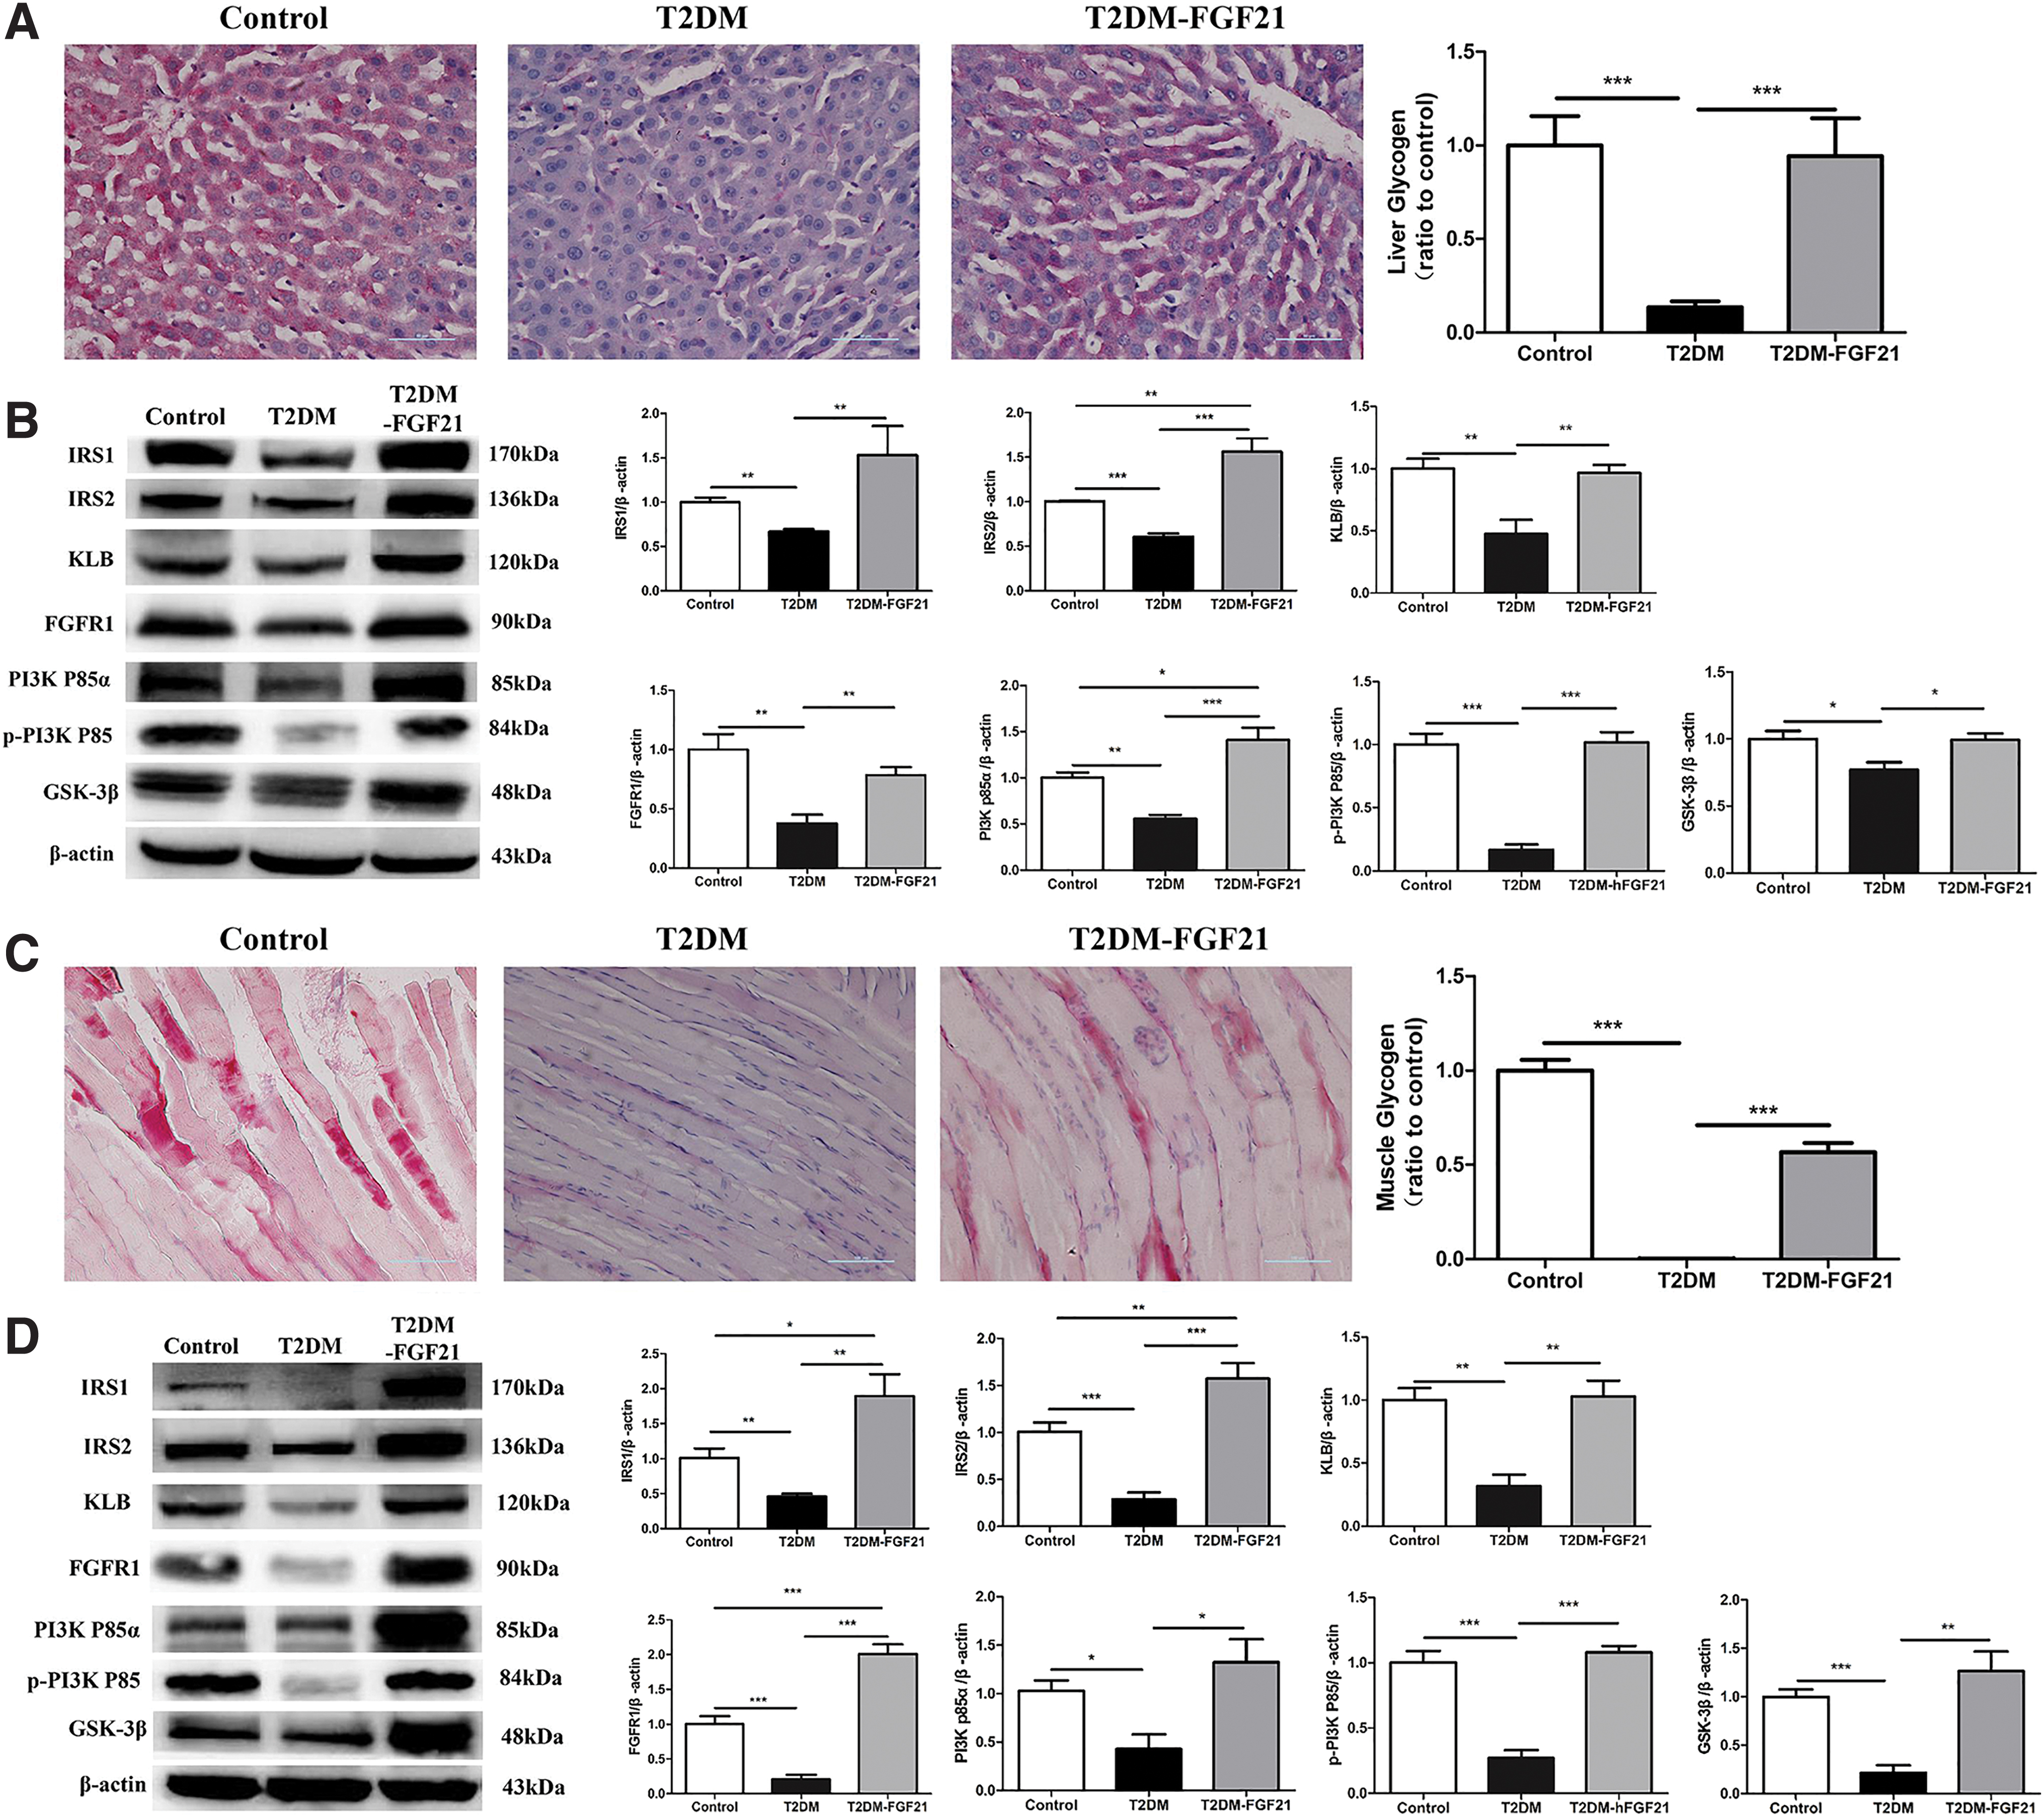
The glycogen content was significantly decreased in the T2DM group (p < 0.001). Interestingly, after hFGF21 treatment, the hepatic glycogen and muscle glycogen contents in the T2DM–hFGF21 group were increased to values similar to those in the control group (p > 0.05) (Fig. 4A, C). IRS-1, IRS-2, KLB, FGFR1, PI3Kp85α, and p-PI3Kp85 expression was significantly decreased in the T2DM group (p < 0.01) compared with the control group, but it was increased in the T2DM–hFGF21 group compared with the T2DM group (p < 0.01). The level of GSK-3β protein was significantly reduced in the T2DM group (p < 0.05) but was increased in the T2DM–hFGF21 group compared with the T2DM group (p < 0.05) (Fig. 4B). In the musculature, the levels of IRS-1, IRS-2, KLB, FGFR1, PI3Kp85α, p-PI3Kp85, and GSK-3β were significantly reduced in the T2DM group but were significantly elevated in the T2DM–hFGF21 group compared with the T2DM group (p < 0.05). In particular, the IRS-1, IRS-2, FGFR1, and PI3Kp85α levels were higher in the T2DM–hFGF21 group than in the control group (p < 0.05) (Fig. 4B, D).
Analyses of glycogen content and expression of proteins related to glucose metabolism in the liver and muscle tissues.
Analysis of indexes of oxidative stress and apoptosis in the liver
After a 4-month treatment with hFGF21, the levels of proteins related to oxidative stress were detected in the liver. The catalase (CAT) content decreased to 0.9 ± 0.13 units in the T2DM group, which was significantly lower than the CAT content in the control group (1.5 ± 0.26 units) and the T2DM–hFGF21 group (1.57 ± 0.23 units) (Fig. 5A). The superoxide dismutase (SOD) content was 0.52 ± 0.03 units in the T2DM–hFGF21 group, which was similar to the SOD content in the control group (0.44 ± 0.08 units) (p > 0.05), but significantly higher than that in the T2DM group (0.25 ± 0.05 units) (p < 0.001) (Fig. 5B). The level of malondialdehyde (MDA) in the T2DM group increased to 6.91 ± 1.38 μmol/mg, which was significantly higher than that in the T2DM–hFGF21 group (1.5 ± 1.41 μmol/mg) and the control group (0.71 ± 0.90 μmol/mg) (Fig. 5C). Using the TUNEL assay, more green-positive signals were detected in the T2DM group than in the other two groups (Fig. 5D). Caspase-3 protein expression was substantially increased in the T2DM group compared with the other two groups as determined by immunohistochemical staining (p < 0.001) (Fig. 5E). The expression of caspase-3 and NFκB protein was significantly increased in the Western blot analyses of tissues from the T2DM group compared with that from the control and T2DM–hFGF21 groups (p < 0.01) (Fig. 5E, F).

Analysis of oxidative stress and apoptosis indexes in the liver.
Discussion
In recent years, research on the biological function of FGF21 has rapidly developed. 17,31 –33 Treatment with a recombinant FGF21 protein improved glycolipid metabolism in animal models of metabolic syndrome and diabetes. 34 –36 However, the disadvantages of treatment with the recombinant FGF21 protein prevented it from becoming a clinical drug. 34 –36 In contrast, owing to the relatively short half-life of the recombinant FGF21 protein, the adaptation of this protein to the needs of physiological rhythm regulation in vivo and to exert a strong biological effect on the regulation of glycolipid metabolism is difficult. 37,38 FGF21 gene therapy was used for treating insulin resistance and obesity, but there has been no such study on T2DM. 25,26,39 –41 Lentiviral vectors, which are modified by some retroviruses, are a temporary assembly of pseudovirus particles that are unable to proliferate but are able to carry foreign genes into host cells and integrate the foreign gene into the host cell genome. Lentiviral vectors are a promising gene therapy tool for the treatment of animal disease models because of their low immunogenicity and transient infection ability, which would generally not cause diffuse infection among the cells and tissue. 42 –47 The EF1a promoter of PLV-EF1a-EGFP[2A]Puro lentiviral vector induces high expression levels of exogenous genes (Supplementary Fig. S6). In this study, local expression in liver tissue was achieved through liver-targeted injection. 48 By administering multiple injections of particles, we successfully induced lentivirus-mediated hFGF21 local expression in the liver and performed its biological functions (Supplementary Fig. S2). The long-term stable expression of lentivirus-mediated hFGF21 in the liver of T2DM rats showed that hFGF21 was involved in regulating and improving glucose metabolism of T2DM animal models. The improvement of T2DM by this method could be similar to the recently reported technique, showing the improvement/normalization of blood glucose level in a T2D animal model, that is, db/db mice. 49
Studies have shown that the fasting plasma glucose levels of T2DM animals are reduced by treatment with recombinant FGF21 protein within 24 h. 31,35,50,51 In addition, improved body conditions are accompanied by a significant decrease in the serum lipid index, 52,53 reversal of hepatic steatosis, and reduction in islet cell loss, among other effects. 34,51,54 Our experimental results confirm the findings of previous studies. It is worth mentioning that the blood glucose content was effectively controlled in T2DM rats for at least 4 months by the gene therapy method. Based on the results of the clinical and histopathological examinations, hFGF21 gene therapy restored the clinical diagnosis indexes of T2DM rats to nearly normal values and effectively controlled the occurrence and development of histopathological abnormalities. Thus, hFGF21 was likely expressed at stable levels in T2DM rats, and its secretion and in vivo biological functions are regulated, thereby producing surprising effects in T2DM rats. In addition, hFGF21 overexpression in vivo was relatively safe (Supplementary Fig. S3). Therefore, FGF21 is a candidate gene for gene therapy because of its nontumorigenic and nontoxic properties, and it has become a promising option for the treatment of T2DM and metabolic syndrome-related diseases, 53 –55 such as insulin resistance, hypoglycemia, dyslipidemia, and obesity. However, according to few research results, hFGF21 has some negative functions, too. Wei et al. 56 showed that long-term expression of FGF21 leads to osteoporosis due to osteopenia. Excess accumulation of FGF21 protein also induces female mouse infertility through the regulation of endocrine hormone secretion. 57,58 These results suggest a great challenge for the use of FGF21 as a therapeutic drug for metabolic diseases and the selection of future drug targets; the results also provide a basis for new research on FGF21 in the regulation of neuroendocrine hormones and bone metabolism. To further elucidate the side effects of using hFGF21 as a type of liver-targeted drug, behavioral experiments, including trajectory record analysis and the climbing pole test, were conducted. Interestingly, the rats in the T2DM–hFGF21 group were not found to be sluggish or possess cognitive impairments (Supplementary Figs. S4, S5). In addition, numbness was not found in this study, which was consistent with the results of ground squirrels treated with FGF21 found by Nelson. 59 FGF21 has been reported to cause bone loss and reproductive hormone dysregulation, which will be investigated in future experiments. Although FGF21 causes some side effects, it is still a promising treatment for severe metabolic disorders and severe diabetes in the elderly.
Activation of Nrf2 and the PI3K/Akt signaling pathway by FGF21 has recently been shown to protect the mouse liver from
It has been shown that FGF21 participates in ROS and inflammatory reactions, which indicates that FGF21 activates kinases and transcription factors to diminish ROS levels 65,66 through the ERK1/2 signaling pathway. In contrast, FGF21 promotes cAMP signaling pathway reporter cAMP-response element binding protein (CREB) expression to inhibit NFκB, resulting in reduced oxidative stress. 67 The analysis of oxidative stress response indexes in the liver from each group showed that the CAT, SOD, and MDA levels were significantly decreased in the T2DM group (p < 0.01), but were normalized by hFGF21 treatment in the T2DM–hFGF21 group. Thus, oxidative stress caused by T2DM was substantially inhibited by hFGF21 expression in the rats. 65,66,68 –70 According to the results of TUNEL staining, apoptotic bodies appeared in the T2DM rats but were not observed in rats from the T2DM–hFGF21 and control groups. Meanwhile, caspase-3 expression was significantly increased in the T2DM group, but no significant differences were observed between the T2DM–hFGF21 group and the control group. Moreover, NFκB expression was very significantly increased in the T2DM group (p < 0.01), 71 but was decreased in the T2DM–hFGF21 group (p < 0.01), which was consistent with the results of the previous experiments.
Conclusion
In this study, we showed preliminary evidence of the feasibility of liver-targeted gene injection using a lentiviral system to deliver hFGF21 into T2DM animal models. This treatment controlled fasting glucose and serum lipid levels and reversed hepatic steatosis, improved glycogen synthesis ability and decreased oxidative stress level in T2DM rat models. More importantly, we found that the decrease of islet cells was controlled and promoted the secretion of insulin. So we will examine the molecular mechanisms by which hFGF21 restores lipid metabolism and reverses hepatic steatosis in T2DM rats and evaluate safety of the treatment strategy in T2DM rat models.
Footnotes
Acknowledgments
We are grateful to Professors Kaili Ma, Tingfu Du, Jiahong Gao, and Hongjun Li.
Author Disclosure
The authors have declared that no conflict of interest exists.
Funding Information
This study was supported by the National Natural Science Foundation of China (Grant No. 81570749), The Talents Project of Yunnan Province (Grant No. 2017HB068), The Special Funds for High-Level Health and Family Planning Technical Personnel training of Yunnan Province (Grant No. D-201653), National Science and Technology Major Project of the Ministry of Science and Technology of China (Grant Nos. 2016ZX08011007-003, 2017ZX09101003-003-008), Yunnan Natural Science Foundation (Grant No. 2013FB089), the Fundamental Research Funds for the Central Universities (Grant No. 33320140083), and CAMS Innovation Fund for Medical Sciences (Grant Nos. 2018-I2M-2-002, 2016-I2M-2-006).
Supplementary Material
Supplementary Data
References
Supplementary Material
Please find the following supplemental material available below.
For Open Access articles published under a Creative Commons License, all supplemental material carries the same license as the article it is associated with.
For non-Open Access articles published, all supplemental material carries a non-exclusive license, and permission requests for re-use of supplemental material or any part of supplemental material shall be sent directly to the copyright owner as specified in the copyright notice associated with the article.