
Abstract
Retroviral insertional mutagenesis (RIM) is both a relevant risk in gene therapy and a powerful tool for identifying genes that enhance the competitiveness of repopulating hematopoietic stem and progenitor cells (HSPCs). However, focusing only on the gene closest to the retroviral vector insertion site (RVIS) may underestimate the effects of RIM, as dysregulation of distal and/or multiple genes by a single insertion event was reported in several studies. As a proof of concept, we examined the common insertion site (CIS) Bcl-xL , which revealed seven genes located within ±150 kb from the RVIS for our study. We confirmed that Bcl-xL enhanced the competitiveness of HSPCs, whereas the Bcl-xL neighbor Id1 hindered HSPC long-term repopulation. This negative influence of Id1 could be counteracted by co-expressing Bcl-xL . Interestingly, >90% of early reconstituted myeloid cells were found to originate from transduced HSPCs upon simultaneous overexpression of Bcl-xL and Id1, which implies that Bcl-xL and Id1 can collaborate to rapidly replenish the myeloid compartment under stress conditions. To directly compare the competitiveness of HSPCs conveyed by multiple transgenes, we developed a multiple competitor competitive repopulation (MCCR) assay to simultaneously screen effects on HSPC repopulating capacity in a single mouse. The MCCR assay revealed that multiple genes within a CIS can have positive or negative impact on hematopoiesis. Furthermore, these data highlight the importance of studying multiple genes located within the proximity of an insertion site to understand complex biological effects, especially as the number of gene therapy patients increases.
Introduction
Retroviruses and their derived vectors are well known to deregulate neighboring genes in the genome where the provirus is inserted, a phenomenon known as retroviral insertional mutagenesis (RIM). RIM has been shown to cause adverse effects in gene therapy settings 1 –4 ; it is also a robust tool to screen for genetic components involved in oncogenesis and stem cell biology. 5 –8 It was demonstrated that sequences of common insertion sites (CIS) recovered from RIM-induced dominant hematopoietic clones overlapped with known stem cell regulators 7 and nonmalignant clonal dominance associated with vector integration site was observed in lentiviral gene therapy. 8,9
Moreover, upregulation of genes located >100 kb from the retroviral vector insertion site (RVIS) 2,10 –12 and dysregulation of multiple neighboring genes by single retroviral vector integrations were reported. 2,12,13 Nonetheless, the dysregulation of genes distal from the RVIS and the cooperative effects of multiple dysregulated genes within the proximity of an RVIS are often overlooked in published descriptions of RVIS. We hypothesized that more than one RVIS neighbor could collaboratively or individually influence hematopoiesis when upregulated by a single integration event.
As a proof-of-principle study, we explored the Bcl-xL locus—a CIS annotated in the Insertional Dominance Database 7,14 and the Retroviral Tagged Cancer Gene Database. 15 The importance of this locus in stem cell biology is highlighted by studies from the International Stem Cell Initiative, which demonstrated that a minimal amplicon duplication at chromosome 20q11.21 containing the ID1 and BCL-XL genes confers competitive advantages to human pluripotent cells independent of culture conditions or cell origin from 38 laboratories worldwide. 16,17
Furthermore, both Bcl-xL and Id1 are also known to regulate the stemness and differentiation of murine hematopoietic stem and progenitor cell (HSPC). BCL-XL, encoded by the gene BCL2-like 1 (BCL2L1), is an antiapoptotic member of the Bcl2 family 18 that has a highly homologous amino acid sequence and protein structure similarity with the better studied BCL2 protein. 19 Both Bcl2 and Bcl-xL were shown to enhance hematopoietic cell survival, 20 and their overexpression led to increased murine HSPC numbers and repopulating potential. 21 –25 ID1 (Inhibitor of DNA binding 1) is a helix-loop-helix (HLH) protein that forms heterodimers with the basic HLH transcription factors. 26,27 ID1 is expressed in hematopoietic stem cells (HSC), 28,29 and Id1 knock-out mice showed reduced HSPC numbers with impaired engraftment capacity. 28,29 Id1 also affected cell fate decisions in vivo when overexpressed in HSPCs, notably by impaired B cell production and promoted myeloid differentiation. 30 –33
In addition to Bcl-xL and Id1, six other protein-coding genes (H13, Mcts2, Cox4i2, Tpx2, Mylk2, and Fkhl18) are located within ±150 kb of the Bcl-xL -RVIS. To understand whether numerous genes can influence the competitiveness of HSPCs using conventional transplantation settings, individual genes of interest (GOI) have to be studied in different subsets of recipient mice, which requires high numbers of mice. As our interest was to measure the competitiveness of HSPCs conveyed by different transgenes, we developed a multiple competitor competitive repopulation (MCCR) assay to simultaneously screen multiple transgenes for effects on HSPC repopulating capacity in a single mouse. The MCCR assay allowed us to reduce the number of mice required to measure transgene effects on HSPC engraftment in vivo.
Surprisingly, we found that the overexpression of Id1 led to the reduced competitive output of Id1-HSPC after transplantation. However, coexpressing Bcl-xL restored the competitive output of Id1-expressing HSPCs. Coexpressing Bcl-xL and Id1 also contributed to rapid generation of myeloid cells shortly after transplantation. Our work presents an approach to understand complex insertional mutagenic effects in one genomic locus as we found that multiple genes surrounding a single common RVIS when upregulated can influence hematopoiesis individually or even collaboratively.
Materials and Methods
Lentiviral vectors production
The complementary DNAs (cDNAs) for H13, Id1, Cox4i2, Bcl-xL , Tpx2, Mylk2, and Fkhl18 were each cloned into individual third-generation self-inactivating lentiviral vectors (LVs), in between an internal spleen focus-forming virus (SFFV) promoter and the internal ribosomal entry site, which preceded the enhanced green fluorescence protein (eGFP). 34 For eGFP vector control, a non-coding spacer sequence (Spcr; 243 bp) was inserted for tagging purposes. The vector coexpressing Bcl-xL and Id1 (BI) was cloned by fusing the cDNA of Bcl-xL and Id1 with porcine teschovirus-1 2A self-cleaving peptides (P2A; Fig. 1A). Lentiviral supernatants were produced, concentrated, and titrated as previously described. 35,36
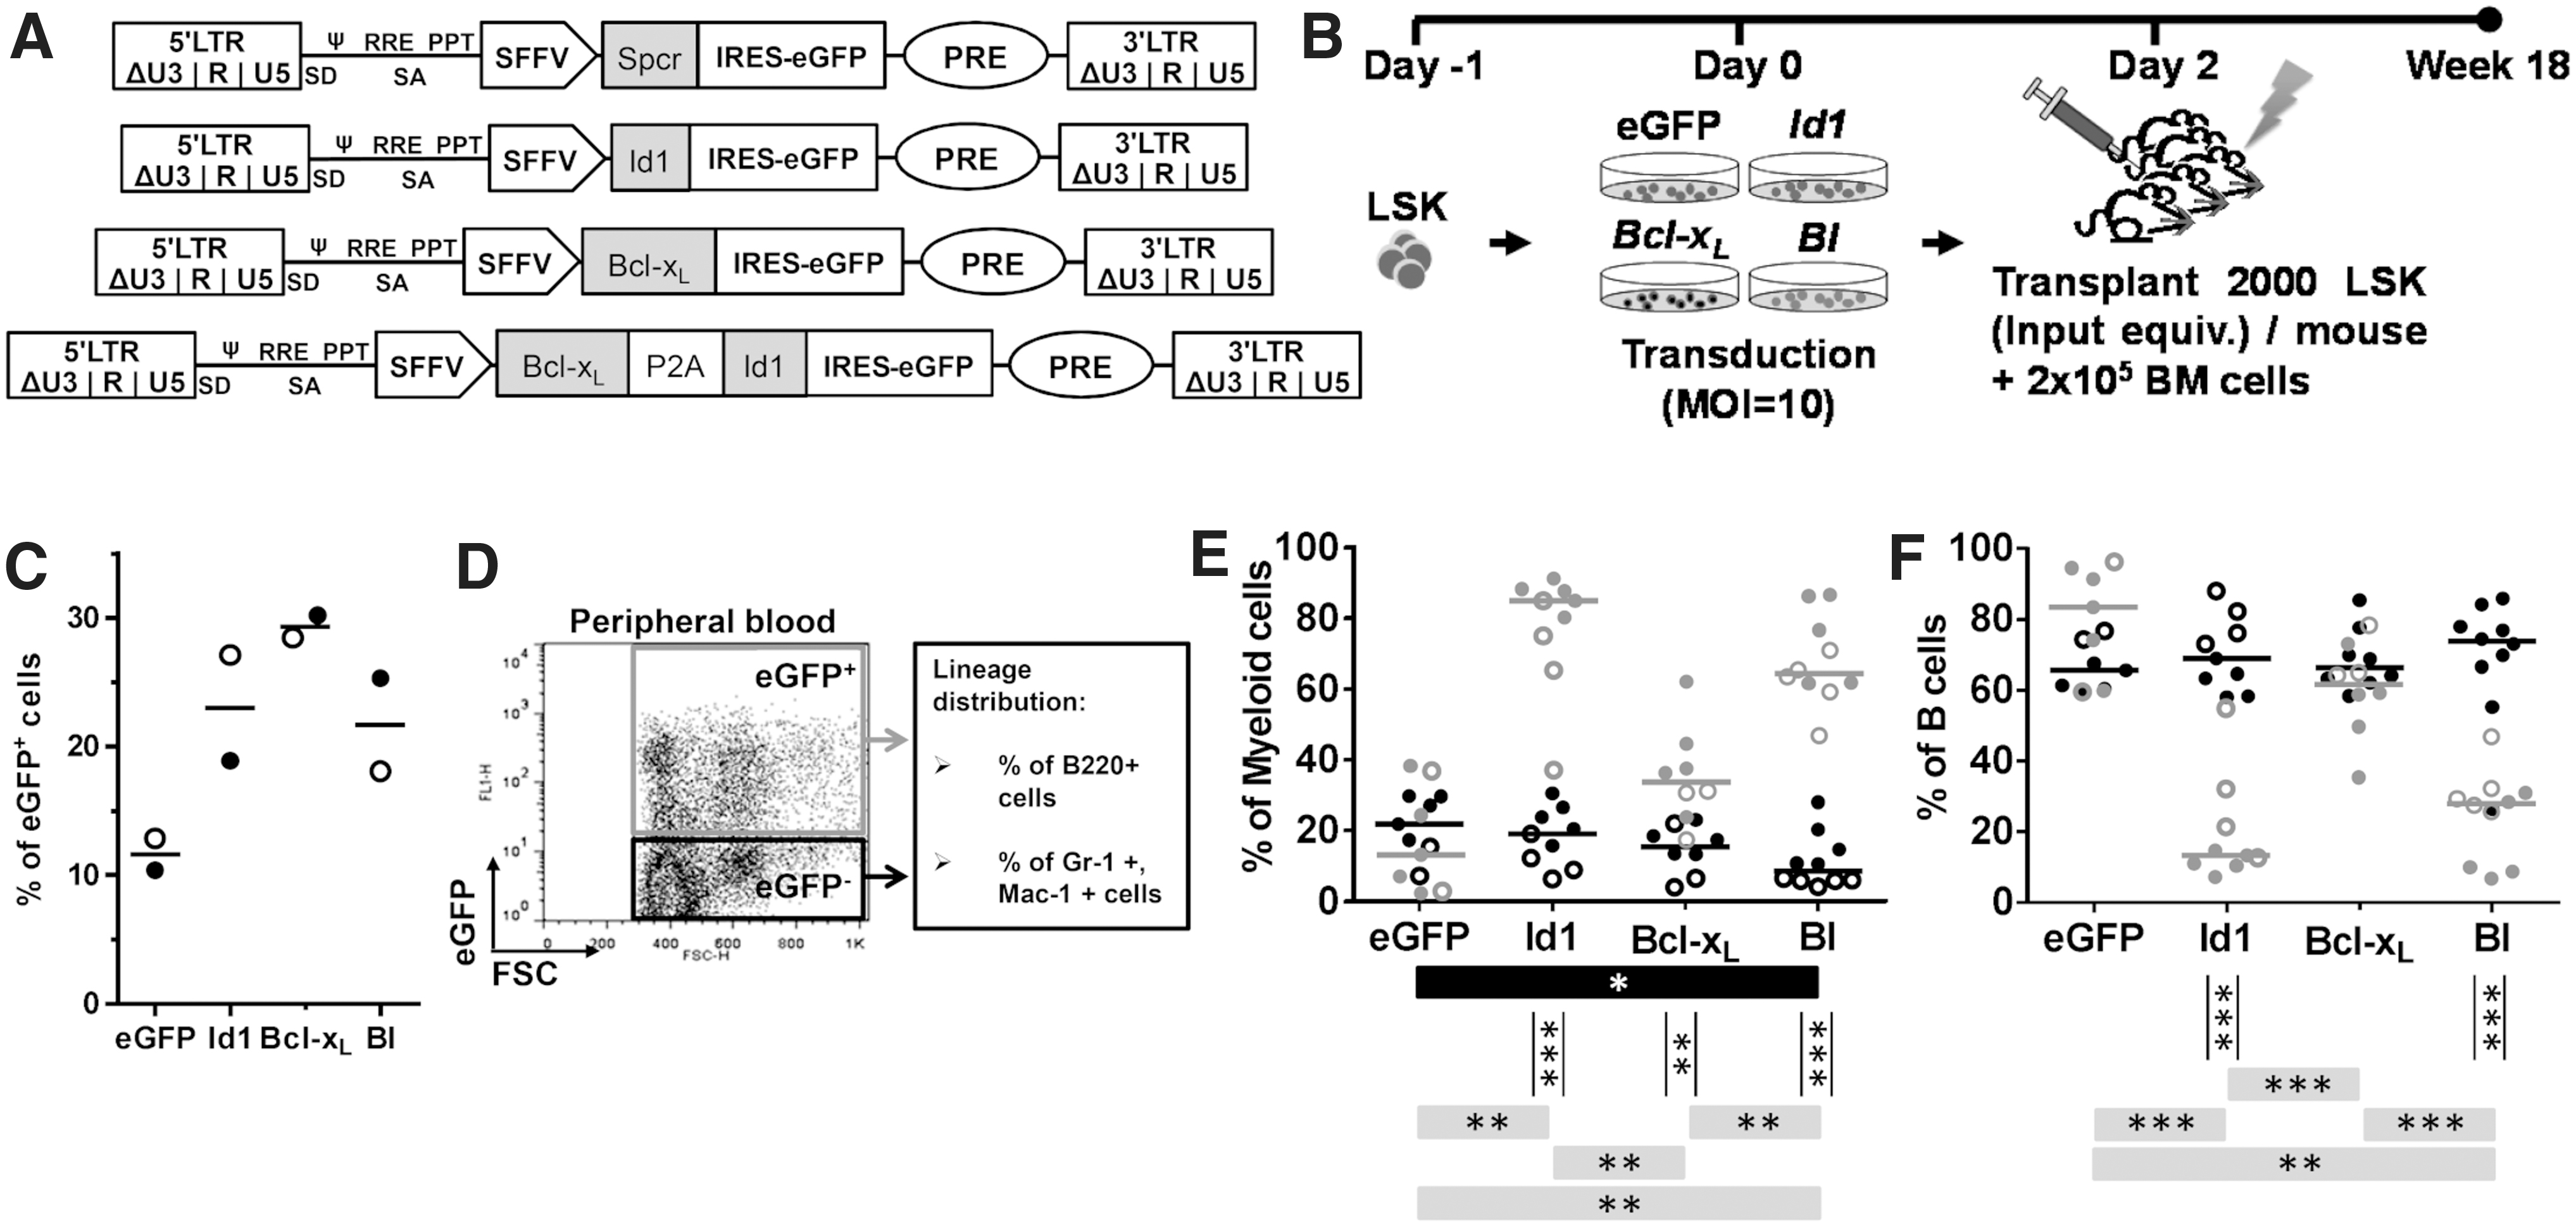
Id1-overexpressing HSPCs impaired B lineage.
Cell sorting and flow cytometric analysis
LSK (Lineage−, Sca-1+, and c-Kit+) cells were sorted from bone marrow (BM) cells of C57BL/6J mice (Janvier Labs, Le Genest-Saint-Isle, France). Briefly, BM cells were stained with biotin anti-mouse lineage panel (Cat.133307; Biolegend, London, UK) and subsequently stained with FITC-Streptavidin (Cat.405201), PE-Sca-1 (Cat.108108) and APC-c-Kit (Cat.105812). To isolate B220+, CD3e+, and myeloid (Gr-1+, CD11b+) cells from recipient BM, PE-CD3e (Cat.100308), PE-Cy7-B220 (Cat.103222), APC-Gr-1 (Cat.108412), and APC-CD11b (Cat.101212) antibodies were used. Cells were stained with 1 μg/mL 4’,6-diamidino-2-phenylindole (Cat.D8417; Sigma-Aldrich) before sorting. To analyze leukocyte composition from peripheral blood (PB), PE-B220 (Cat.103208), PE-CD3e, APC-CD11b, and APC-Gr-1 antibodies and 1 μg/mL propidium iodide (Cat.81845; Sigma-Aldrich) were used. All BM and PB were first blocked with CD16/32 (Cat.14-0161-86; eBioscience, Frankfurt, Germany) antibody after NH4Cl-mediated erythrocyte lysis. Samples were sorted with FACSAria II or analyzed on a FACSCalibur flow cytometer (Becton Dickinson, Heidelberg, Germany). All antibodies were purchased from Biolegend unless otherwise specified and were titrated before use.
Transduction of LSK HSPCs
After isolation and until the point of transplantation, LSK cells were cultured in HSPC expansion medium (StemSpan medium; Stem Cell Technologies, Vancouver, Canada) supplemented with STIF cocktail (50 ng/mL murine stem cell factor, 20 ng/mL murine thrombopoietin, 20 ng/mL murine insulin-like growth factor 2, and 10 ng/mL human fibroblast growth factor 1; all from Peprotech, Hamburg, Germany), 2% penicillin/streptomycin, and 1% glutamine (PAA, Pasching, Austria). Cells were prestimulated overnight before transduction with LV preloaded on RetroNectin (TaKaRa, Otsu, Japan)-coated culture plates. 37 Transduction efficiencies were estimated by measuring the percentage of eGFP+ cells 48 h after transduction of primary cells and before transplantation.
Transplantation and MCCR assay
C57BL/6J recipients were lethally irradiated (10 Gy) 1 day before transplantation. Each primary recipient received 2,000 LSK cells (input equivalent) after LV transduction along with 2 × 10⁵ BM cells. For secondary transplantation, BM cells from 2 to 4 primary recipients with a comparable level of eGFP marking were pooled, and 2 × 10⁶ BM cells were transplanted into each secondary recipient. For the MCCR assay, LSK cells were transduced with individual GOI-LV and individual GOI-HSPCs were pooled for transplantation. Each recipient received 8,000 or 16,000 (input equivalent; 2,000 per GOI-transduced group) pooled cells along with 2 × 10⁵ freshly isolated BM cells. In all transplantation settings, LV-tagged (transduced) and non-LV-tagged (nontransduced) cells for a given GOI-transduction procedure were transplanted as bulk without prior sorting for transduced cells. Drinking water containing 100 mg/mL ciprofloxacin (Bayer Vital GmbH, Leverkusen, Germany) was given to all recipients for 2 weeks following irradiation. PB was collected every 6 weeks after transplantation before mice were sacrificed during week 18. All animal experiments were approved by the local government and accomplished according to the rules of the central animal facility.
Vector copy number determination and population composition in the MCCR assay
Vector copy number (VCN) was determined by quantitative PCR (qPCR) as previously described. 36,38 In MCCR assays, transgene-specific primers (Supplementary Table S1) were used to differentiate individual GOI-transduced populations and normalized against the number of total LV integrants by measuring the DNA sequence of woodchuck hepatitis virus posttranscriptional element within the viral construct. qPCR was performed in technical triplicates using Quantitect SYBR Green Kit (Qiagen, Hilden, Germany) on a StepOnePlus System (Applied Biosystems, Foster City, CA).
INSPIIRED-PCR and Illumina sequencing
INSPIIRED-PCR data were processed as described in Sherman et al. 39 Genomic DNA samples were resuspended in 120 μL nuclease-free water and subjected to shearing with Covaris 220 (Covaris Ltd., Brighton, UK) in AFA fiber microtubes (Covaris Ltd.) for 60 s (peak power of 50 W, 5% duty factor, 200 cycles/burst, and 4°C water temperature). Samples were purified with AMPure XP beads (Beckman Coulter GmbH, Krefeld, Germany) using a 0.7-fold bead to sample ratio. After using the NEBNext Ultra End Repair/dA-Tailing Module (New England Biolabs; NEB, Frankfurt am Main, Germany), linkers (linker blunt + sample-specific linker) were ligated with the NEBNext Ultra Ligation Module (NEB). Ligated samples were purified with AMPure XP beads (0.7-fold bead to sample ratio) and used in exponential PCR1 (20 cycles) using Clontech Advantage PCR kit (Takara Bio Europe SAS, Saint-Germain-en-Laye, France) with the addition of linker-specific primers (300 nM), long terminal repeats (LTR)-specific primer 1 (300 nM), blocking oligo (1 μM), dNTPs (200 nM), and linker-ligated DNA (0.6 v/v ratio). Products from PCR1 were used as a template for PCR2 (15 cycles) with a 0.08 v/v ratio to the complete sample volume. Specific index primers and sample-specific linker primers were used in all reactions (sequences available upon request). Products from PCR2 were subjected to quality control using 2% TAE-buffered agarose gel visualization and/or by Qubit Fluorometer (ThermoFisher, Foster City, CA) before being mixed in equal volumes to generate final libraries (six individual libraries were generated to cover all samples). The library was further purified with two rounds of AMPure XP beads (0.7-fold and 0.6-fold ratio of beads to sample volume) and transferred to the Hannover Medical School Research Core Unit Genomics (RCUG) for quality control using Bioanalyzer 2100 (Agilent Technologies Germany GmbH & Co. KG, Waldbronn, Germany) and analyzed on an Illumina sequencer (Illumina Inc., San Diego, CA).
LV insertion site analysis
Data from Illumina sequencing were processed as described by Berry et al. 40 Scripts required for INSPIIRED pipeline were acquired from GitHub. Sequence data in FASTQ format were demultiplexed based on the index primers used in PCR2. A quality score of 30, corresponding to an error probability of 0.001, was used as a quality threshold. A total of 5 bp below the quality threshold per amplicon was allowed and a quality sliding window of 10 bp was chosen. Processing parameters, such as: 1. Start of the alignment no later than five bp after the LTR; 2. a maximum fragment length of 2500 bp; and 3. a minimal overlap with reference genome of 20 bp with 95% homology, were set in the INSPRIIRED bioinformatics pipeline. Individual files were aligned and annotated to the mouse genome build mm9. Protein-coding genes located within ±150 kb from the integration site were compared with oncogene and stem cell-related gene (OSCG) databases. Oncogene databases used as references include the Network of Cancer Genes 6.041 and “allOnco” cancer gene list 40 compiled by the Bushman group. For stem cell-related genes, we referred to the HSC-Explorer database 42 and matched against genes that (1) increased or maintained self-renewal, (2) increased HSC quantity, (3) decreased HSC differentiation, (4) had increased expression in HSC compared to later progeny, and (5) were expressed in other stem cell types.
Statistics and plots
Graphs and statistical analyses were done with Prism 5 (GraphPad Software, San Diego, CA) using the Mann–Whitney test to compare medians unless otherwise specified, and Benjamini–Hochberg correction was applied for multiple comparisons.
Results
Id1 impaired B-lymphopoiesis with a bias toward myelopoiesis
Both Bcl-xL and Id1 are known to influence HSPC fate. To mimic the upregulation of single or multiple genes in the context of RIM, we overexpressed Id1 and Bcl-xL individually or simultaneously (BI) in HSPCs with LVs (Fig. 1A). A total of 2,000 LSK cells were cultured in serum-free HSPC expansion medium (StemSpan with STIF cytokine cocktail) 43 and transduced with Id1, Bcl-xL , BI, or control LV at an multiplicity of infection of 10. Transduced cell populations were transplanted into lethally irradiated mice without prior sorting so that transplanted cell populations also contained nontransduced cells that were subjected to identical treatment as the transduced cells, with the exception that non-transduced cells were not influenced by the transgene and vector integration (Fig. 1B).
All vectors express eGFP as a reporter, and pretransplant transduction efficiencies were 10–30% (Fig. 1C). PB samples were analyzed every 6 weeks over the 18-week experiment. Overall, the numbers of white blood cells (WBCs), red blood cells, and platelets in the donors were similar and remained within the normal blood count range (Supplementary Fig. S1A). No bias in lineage distribution was found in most transplanted mice across different transplant groups (Supplementary Fig. S1B). However, comparison of transgene-positive (eGFP+) and transgene-negative (eGFP−) PB fractions (Fig. 1D) showed that Id1-expressing HSPCs were biased toward myeloid lineages (Fig. 1E) and had reduced B-lineage contribution (Fig. 1F) regardless of Bcl-xL coexpression.
Bcl-xL enhanced progeny output of HSPCs by producing more mature blood cells
To compare the competitiveness of the different transgene groups (ctrl, Id1, Bcl-xL , and BI), the number of eGFP+ or eGFP− WBCs in the PB of the recipients was normalized to the number of transplanted eGFP+ or eGFP− LSK cells (Fig. 1C), and the amount of progeny generated by a single LSK cell in each recipient was compared among transgene-positive fractions (Fig. 2) and between transgene-positive and transgene-negative fractions in each recipient (Supplementary Fig. S2A–D). The Id1-LSK cells produced similar amounts of mature progeny as the eGFP control group, but fewer than the Bcl-xL or BI groups (Fig. 2A–D), even though the transduction rate of Id1-LSK was twofold higher (comparable to Bcl-xL and BI) than the vector control LSK. The output capacity of Id1 cells was gradually lost over time (Fig. 2A–C), while the nontransduced progeny output within the Id1 animals remained stable (Supplementary Fig. S2A–C).
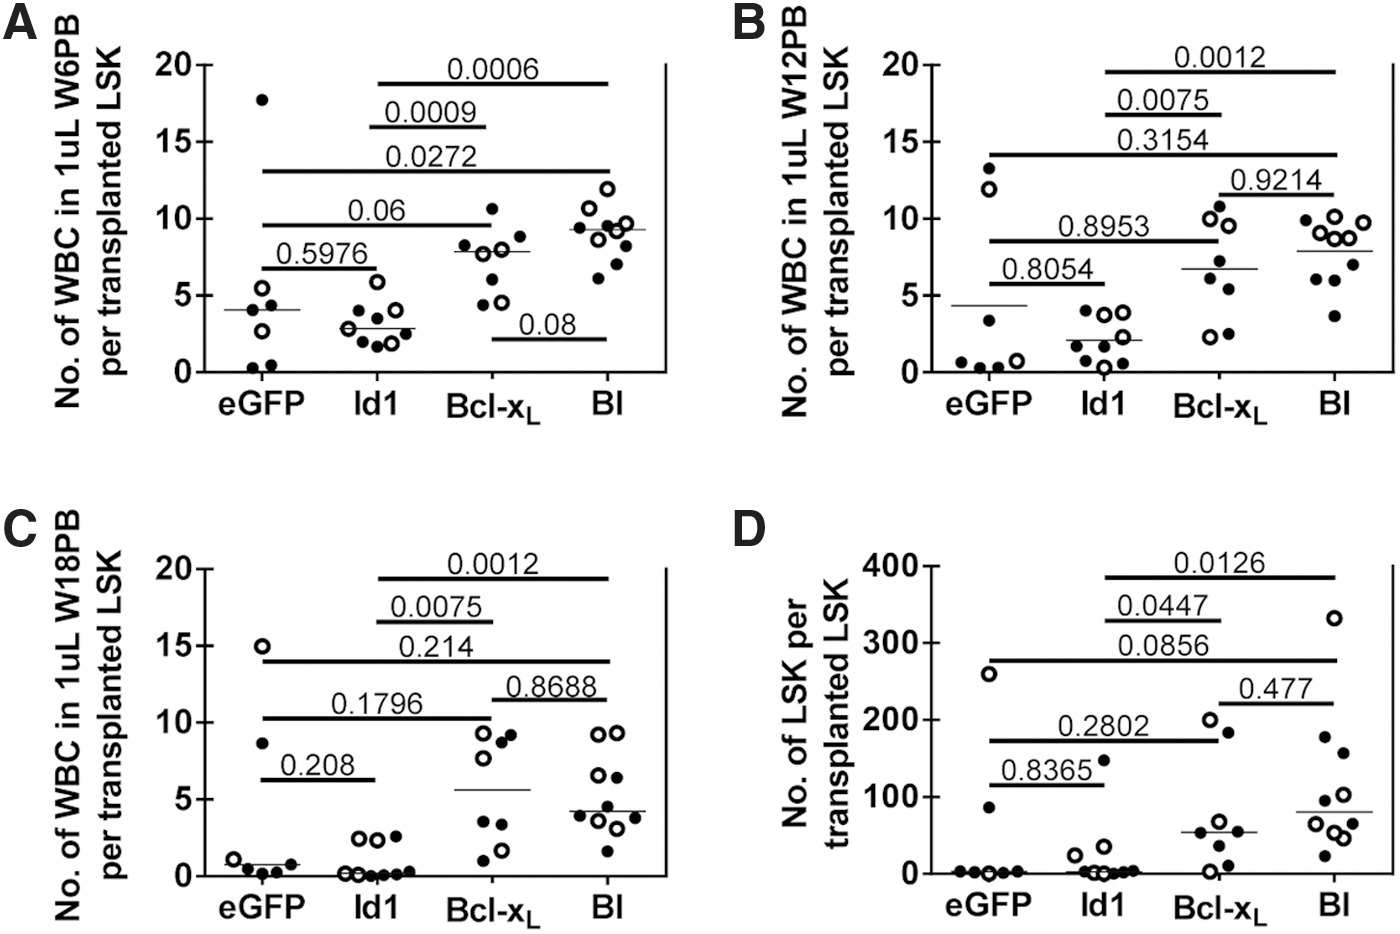
Progeny output from a single transplanted LSK cell. The number of WBCs in 1 μL of PB was divided by the number of transplanted LSK cells based on eGFP positivity. The resulting progeny output from a single transplanted GOI-LSK cell in 1 μL of PB obtained at
After 18 weeks, only 3 (out of 9) Id1 primary recipient animals had transgene-positive cells that were above 3% in the PB (28%, 17%, and 32%; Supplementary Fig. S3A). A similar trend was also observed in the eGFP vector control group, where the vector-transduced LSK cells failed to generate progeny in several animals throughout the experiment (Fig. 2B, C; Supplementary Figs. S2 and S3). In contrast, all Bcl-xL -overexpressing HSPCs exhibited enhanced progeny output compared to the nontransduced cells transplanted in the same animal (Supplementary Fig. S2A–C), regardless of Id1 coexpression, and outperformed both the eGFP control and Id1 alone (Fig. 2A–C). This competitive advantage can also be seen in the LSK-gated BM fractions (Fig. 2D; Supplementary Fig. S2D). Id1 expression in the BM of secondary transplanted animals was 7- to 12-fold higher in the eGFP+ fraction in the Id1-group, and 16- to 37-fold higher in the BI-group. Bcl-xL expression was about 80-fold higher in BM from the Bcl-xL group and 18- to 54-fold higher in BM from the BI group (Supplementary Fig. S3B).
Loss of Id1-HSPCs in recipient hematopoietic systems
As the transgene-positive cells were measured by surrogate eGFP expression, the decrease of eGFP+ cells in the Id1 and vector control groups can either be caused by the reduction of the transduced cell population or vector silencing. To analyze the presence of gene-modified cells, genomic DNA from recipient BM was subjected to qPCR to determine the VCN, and INSPIIRED-PCR followed by Illumina sequencing for vector insertion site (VIS) analyses. Both the VCN and the number of VIS recovered from the BM of Id1 primary and secondary recipients were significantly lower compared to Bcl-xL or BI recipients (Fig. 3A–C). The VCN and VIS analyses suggested that the Id1-HSPC population diminished, but not that the expression cassette was silenced. Plotting the number of VIS recovered from BM of primary recipients from Fig. 3B against the transduction rate of transplanted LSK shown in Fig. 1C revealed that the number of VIS recovered in the Id1 group was low (Fig. 3D), even though the initial transduction rate was comparable to the Bcl-xL and BI groups.
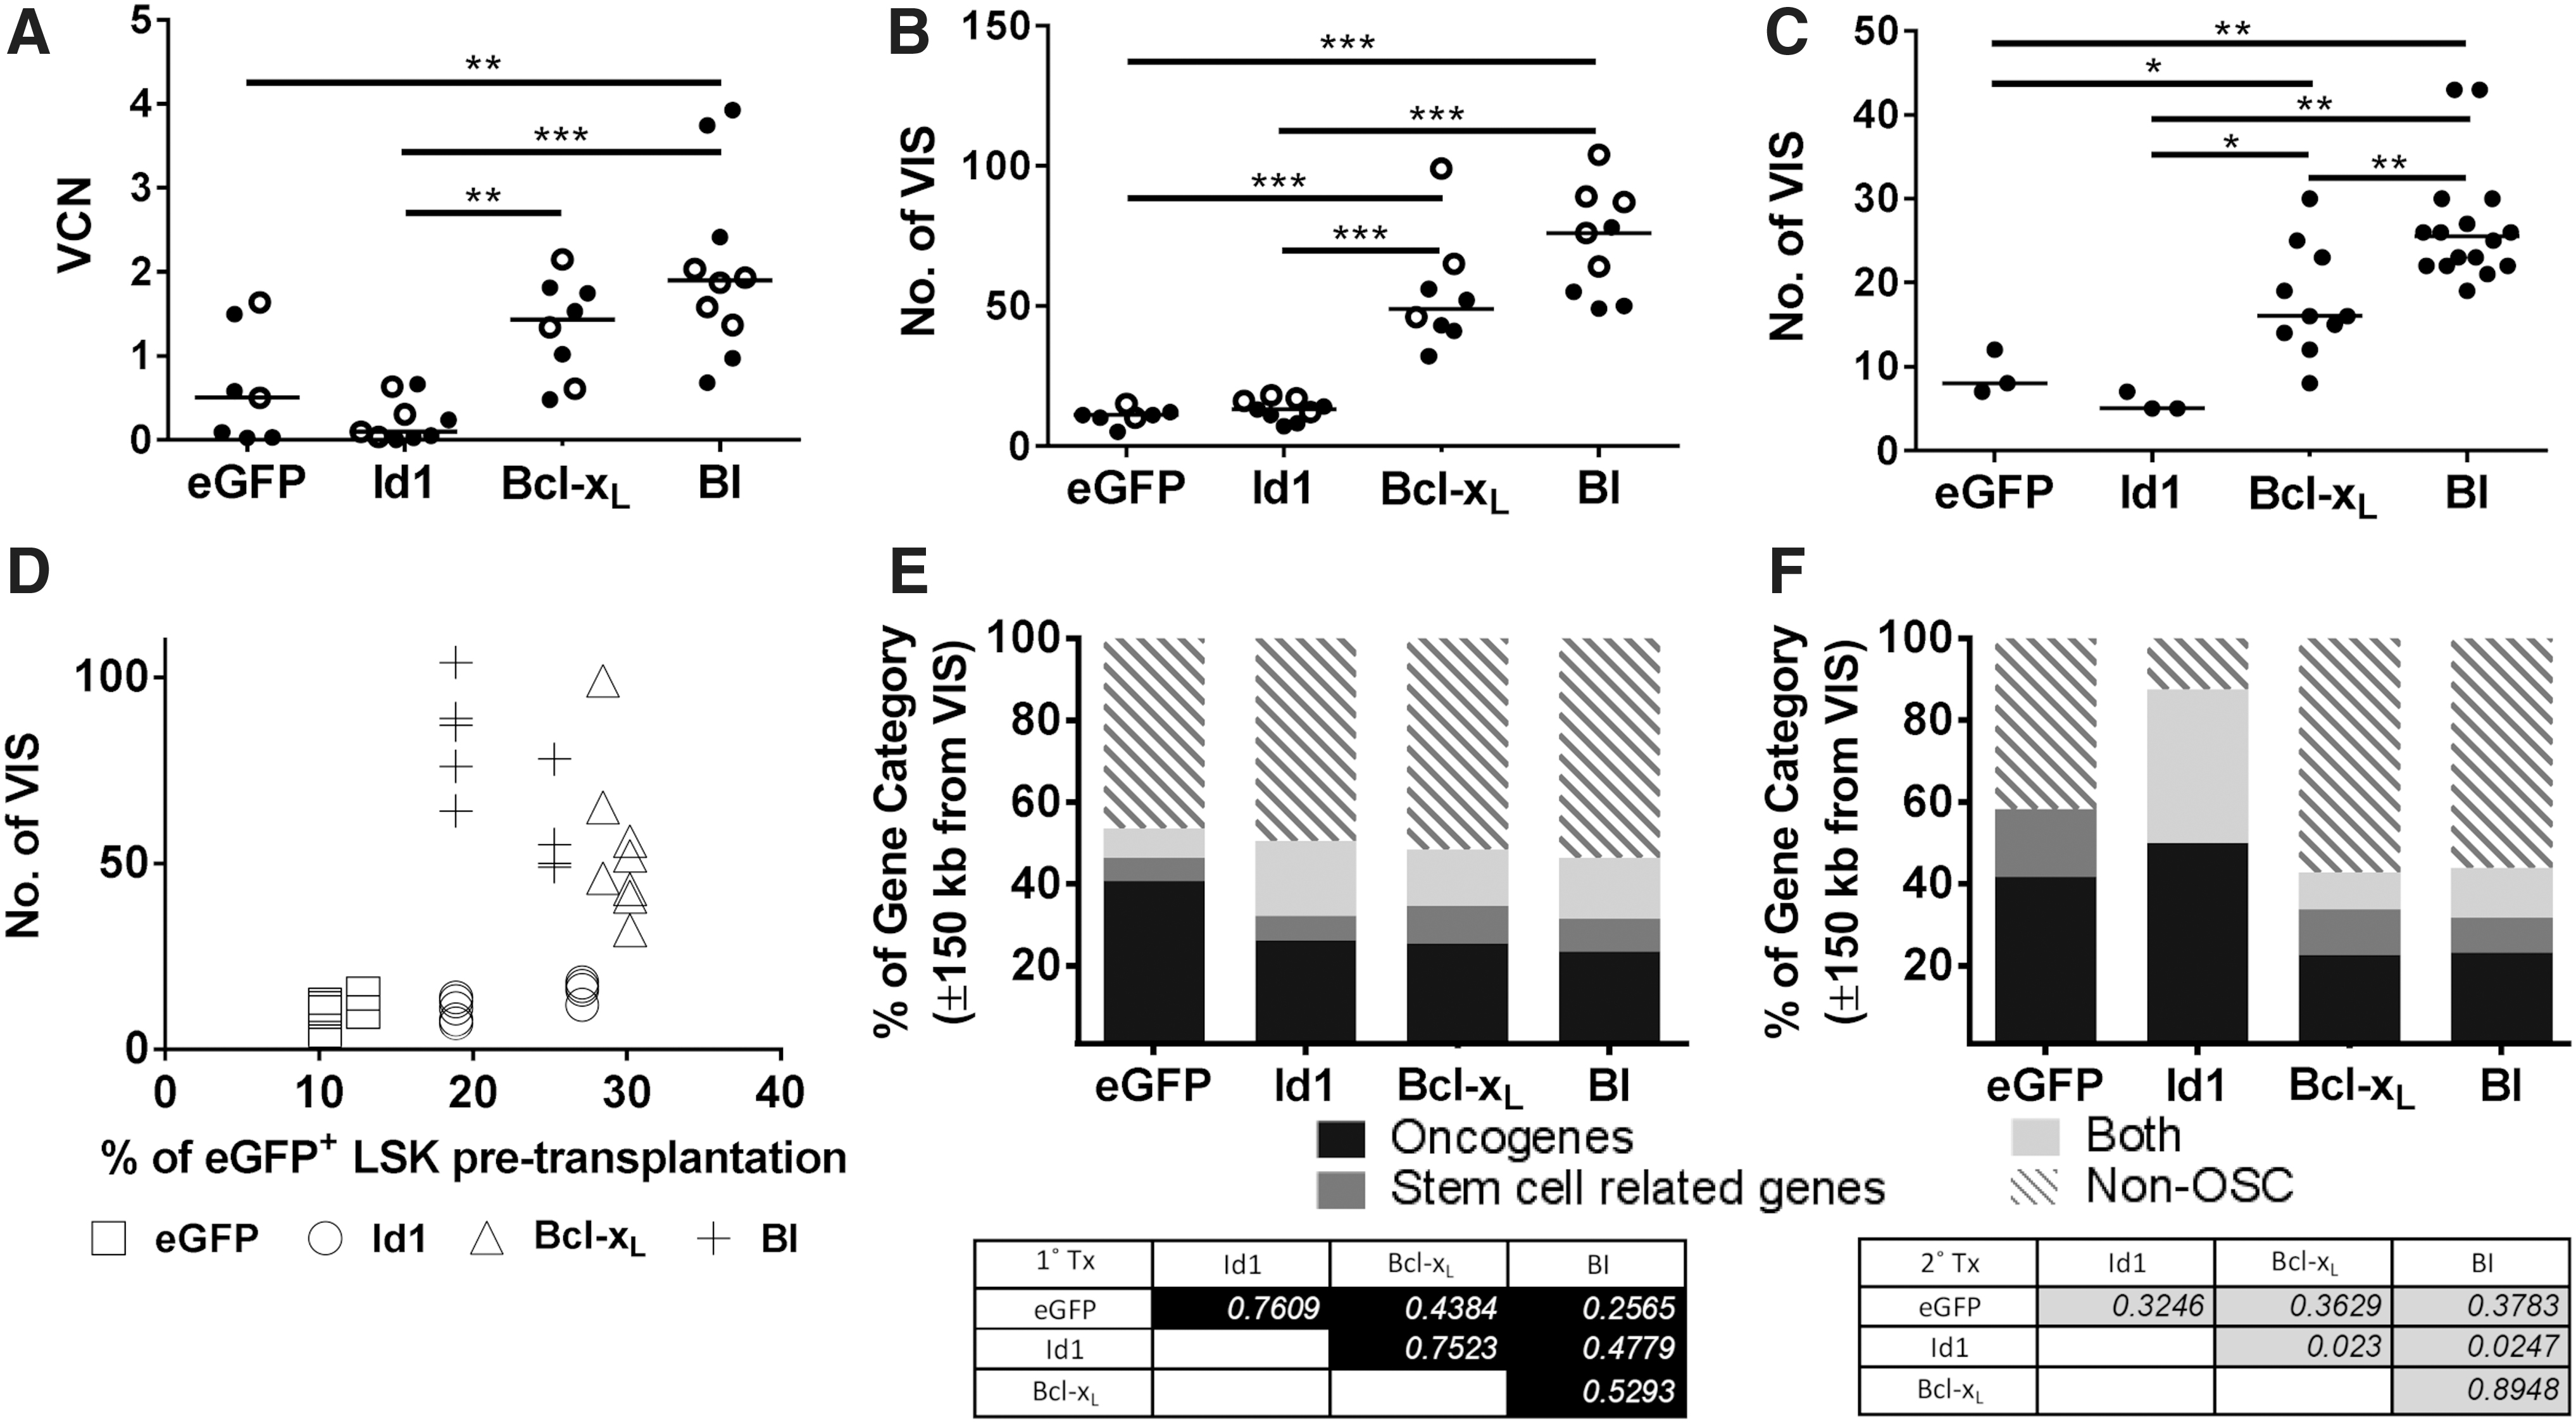
VCN and retroviral insertion site analyses.
Furthermore, agarose gel electrophoresis of integration site amplicons from LM-PCR suggested that many of the Id1-transduced cells were lost before the first sampling time (6 weeks after transplantation). Only low and decreasing numbers of individual amplicons were visible as discrete bands in PB samples over time in the Id1 animals (Supplementary Fig. S4, mouse #86, #88, and #90). In contrast, this was not the case for the vector control, Bcl-xL , or BI groups.
Clonal restriction in secondary recipients
From all Id1-HSPC-transplanted animals, only three mice (#40, #41, #89) had an eGFP-positive cell population above 3% in the PB (Supplementary Fig. S3A). Analysis of the integration sites revealed oligoclonal distribution of LV-tagged clones in the BM of these animals (Supplementary Fig. S5A). When the BM of the three Id1 mice was transplanted into secondary recipients, 2–3 clones were overrepresented in all mice (Supplementary Fig. S5A). Integrations inside Tle4 (intron 8) and Celf2 (intron 5) accounted for 57.8 ± 6.4% and 34.0 ± 13.0% of the sequence pool in the BM of secondary animals. Transcripts of both genes were found to be altered in the eGFP+ BM fraction of the secondary animals (Supplementary Fig. S5B, C). Interestingly, even though the Id1 group had a low overall number of VIS, the percentage of VIS near OSCG is the highest in the Id1 group, and all except one Id1 LV insertion site (±150 kb) in secondary recipients overlapped with OSCG databases. 15,41,42 This degree of OSCG enrichment was only observed for the Id1 group (Fig. 3F).
Selection of individual clones in secondary recipients was also observed in the other treatment groups (Supplementary Fig. S6). For instance, in the eGFP control group, clones with integrations near Stim2 and Ddx60 were predominantly found across the secondary animals (Supplementary Fig. S6A). When BM of mice #48, #93, and #94 of the Bcl-xL group was serially transplanted, two clones with either integrations, 13 kb downstream of Bcl2 or within Stag1, were found in all secondary recipients (Supplementary Fig. S6B). In another Bcl-xL transplantation group, the Crisp1 clone was most prominent in most mice (Supplementary Fig. S6C). Similarly, in the BI-group, we performed three separate serial transplantation experiments and observed 3–5 prevalent clones in the secondary recipients (Supplementary Fig. S6D–F).
Coexpressing Bcl-xL prevented Id1-mediated HSPC loss, did not release Id1 suppression of B cell development, and promoted short-term myelopoiesis
While the Id1-HSPCs were lost in recipients, coexpression with Bcl-xL (BI) prevented this loss, increased the progeny output (Fig. 2; Supplementary Fig. S2), and supported long-term reconstitution in secondary recipients (Supplementary Fig. S3A). The expression of Bcl-xL did not overcome the well-studied 30,33 Id1-mediated B-lineage suppression as depicted in Fig. 1F. The contribution of BI-HSPCs to the B lineage was lower compared with the nontransduced HSPCs (nt-HSPCs) within the BI group as well as both transgene-positive and transgene-negative fractions of the vector control group (Fig. 1F).
Moreover, coexpression of BI contributed toward a higher myeloid output (Fig. 1E), especially during short-term repopulation measured during week 6 after transplantation (Fig. 4). When gated on the Gr-1- and Mac-1-positive fraction on PB (Fig. 4A), over 90% of week 6 myeloid cells in primary recipients (Fig. 4B, C) and 77–98% in secondary recipients (Fig. 4C) were observed to be BI-transgene positive. Despite the high output from the BI-HSPCs, the overall WBC count (Supplementary Fig. S1A) and the myeloid count (granulocytes and monocytes; not shown) were normal, indicating the absence of abnormal myeloid expansion in these animals. Furthermore, the proportion of BI-myeloid and nontransduced myeloid cells equilibrated over time (Fig. 4C), suggesting that the high BI-myeloid content shortly after transplantation might be the result of rapid hematopoietic regeneration under transplantation stress.
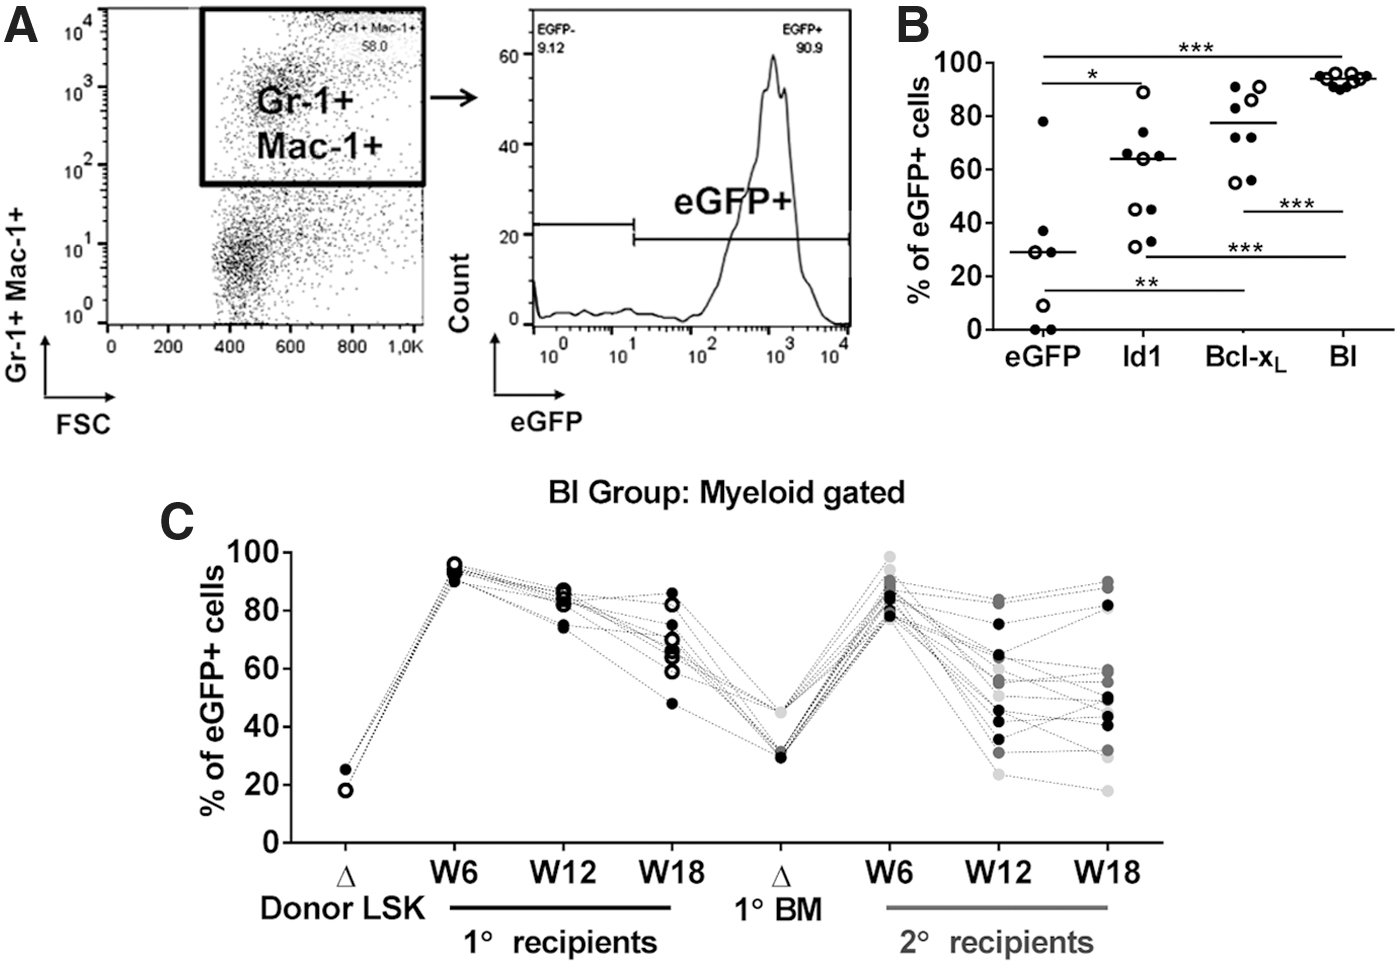
BI-HSPCs dominate the myeloid compartment during short-term engraftment.
Multiplexed in vivo competition assay reproduced observations from conventional transplantation experiments with fewer animals
To investigate whether dysregulation of other RVIS neighbors near Bcl-xL might influence hematopoiesis, we cloned cDNAs of the other 5 genes located within ±150 kb from the RVIS (Supplementary Fig. S7A) into our LV backbone (Supplementary Fig. S7B). However, to verify all candidates in vivo, a significant number of recipient mice would be required to achieve statistical relevance. To comply with the “reduction” and “refinement” of the 3R principle, we designed a multiplexed transplantation assay that allowed us to perform MCCR. To this end, LSK HSPCs were transduced with individual GOI-LV before being pooled 2 days later for transplantation without prior sorting so that transplanted cell populations also contained nontransduced cells that were subjected to identical treatment as the transduced cells, with the exception that nontransduced cells were not influenced by the transgene and vector integration. The GOI-LV transduction rate was measured individually and as bulk using eGFP as a reporter. Since each transduced population was distinctly tagged by the transgene, the progress and outcome of the competition could be traced by LV-GOI-specific-primer sets (Supplementary Table S1) using qPCR on the genomic DNA.
Assuming that each cell had a single integration event, the copy numbers of individual GOI were then normalized by the number of transplanted GOI-tagged LSK cells to obtain the output capacity of individual GOI-LSK. In our earlier integration analysis, we noticed that clonal selection occurred in most animals transplanted with transduced HSPCs, including the eGFP vector control (Supplementary Figs. S5A and S6). Therefore, the eGFP− population in the recipients was also normalized with the number of nt-HSPCs transplanted to serve as the baseline output capacity of nonmodified HSPCs. This calculation ignored the residual HSPCs in the recipients, which may lead to overestimation of the nt-HSPC output capacity, but should still serve as a more neutral reference than the eGFP+ population, which can be influenced by vector modification in terms of actual HSPC output. In the MCCR assay, the output capacity of nontransduced cells was used as a reference along with the vector control group.
To test if the MCCR assay yields similar results as conventional transplantation assays, an initial MCCR assay was performed with the same four populations analyzed above (Fig. 1A, B) by multiplexing the Bcl-xL , Id1, BI, and eGFP vector-transduced HSPCs (Fig. 5A). The results of the MCCR assay 18 weeks after transplantation were similar to our observations from the conventional transplantation study (Figs. 1 and 2). After 18 weeks, the Id1-LSK cells contributed the least in total BM cells, while the Bcl-xL -containing LSK (regardless of Id1 coexpression) had higher progeny output capacity compared to other LSK cells (Fig. 5B). Furthermore, B220+, CD3e+, and myeloid (Gr-1+ Mac-1+) cell populations in the recipient BM were sorted and the proportion of GOI-tagged cells was determined (Fig. 5C–E). The MCCR assay showed that Bcl-xL -LSK had the highest output of B220-positive cells, while Id1- and BI-LSK had a lower contribution to the B220+ fraction (Fig. 5C) as observed earlier in the traditional transplantation experiment. This showed that the MCCR assay is capable of gene function studies in different lineages as well. In the myeloid fraction, Bcl-xL - and BI-tagged cells showed higher output, whereas Id1-tagged cells had reduced output capacity (Fig. 5D), possibly due to overall reduction of Id1-tagged HSPCs that were depleted earlier. Results from the MCCR assay also suggested that Id1 expression reduced the output of CD3e+ cells as this population was repressed in Id1- and BI-tagged fractions (Fig. 5E).
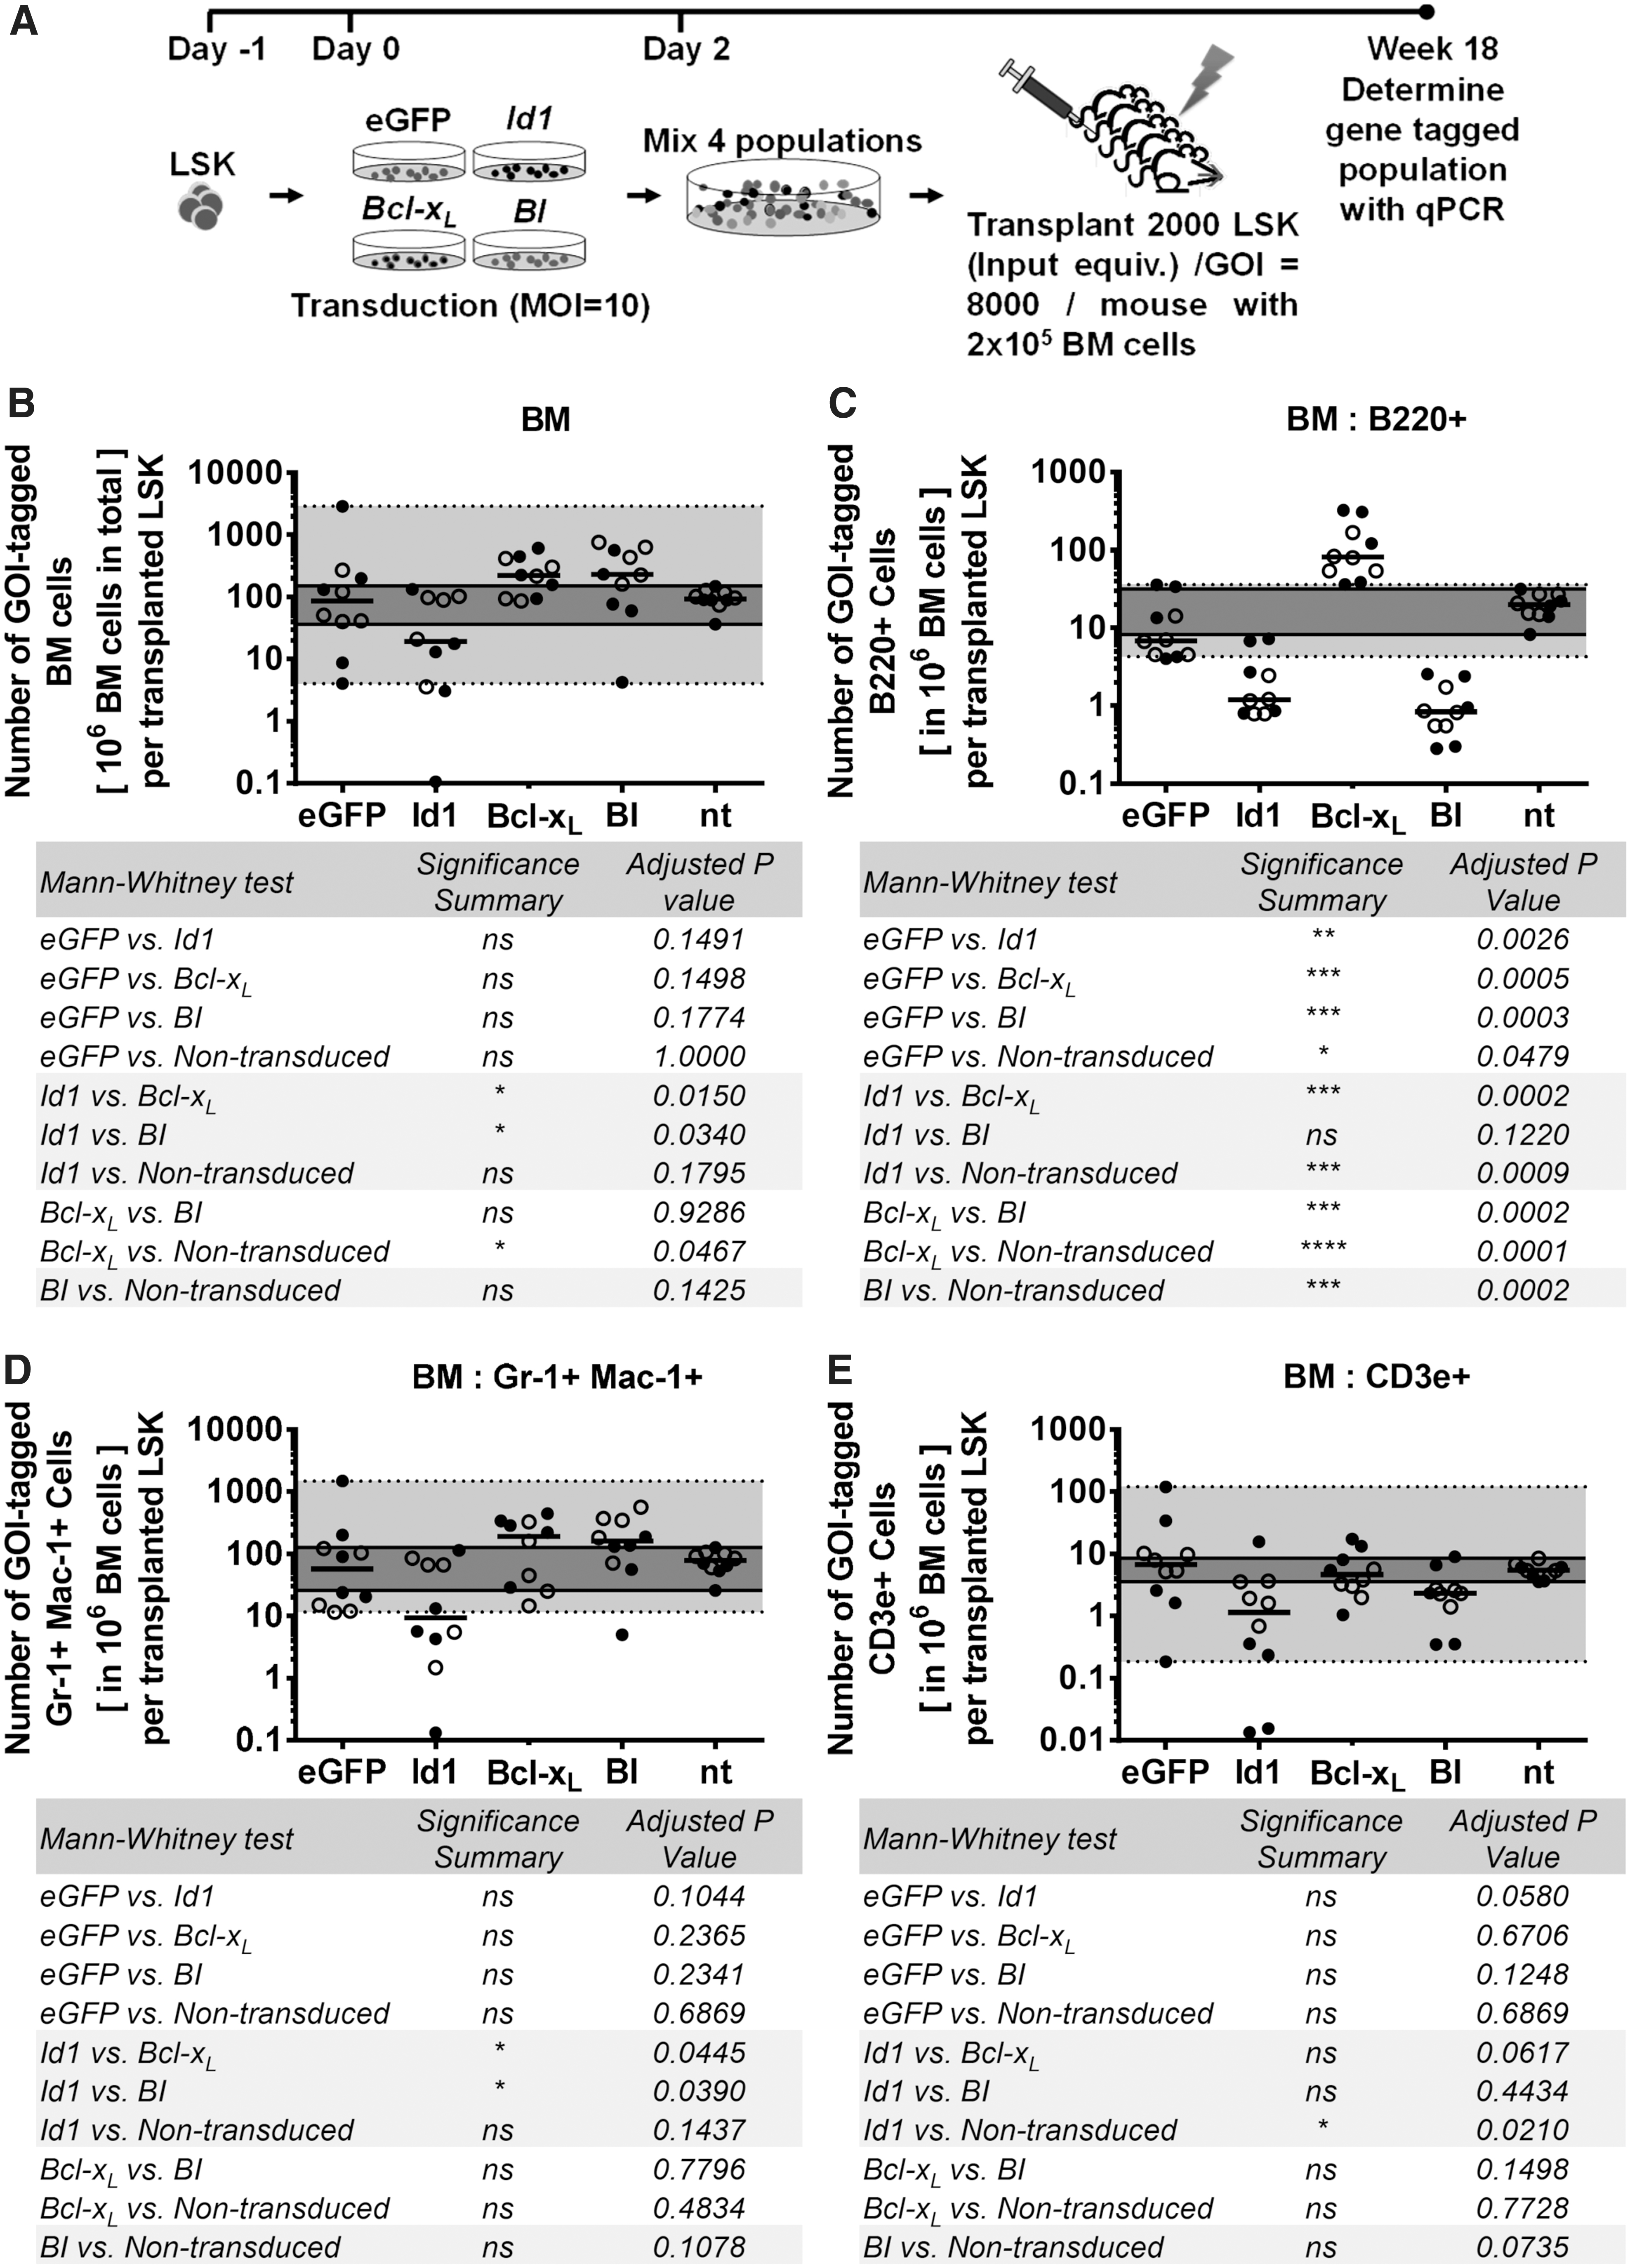
MCCR assay competing vector control, Bcl-xL
-, Id1-, and BI-transduced HSPC.
Multiple genes surrounding the CIS in the Bcl-xL locus can influence hematopoiesis
As the MCCR assay recapitulated our earlier observations, we next investigated all eight GOIs in a larger-scale MCCR assay. Each GOI was transduced into individual HSPC cultures before pooling them for transplantation (Supplementary Fig. S7C). All recipients (n = 10) from this assay exhibited comparable percentages of eGFP+ cells in the PB (mean ± standard deviation of 28.7 ± 4.1%) and showed no sign of abnormality in blood counts throughout the 18-week competition period (Supplementary Fig. S7D, E). Transgene expression levels determined in the BM cells of experimental animals demonstrated 19,000- to 60,000-fold higher expression in the eGFP+ compared to the eGFP− fraction (Supplementary Fig. S7F).
The MCCR assay was again shown to be consistent and reproducible as the reduced progeny output capacity of Id1-LSK cells and increased capacity of Bcl-xL -LSK cells were also observed in this more complex setting (Fig. 6). The reduced competitive output of Id1-LSK was seen in several PB samples acquired at different time points, as well as in spleen and BM. Based on the output capacity of each GOI in PB (Fig. 6) and referenced to the vector control-LSK and nt-LSK output capacities, we categorized the applied transgenes into three different phenotypic groups: (1) the neutral group, which did not significantly influence hematopoiesis, including the vector control, H13, and Cox4i2; (2) the reduction group represented by Id1, Mylk2, and Fkhl18, which negatively influenced hematopoiesis; and (3) the enhancement group with Bcl-xL and Tpx2 that increased the output capacity of HSPC.
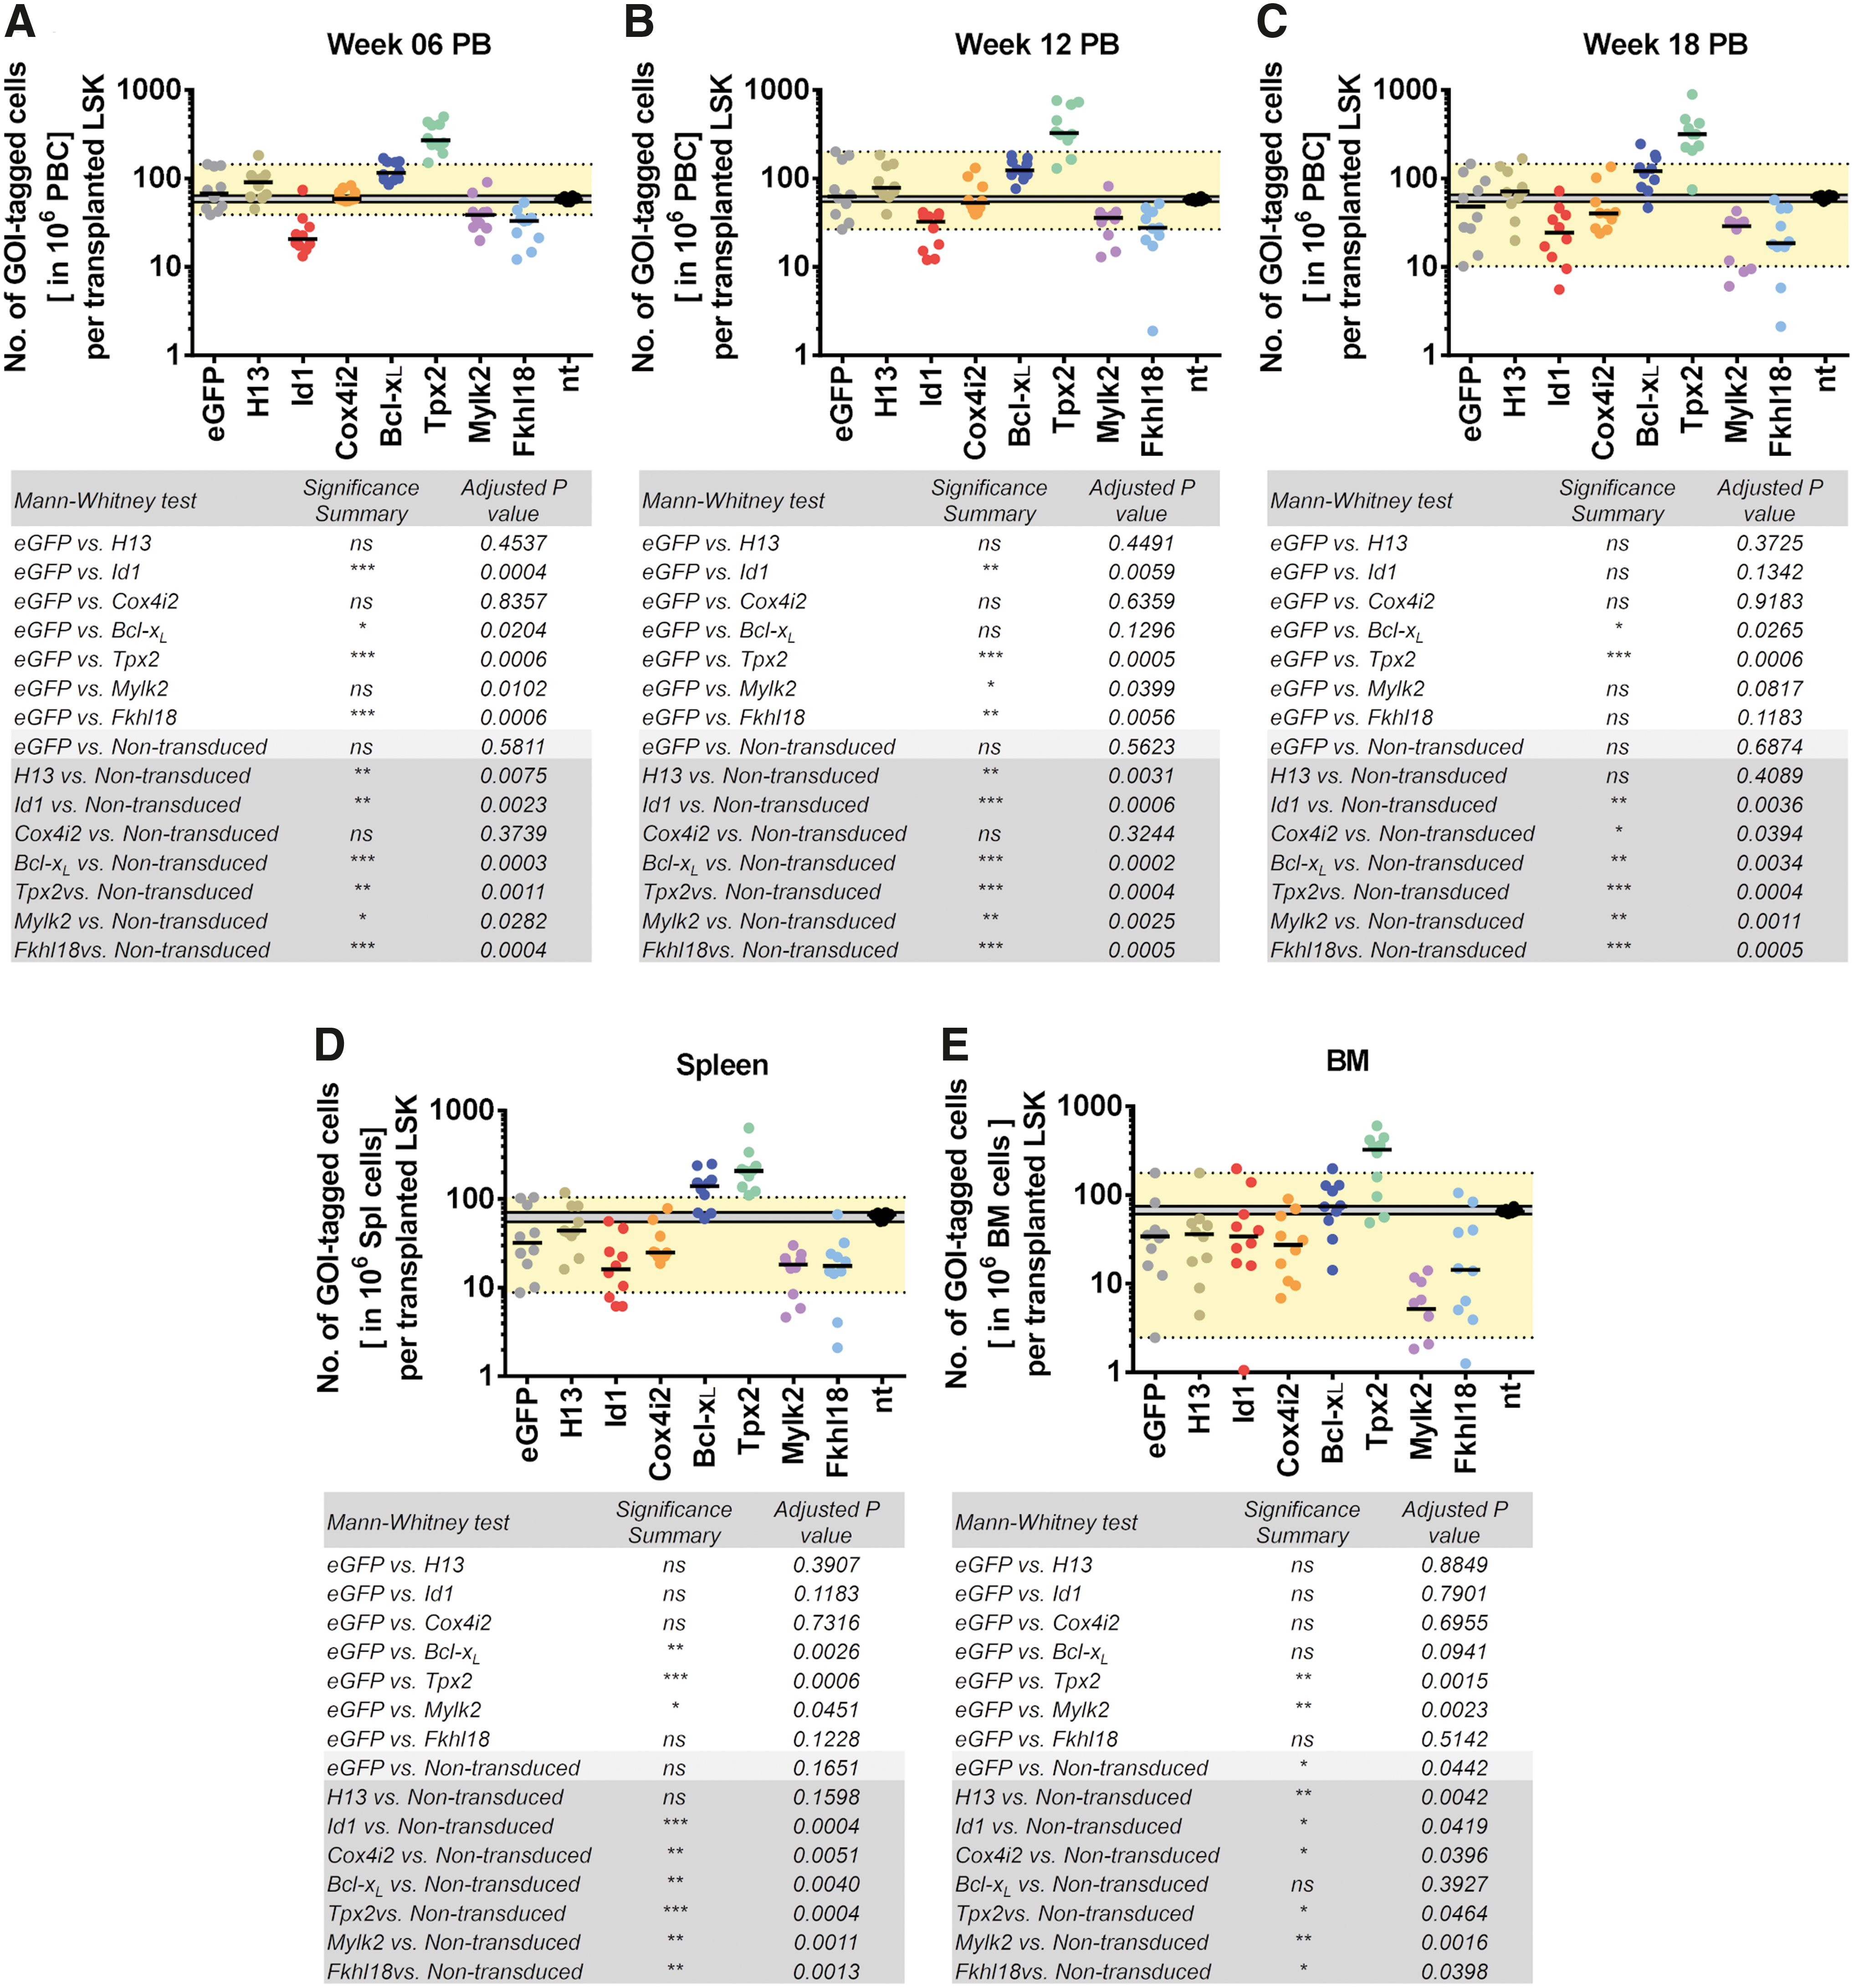
The progeny output capacity of HSPC was influenced by Bcl-xL
-surrounding genes. Output capacity of individual GOI-HSPCs and nt-HSPCs in PB from
Discussion
As previously reported by others and supported by our own observations (Supplementary Fig. S8), a single retroviral integration can dysregulate multiple surrounding genes. 2,10 –13 However, combinatory effects of two or more genes surrounding the RVIS are insufficiently covered in the literature. In this study, we demonstrated that more than one gene in the 150 kb vicinity of an RVIS Bcl-xL could influence hematopoiesis, and that cooperative interactions between neighboring genes may override the activity of single genes.
Under stress conditions (transplantation, myelodepletion, etc.), HSC rapidly enter into cell cycle to replenish the hematopoietic system and return to a quiescent state when homeostasis is reestablished. E47, the HLH transcription factor encoded by the E2A gene, is required to prevent HSC exhaustion during repopulating stress 44,45 and is essential for maintaining the integrity of HSC. 45,46 The ID1 protein, however, is a dominant negative inhibitor that prevents E47 from forming homodimers and, thus, prevents the transcription of downstream genes, including p21(Cdkn1a) and p27(Cdkn1b), which are crucial for HSC quiescence. 44 –49 It is reasonable to speculate that our Id1-HSPC were unable to establish quiescence under engraftment stress, which led to the observed loss of Id1-transduced cells. This is in line with a recent study by Singh et al., which demonstrated the increased expression of p21 and p27 in Id1 knockout HSC compared to wild-type HSC. 50 These Id1 −/− HSC also demonstrated enhanced reconstitution ability as they were able to reconstitute murine hematopoiesis up to seven serial transplantations, while the wild-type BM cells were depleted at the 4th serial transplantation. 50
Similar to E2A-knockout, 44 –46 Ku70-deficient HSC demonstrated loss of quiescence through downregulation of p27 and p57 expression, which leads to defects in self-renewal and competitive repopulation ability. Overexpression of Bcl2 restored quiescence and rescued HSC repopulation capacity in this setting. 51 Like its family member Bcl2, Bcl-xL can delay cell cycle entry or restore quiescence through p27 52,53 and p57(Cdkn1c) 51 upregulation. Therefore, we speculate that coexpression of Bcl-xL overrides the Id1-induced loss of HSPC by restoring quiescence through cell cycle regulatory pathways in BI-HSPC as Bcl2 does in Ku70 −/− HSC. 51 It would be possible to further dissect the interaction among these proteins in their respective knockout or transgenic animals. 24,45,54
Our cell cycle analyses of the lineage negative BM populations isolated from primary recipients showed an increased G0/G1 population for Bcl-xL - and BI-transduced cells (eGFP+) compared to their nontransduced (eGFP−) counterpart, which indicates that lineage-negative progenitor cells are more quiescent when Bcl-xL is expressed. In contrast, Id1 + lineage-negative progenitor cell profiles were similar between transduced and nontransduced populations (Supplementary Fig. S9A, B). Furthermore, reverse transcription quantitative PCR (RT-qPCR) experiments to determine expression of cell cycle regulators (p21, p27, and p57) and indicator (Ki67) from eGFP+ and eGFP− LSK cells sorted from the BM of primary recipients indicated lower p21 expression in Id1 LSK, with no significant changes in p27, p57, and Ki67 expression. In contrast, most Bcl-xL and BI-LSK showed elevated p57 accompanied with decreased Ki67 expression, a signature of the quiescent state (Supplementary Fig. S9C-F; qPCR protocols described in Supplementary Data, primers are listed in Supplementary Table S2). As these Id1-LSK cells were harvested from animals with clones selected to avoid depletion, they might have been selected for features that enabled them to restore quiescence after stress hematopoiesis, such as replenishing the recipient's BM after transplantation. Therefore, 18 weeks after transplantation, these Id1-LSK cells showed no difference in ki67 expression level when compared to the eGFP− LSK. Interestingly, the sample obtained from mouse #41 (Supplementary Fig. S9C, in red) expressed higher levels of cyclin inhibitors and lower Ki67 compared to samples from the other two Id1 animals. The Tle4 clone that later developed into the most prominent clone in all secondary animals was detected in this mouse (Supplementary Fig. S5A). The expression level of E2A, an upstream regulator of all Cdkn1, remained relatively stable in all transgene groups (Supplementary Fig. S9C–F).
Overexpression of Id1 is known to impair B cell development, 30 likely through binding with E2A proteins that are crucial for both HSC integrity and B cell development. 45,46,54,55 Coexpression of Bcl-xL with Id1 restored the engraftment capability, but not the B-lineage impairment in BI-HSPC. This suggests that Bcl-xL restored the engraftment capability of these cells through distinct pathways, which are independent of the Id1 and E47 interactions. Concurrently, Id1 is also a crucial gene for myelopoiesis and a downstream effector of the IL-3 signaling pathway. We observed myeloid bias in all Id1-HSPC-transplanted mice, regardless of Bcl-xL coexpression (Figs. 1E and 5D), with the exception in Fig. 5D, in which the loss of Id1-derived myeloid cells may be due to overall loss of Id1 cells (Fig. 5B). Even here, the few mice that retained Id1 cells in BM (Fig. 5B) contributed mainly in the myeloid compartment (Fig. 5D) compared to the lymphoid compartment (Fig. 5C, E).
Unexpectedly, we observed that nearly all myeloid cells detected during early hematopoietic reconstitution originated from BI-HSPCs in BI-primary and BI-secondary recipients (Fig. 4B, C) without disruption of the myeloid compartment or induction of adverse effects (Supplementary Fig. S1). This suggests that Bcl-xL and Id1 collaborate to replenish the myeloid compartment under stress conditions rapidly. This observation may have clinical relevance, for example, to foster more rapid myeloid recovery after transplantation in case of invasive fungal or bacterial infections by transiently elevating the expression of Id1 and Bcl-xL with small molecules. BI coexpression also increased the output capacity in both mature and primitive compartments (Fig. 2).
Self-inactivating lentiviral vectors (SIN-LV) have not been observed to cause adverse effects in gene therapy patients to date, and the SIN configuration is considered to be safer in comparison to earlier LTR-driven vectors. However, disruption of neighboring genes by SIN-LV has been documented in gene therapy laboratory models and patients. 8,9,11,56 –58 In our LV integration analysis, limited numbers of clones (<5) were found in primary transplanted animals of all transgene groups (Supplementary Figs. S5A and S6). Further clonal restriction was observed in all secondary animals as 2–3 clones prevailed in all mice within the same secondary transplant group (Supplementary Figs. S5A and S6). However, only the Id1-vector demonstrated a preference toward integrations near (±150 kb) OSCG in the secondary animals. Among all eight recovered VIS, only the insertion site near Oxct1 has no OSCG within the ±150 kb window. Yet, AW549877, a gene that matched the stem cells database, 42 was found to be 2.5 kb outside our ±150 kb window. Of the two most prominent clones in all secondary animals, Tle4 is mainly described as a tumor suppressor. 59 Loss of Tle4 function confers proliferative advantage to AML1-ETO leukemic cells 59 and was described as one of the recurring somatic mutations in AML. 60 Celf2 is documented as a stem cell-related gene that is expressed higher in HSC compared to later progeny 61 and is also listed in the Bushman oncogene list. Coincidentally, integration near Tle4 was found in dominant clones in two other lentiviral-based studies. 37,62
As we used a strong SFFV promoter/enhancer element in all constructs, clonal imbalance after serial transplantation can be expected. RT-qPCR on eGFP+ and eGFP− sorted BM of Id1-secondary recipients revealed altered expression of Tle4 and Celf2, the two most prominent VIS in the Id1-group (Supplementary Fig. S5B, C). The dysregulation of the two genes might be associated with the prevalence of Id1-HSPC, but these observations require follow-up studies before definitive conclusions can be drawn. In the Bcl-xL group, a clone with an integration near the proto-oncogene Bcl2 became readily apparent.
Considering the costs and welfare of experimental animals, in vitro assays 63 are sometimes preferred over transplantation experiments to study gene effects in HSPCs. While in vitro assays have some beneficial characteristics, misinterpretation of data due to artificial in vitro systems is a common limitation. For example, Id1-HSPC exhibited reduced progeny output in our experiments (Figs. 2, 5, and 6), but outcompeted the nt-HSPCs in our in vitro long-term cultures (Supplementary Fig. S10). This is not surprising as others have also demonstrated that Id1 immortalizes hematopoietic progenitors in vitro. 32 This is also the reason that in vivo transplantation assays are still the gold standard for HSPC studies.
To overcome these challenges, and to comply with the “reduction” and “refinement” of the 3R principle, we developed the MCCR assay inspired by the competitive repopulation assay described by Harrison et al. 64 to screen multiple GOIs simultaneously in vivo using far fewer animals than would be required in conventional transplantation settings. For example, in our larger MCCR assay shown in Supplementary Fig. S7 and Fig. 6 and 10, recipients were transplanted with 8 transduced populations. In a conventional transplantation assay, at least 24 mice (3 mice per transduced population) would have been used for such a screening experiment. Thus, the MCCR increases animal welfare by reducing the number of experimental mice needed, which results in reduced animal costs per experiment as well as the required hands on time for animal experiments.
In our study, the MCCR assay not only recapitulated our conventional transplantation experiments by showing the effects of Id1, Bcl-xL , and BI on HSPC (Fig. 5), but also allowed us to classify our GOIs in the Bcl-xL locus into three categories (Fig. 6): (1) the neutral group (vector control, H13, and Cox4i2); (2) the reduction group (Id1, Mylk2, and Fkhl18); and (3) the enhancement group (Bcl-xL and Tpx2). The assay can also be employed to study any desired lineage and screen for multiple genetic elements (cDNAs of different genes, cDNA of different splice variants of a gene, microRNA, long non-coding RNA, circular RNA, etc.) that influence lineage development in the native in vivo microenvironment (Fig. 5C–E). For example, we detected Id1-induced B cell suppression in BI-HSPCs when the B220+ fraction from BM was sorted before performing GOI-specific qPCR (Fig. 5C). Furthermore, in combination with integrating DNA barcode vectors, 62,65 the MCCR has the potential to be used to study the impact of pretransplantation manipulation (e.g., different culture conditions or handling) on hematopoietic cells, thus not only reducing the required numbers of recipient animals, but also the likelihood of in vitro artifacts.
Our MCCR assay identified Bcl-xL and Tpx2 as genes that can confer improved competitive output to HSPCs. While Bcl-xL was previously shown to increase HSPC fitness, 21,22 Tpx2 has not been described in this context. Tpx2 is vital for mitosis and spindle assembly, 66 is highly expressed in a wide variety of tumors, 67 and is a collaborating partner that stabilizes the proto-oncogene Aurora A kinase. 68 Further experiments should be conducted to understand the impact of Tpx2 on HSPCs.
Like with any screening method, there are limitations to the MCCR. The most obvious limitation is that the VCN of individual GOI-LV in each transduced cell should be equal, and ideally, a single copy in each cell is desired, especially when barcoded vectors are used. In our study, we tried to control the VCN by limiting the transduction rate. Based on several earlier publications, 69 –71 at the highest transduction rate achieved in our experiments (data not shown; 40% in both H13 and Cox4i2), >70% of our transduced cells are expected to have single integrations. However, this should be taken only as a reference, since selection might favor or be biased against certain GOIs depending on the VCN (expression level) at the end of the competition. Although this can be further addressed, for example, by measuring the VCN of individual clones grown in semisolid culture, confirmatory experiments are recommended as for any other screening method.
Furthermore, selection based on vector integration site can occur, including the cells modified with the control vector. Retrospectively, this could have been overcome by using a three population congenic model utilizing the CD45.1, CD45.2, and CD45.1/CD45.2 hybrid, to distinguish GOI-transduced, nontransduced, and recipient-generated progenies. In the MCCR assays presented in this study, we have only tested the overexpression aspect of RIM dysregulation and have not tested other possible genotoxic outcomes, such as vector-induced truncation of genes, altered splice forms, gene fusion or gene inactivation. We have also tested only one combinatory event with the Bcl-xL and Id1 coexpression. Combinatory events should be tested in the future to understand the impact of the genes surrounding a retroviral CIS as well as potential interactions among gene products that may influence cell behavior. In addition, systematic evaluation of individual transgene expression levels in the MCCR-transplanted animals could offer more insight, such as the selection of transduced populations based on transgene expression levels. With appropriate MCCR design, these questions can be answered with fewer experimental animals.
In summary, the pilot MCCR assay developed in this study can aid future studies to adhere to the 3R principles by reducing the number of experimental animals when screening activities of multiple genes in vivo. Furthermore, we have demonstrated that more than one gene within an RVIS can influence hematopoiesis individually or cooperatively when overexpressed, and that the cooperative interactions between neighboring genes may override the activity of single genes. Therefore, to better understand RIM in clinical cases and to avoid neglecting potential candidates when searching for novel OSCG, it is important to include genes and elements surrounding the VIS of interest as study subjects.
Footnotes
Acknowledgments
The authors would like to thank Tobias Maetzig for his critical input to this study, Matthias Ballmaier (Sorter Lab, Hannover Medical School) for cell sorting procedures, Jörg Frühauf (Institute of Radiology, Hannover Medical School) for assistance with the mouse irradiation procedure, Rena-Mareike Gastmeier (Institute of Experimental Hematology, Hannover Medical School) and staffs at the animal facility of Hannover Medical School for mouse visiting and caring, and the team at Hannover Medical School RCUG for the processing of samples for Illumina sequencing. We are also grateful to Peter Andrews (Department of Biomedical Science, The University of Sheffield) for critical input on stem cell biology and constructive suggestions related to this work.
Authors' Contributions
T.-C.H., O.K., B.F., A.S., and C.B. designed the study. T.-C.H., M.S., M.R., G.P., V.D., and O.K. performed the experiments and collected data. T.-C.H., M.R., M.M., and M.B. analyzed and interpreted data. T.-C.H., M.M., M.R., O.K., A.S., and C.B. wrote the article.
Author Disclosure
The authors declare no conflicts of interest.
Funding Information
This project has received funding from the European Union's Horizon 2020 research and innovation program under grant agreement No. 666908, the Deutsche Forschungsgemeinschaft [DFG; through SPP1230, SFB738, Excellence Cluster REBIRTH (EXC62/2), FE568/11-1, RO 5102/1-1], the German Federal Ministry of Education and Research (BMBF; through PIDNET and IFB-Tx), and the Federal State of Lower Saxony (through research project R2N).
Supplementary Material
Supplementary Data
Supplementary Table S1
Supplementary Table S2
Supplementary Figure S1
Supplementary Figure S2
Supplementary Figure S3
Supplementary Figure S4
Supplementary Figure S5
Supplementary Figure S6
Supplementary Figure S7
Supplementary Figure S8
Supplementary Figure S9
Supplementary Figure S10